


March 2023 Alaska Climate Review
Large regional variability returns

Most aspects of the March climate showed significant regional variably. Given the size of Alaska and the complex topography this is the usual state of affairs.
I’m trying something different this month, with the monthly recap all in one long post. While this was necessitated on my part because of work travel, I’ve been wondering if one longer post would be more useful than two shorter posts that split up the information. But what do you think? I’ve got a poll at the end of this newsletter if you’d like to offer your opinion.
Temperature
Most of mainland Alaska had near to above normal temperatures for March, while Southeast was cooler than normal. Figure 1 plots the station specific departures. The largest departures were on the North Slope, where several stations averaged more than 10°F above normal. During the month reported temperatures around the state varied from a high of 55°F at Klawock on March 27th to a low of -48°F at the Manley Hot Springs 15NE cooperative station on March 5th.
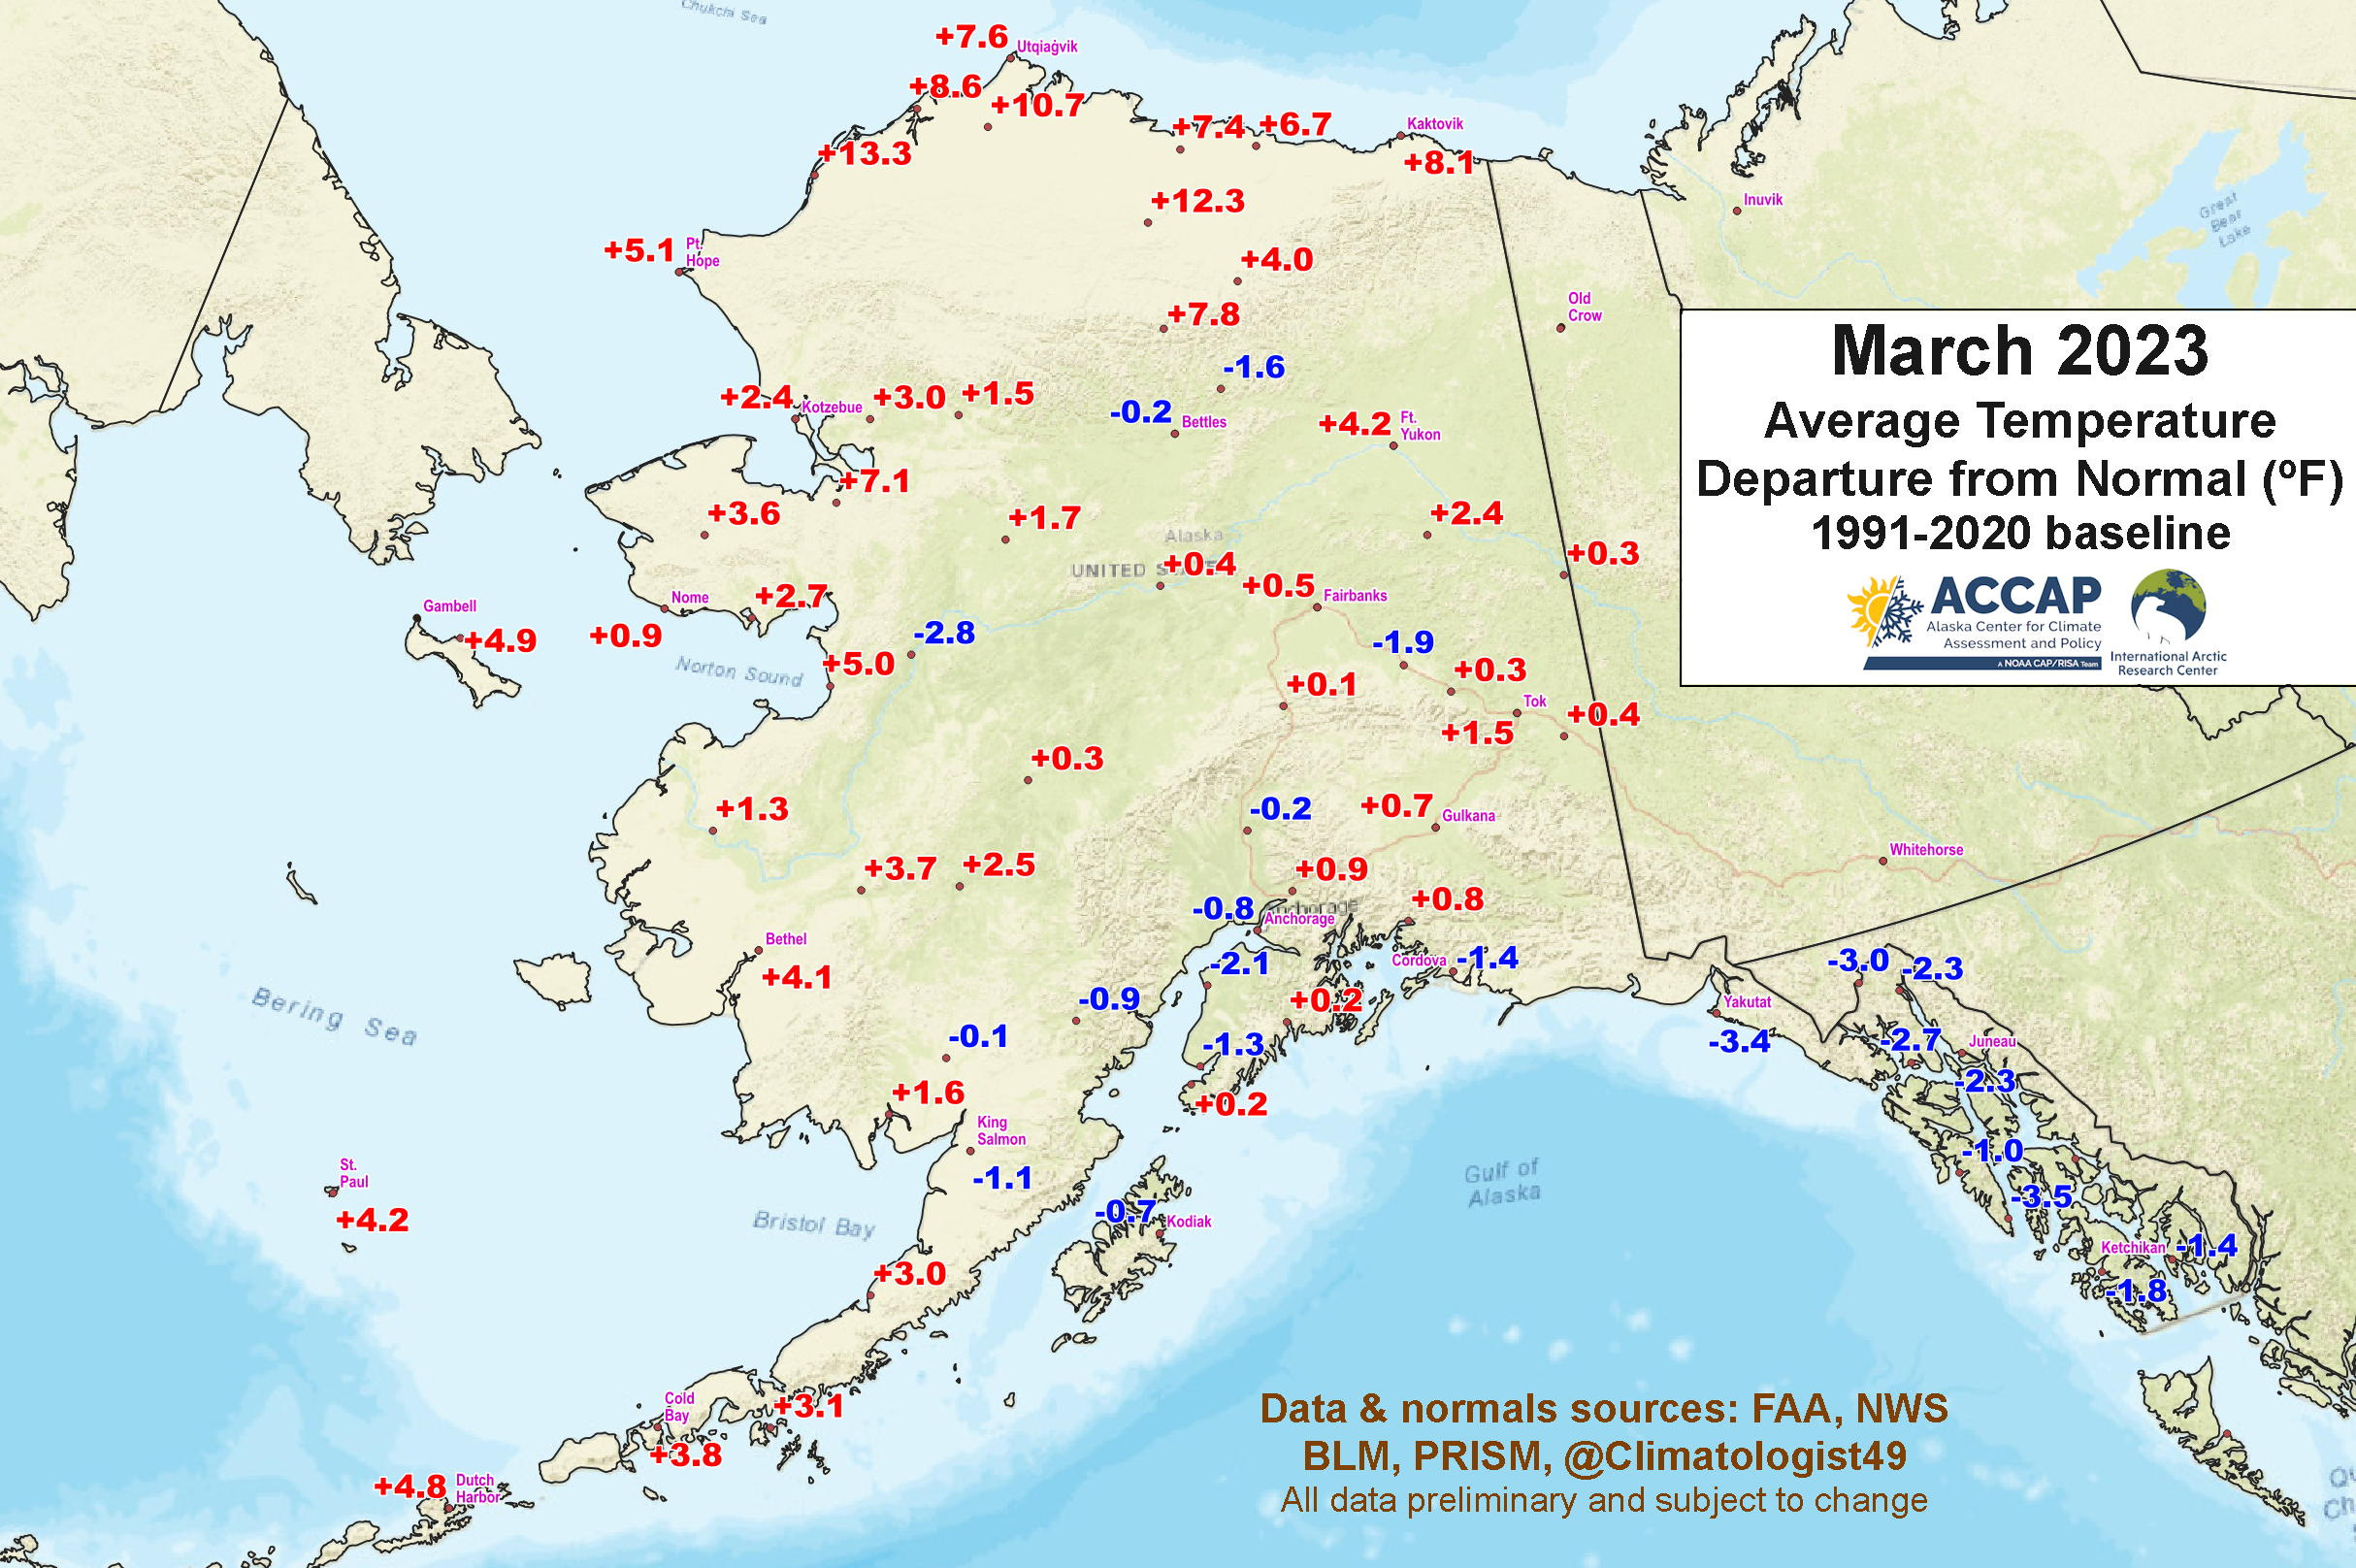
The ERA5 temperature departures are plotted in Fig 2 and provide additional details. Differences from the station based departures are generally small.

Precipitation and Snowfall
The big story in March was the excessive precipitation across northwest Alaska. Figure 2 shows the percentage of normal (1991-2020 base) from the ERA5 reanalysis. Monthly precipitation from multiple storms during the month was two to four times normal from the Yukon delta north into the southern Chukchi Sea. In a large swath from the southern Seward Peninsula coast northward this was highest March precipitation in the ERA5 (1940-2023) based on analysis by B. Brettschneider. At the station level, both Nome and Kotzebue set new records March 24-hour and 3-day precipitation totals: more details on this extreme event in my post here. Nome Airport finished up with the third highest March precipitation on record (since 1907). Regrettably the NWS automated weather station precipitation at Kotzebue was unreliable during a severe blizzard late in month so the monthly total is “unknown but high”. In contrast, below normal precipitation was the rule in an arc from the Aleutian Island northeast through Bristol Bay, Southcentral and into Southeast. However, this hides some extremely small variability. For example, Anchorage Airport had only 20 percent of normal precipitation in March but in the mountains southeast of Eagle River (so less than 25 miles Anchorage Airport), one reliable manual observation reported March total precipitation at about 170 percent of normal.

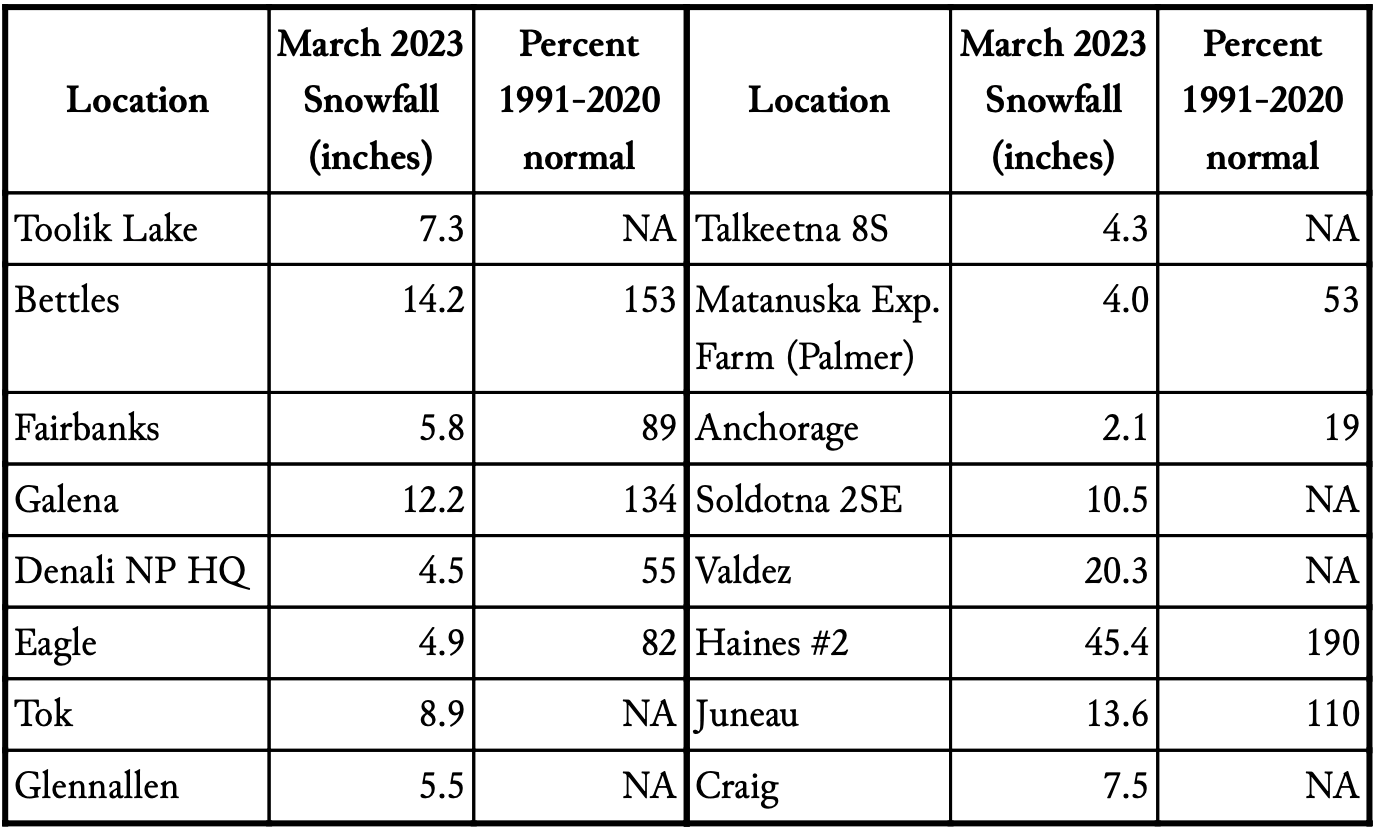
Snowfall departures from normal still closely follow precipitation in March over most of Alaska since most precipitation typically falls as snow. Fig. 4 gives a sampling of February total snowfall as reported by NWS forecast offices and volunteer observers. The highest total was 93.5 inches at Main Bay cooperative station in Prince William Sound, southeast of Whittier. Note that there are no reliable actual snowfall observations in the area that had the excessive precipitation in northwest Alaska.
For a recap of late March 2023 snowpack conditions around Alaska check out my post here.
Sea Ice and Sea Surface Temperatures
Figure 5 shows the Bering Sea daily sea ice extent from the National Snow and Ice Data Center through the end of March. Sea ice extent in the Bering dropped 23 percent during the past ten days of March due to the stormy weather and frequent south winds. Overall, the average extent for March 2023 was the 11th lowest in the past 45 years.

Sea ice thickness at larger spatial scales is much trickier to estimate than ice extent, and it’s only in recent years that remote sensing technology has progressed enough to allow for reasonable estimates of both thin and thick sea ice. Figure 6 shows the sea ice as a percent of the 2011-2022 median for the last week of March. In the northern Bering Sea, ice thickness was mostly above the median This was especially the case on south facing coasts, where the south winds had repeatedly pushed ice up. In contrast, ice was thinner on north shore due to multiple periods of open waters forming during storms. The near-shore Beaufort Sea had unusually thin ice in March. This is likely due to frequent west winds over the past couple months that have kept thicker ice from the northern Canadian Arctic islands from approaching the coast in the Beaufort Gyre. If east winds return during later April and May this could mean an early start to the open water season in the southern Beaufort Sea.

For more details on sea ice at both the Arctic and Alaska scales through late March see my post here.
Sea surface temperature departures from normal for March are shown in Fig. 7 and have the same basic pattern as in February. However, the southern Bering Sea, beyond the ice edge, was not as dramatically far above normal as the previous month. Gulf of Alaska temperatures near the Southeast Alaska and British Columbia coasts were slightly below normal, reflecting the cooler than average air temperatures.

Thank you Rick. Great product(s)!