Spring 2023 Sea Ice Update
Arctic-wide and near-Alaska sea ice is on the low side.

Arctic Sea Ice
Arctic-wide sea ice reached the seasonal maximum extent the first week in March according to analysis by the National Snow and Ice Data Center. The maximum extent was the fifth lowest in the 45 years of the satellite record and 7 percent below the 1981-2010 average maximum extent. Arctic ice extent in the winter and spring is almost entirely dependent on what’s happening in what are sometimes called the “marginal seas”, e.g. Bering Sea, Sea of Okhotsk, and Gulf of St. Lawrence and increasingly the Barents Sea. Changes in the September minimum ice extent (which are much greater compared to the maximum) are dependent on ice melt in regions that are mostly or completely ice covered in winter and spring.
Sea ice extent is comparatively “easy” to measure from satellite and provides a simple yes/no measure of whether there is sea ice in an area, by convention a minimum of 15 percent ice coverage. However, this tells us nothing about the quality or thickness of the ice. Ice thickness from satellites is much more difficult and has only become operationally available recent years. Modeling sea ice thickness has also advanced significantly in that time, and Fig 1. shows the model thickness around the Arctic as of March 26 this year (left) and last year on the same date (right). Even a cursory glance shows there is much less area with ice 3 meters or more thick this year compared to 2022. This is especially evident in the southern and eastern Beaufort Sea and the Chukchi Sea near Alaska as well as near the North Pole. The comparatively thin ice near Alaska and northwest Canada is worrisome for the upcoming summer on multiple fronts, including ecosystem and community impacts now through the fall (at least). There is thicker ice this year in Fram Strait between Greenland and Svalbard but that ice is destined to drift into the North Atlantic and melt away in the coming months.

Bering Sea
Sea ice in Bering Sea has been on something of a yo-yo since late January, with repeated expansions and contractions reflecting variations in the weather pattern and associated storm track, but mostly with extent remaining below the 1991-2020 median (Fig. 2). With the latest round of stormy weather and south winds, it’s now clear that the maximum ice extent was reached in mid-February.
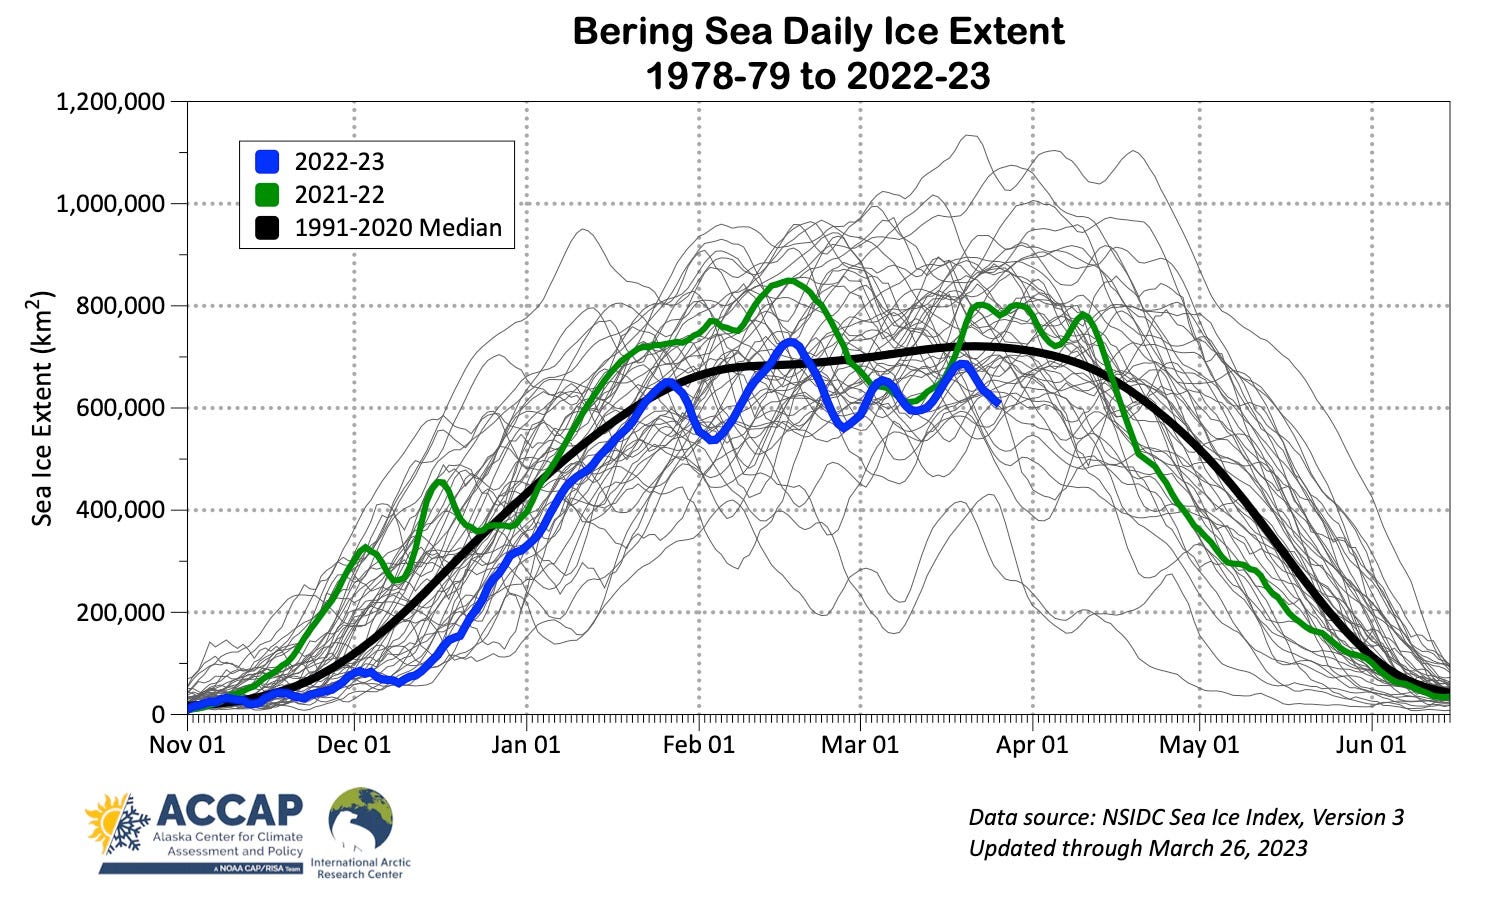
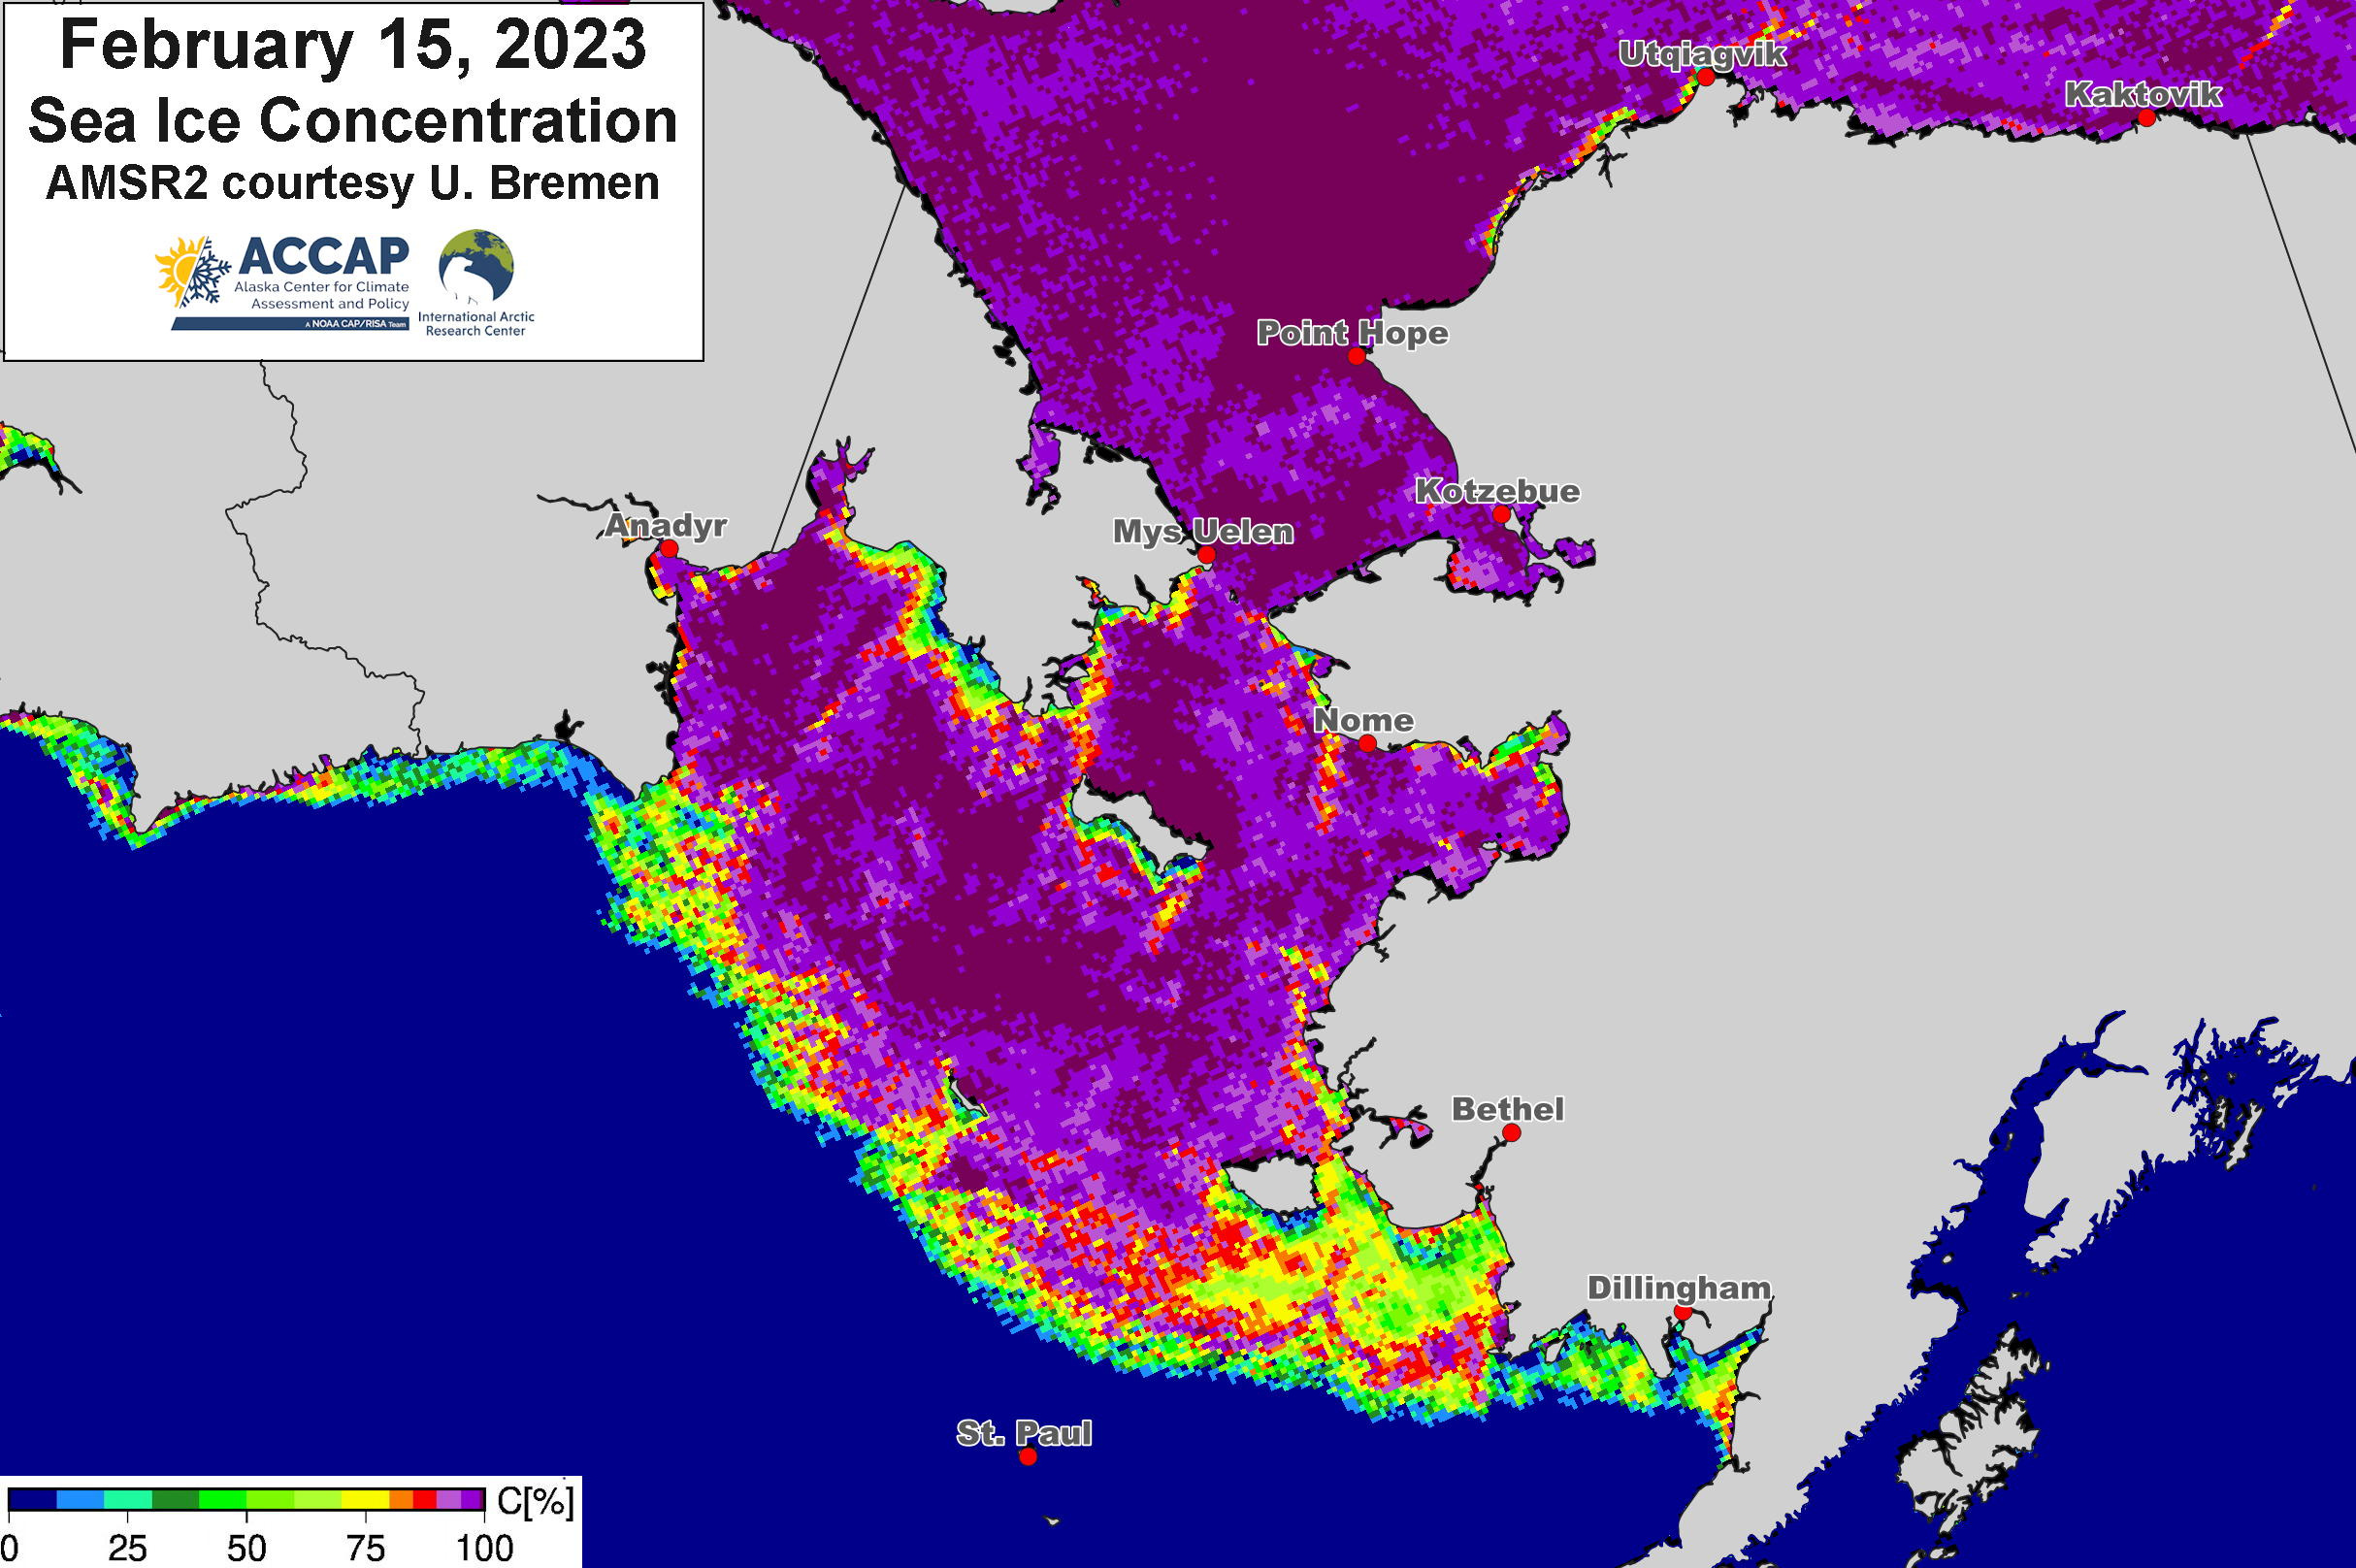
Figure 3 shows the sea ice concentration at the peak extent from the AMSR2 high resolution satellite data. The ice edge came within about 50 miles of St. Paul (also in mid-March) but that was it. This is the seventh year since 2014 when the ice did not reach St. Paul even briefly at any point in the season. Ice in Bristol Bay remained confined except for a few days to areas from Ugashik Bay north and eastward.
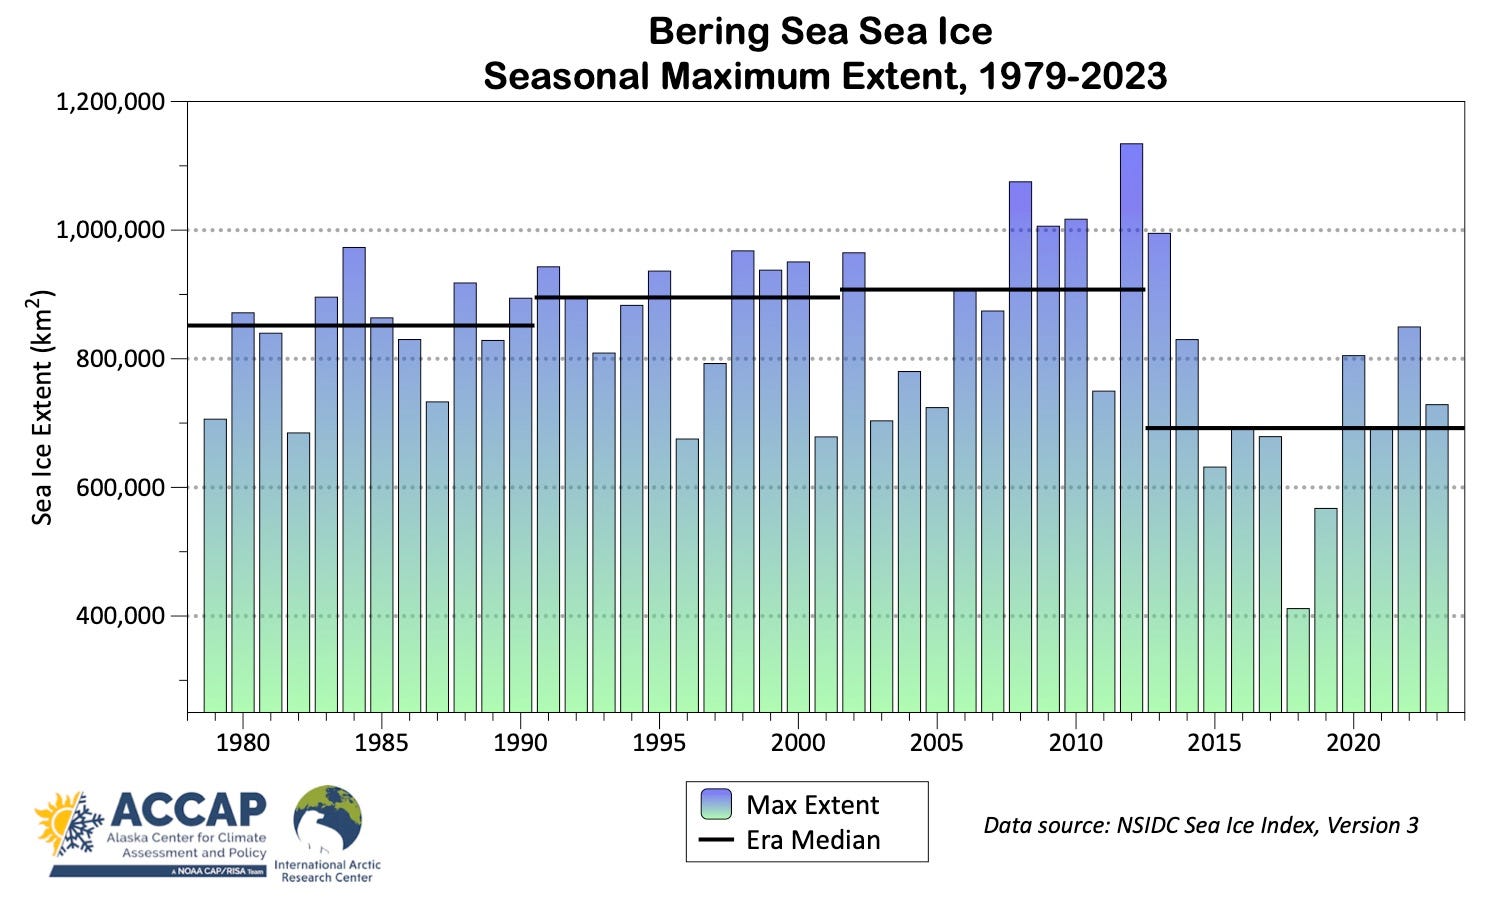
The maximum Bering Sea sea ice extent in National Snow and Ice Data Center analysis was about 729,000 km². This is 15 percent below the 1991-2020 median maximum extent. However, it is in keeping with recent years. Figure 4 shows the maximum Bering Sea ice extent each spring. We now have 45 years of the passive microwave data, so I’ve simply divided up that time series into four segments and plotted the median value for that segment. It’s clear there is no appreciable differences in the median for first three segments. However, the most recent 11-year median, 2013-2023, is more than 20 percent lower than the three preceding intervals.