Spring 2023 Snowpack
Plenty of Snow in Most of Alaska
Now that it’s daylight longer each day than it’s dark at night, anticipation turn to spring, which for Alaska means snowmelt, mud, potholes and of course river ice break-up. For many purposes when we talk about “snowpack” through the climate lens we are talking about how much water is stored the snowpack itself, in jargon terms the “snow water equivalent”. So take a sample of snow, melt it, and measure the water: that’s snow water equivalent (SWE). Usually that’s expressed in term of linear depth (per unit area), i.e. inches or centimeters, the same units as precipitation. In applications where the weight of the snow important, SWE is often expressed as a weight per unit area, e.g. pounds per square foot.
The USDA’s Natural Resources Conservation Service is the federal agency that does nearly all of the snowpack measurement work in Alaska through at network of automated stations (known as SNOTel, from “Snow Telemetry”), snow courses, which are predetermined transects where people, typically around the first of the month February to May take snow depth and SWE measurements, and historically at least, aerial makers, used for estimating snow depth from observers on low flying aircraft.
Some other organizations/agencies also make snowpack measurements, e.g. US Fish and Wildlife Service, hydropower operators, etc. but those observations are rarely made publicly available in near-real time (if ever). The National Weather Service previously made daily snowpack measurements at most of its offices but that work almost entirely ended by 2019.
Because the snow depth or amount of water in the snowpack varies greatly with even moderate differences in elevation or terrain aspect, when dealing with the distribution of snowpack on the landscape we nearly always express that relative to some long term baseline, e.g. current widely used baseline is the 1991-2020 median.
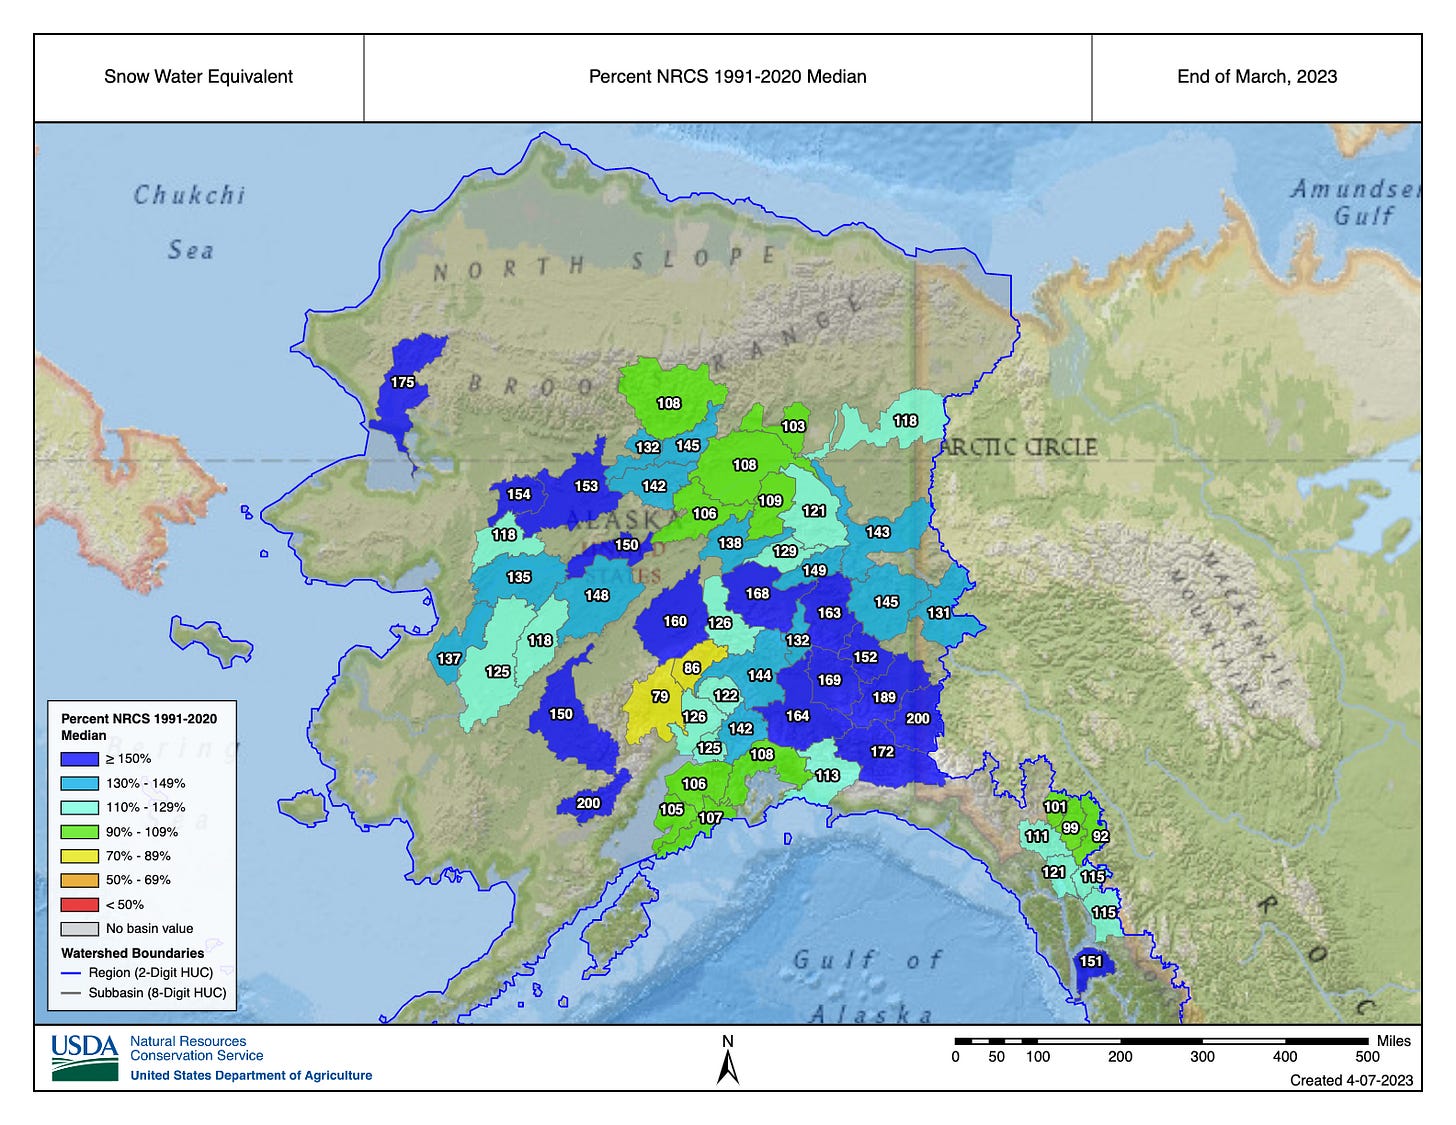
With that background, on to where things were at as of the end of March. Figure 1 shows the river drainage sub-basin (HUC-8) estimates of the percent of 1991-2020 median snowpack based on the NRCS observations. Note that off of the road system the estimates are often from only one or two observation sites. Based on this limited network we see that in most of these comparatively small areas the SWE is near to above median, and in some areas more than 150 percent of median. Only a couple of sub-basins of the south side of the Alaska Range show up with significant lower than median SWE.

The newest tool in the “snowpack toolbox” is from our workhorse climate analysis model, ERA5. This is independent of the in-situ measurements. This has been available for several years, but it’s only this season that the higher resolution ERA5-Land (10km horizontal grid) has become available in near real-time. Like the NRCS graphic, Fig. 2 shows the 1991-2020 percent of median SWE. The modeled values are in pretty good agreement with the actual observations, though of course this don’t have some of the detail that is available in the few areas where there are comparatively, a lot of observations, e.g. the greater Anchorage area. This product is very useful in filling out regions were there are no actual observations. For instance, this shows the well below median snowpack in the lower Yukon-Kuskokwim delta and western North Slope, region, or the unusually high snowpack in the upper Bristol Bay region, where in some years at the end of March there is little to no low elevation remaining. This “complete” picture is especially useful as input to pre-season wildfire planning as well as hydrological interests.

Relative to 2022, snowpack is not quite as high in the Interior and especially in the headwaters region of the Yukon River from Whitehorse, YT southward. However, snowpack is near or even a bit higher than last year in the upper Kuskokwim region. In Southeast Alaska low elevation snow melt is well underway but in general higher elevation snowpack is near to above median.
For river break-up this year, overall this means that many rivers will have more than usual amount of water moving into them once temperatures warm-up. Whether that translates to significant flooding will depend of how rapidly temperatures warm the second half of April and first week of May and of course exactly where ice jams form. The current NWS Alaska-Pacific River Forecast Center’s Break-up Outlook is available here. And we’ll be doing our annual Alaska Center for Climate Assessment and Policy (ACCAP) webinar on Spring Break-up on April 18 at 10am AKDT. More information and free registration for the webinar here.


Thanks for maps and explanation. It seems that both Alaska and California have above average snowpack. I was wondering if Alaska got less snow because so much went to California.