


February 2023 Climate Summary, Part 1
Temperatures, Sea Ice and Sea Surface Temperatures

We start the monthly review with temperatures, sea ice and sea surface temperatures. Precipitation and snowfall/snowpack are most helpfully discussed once the ERA5 reanalysis for February becomes available on March 6 or 7.
The January 2023 temperature and sea ice summary is here and the precipitation, snow and SST summary is here.
Temperature
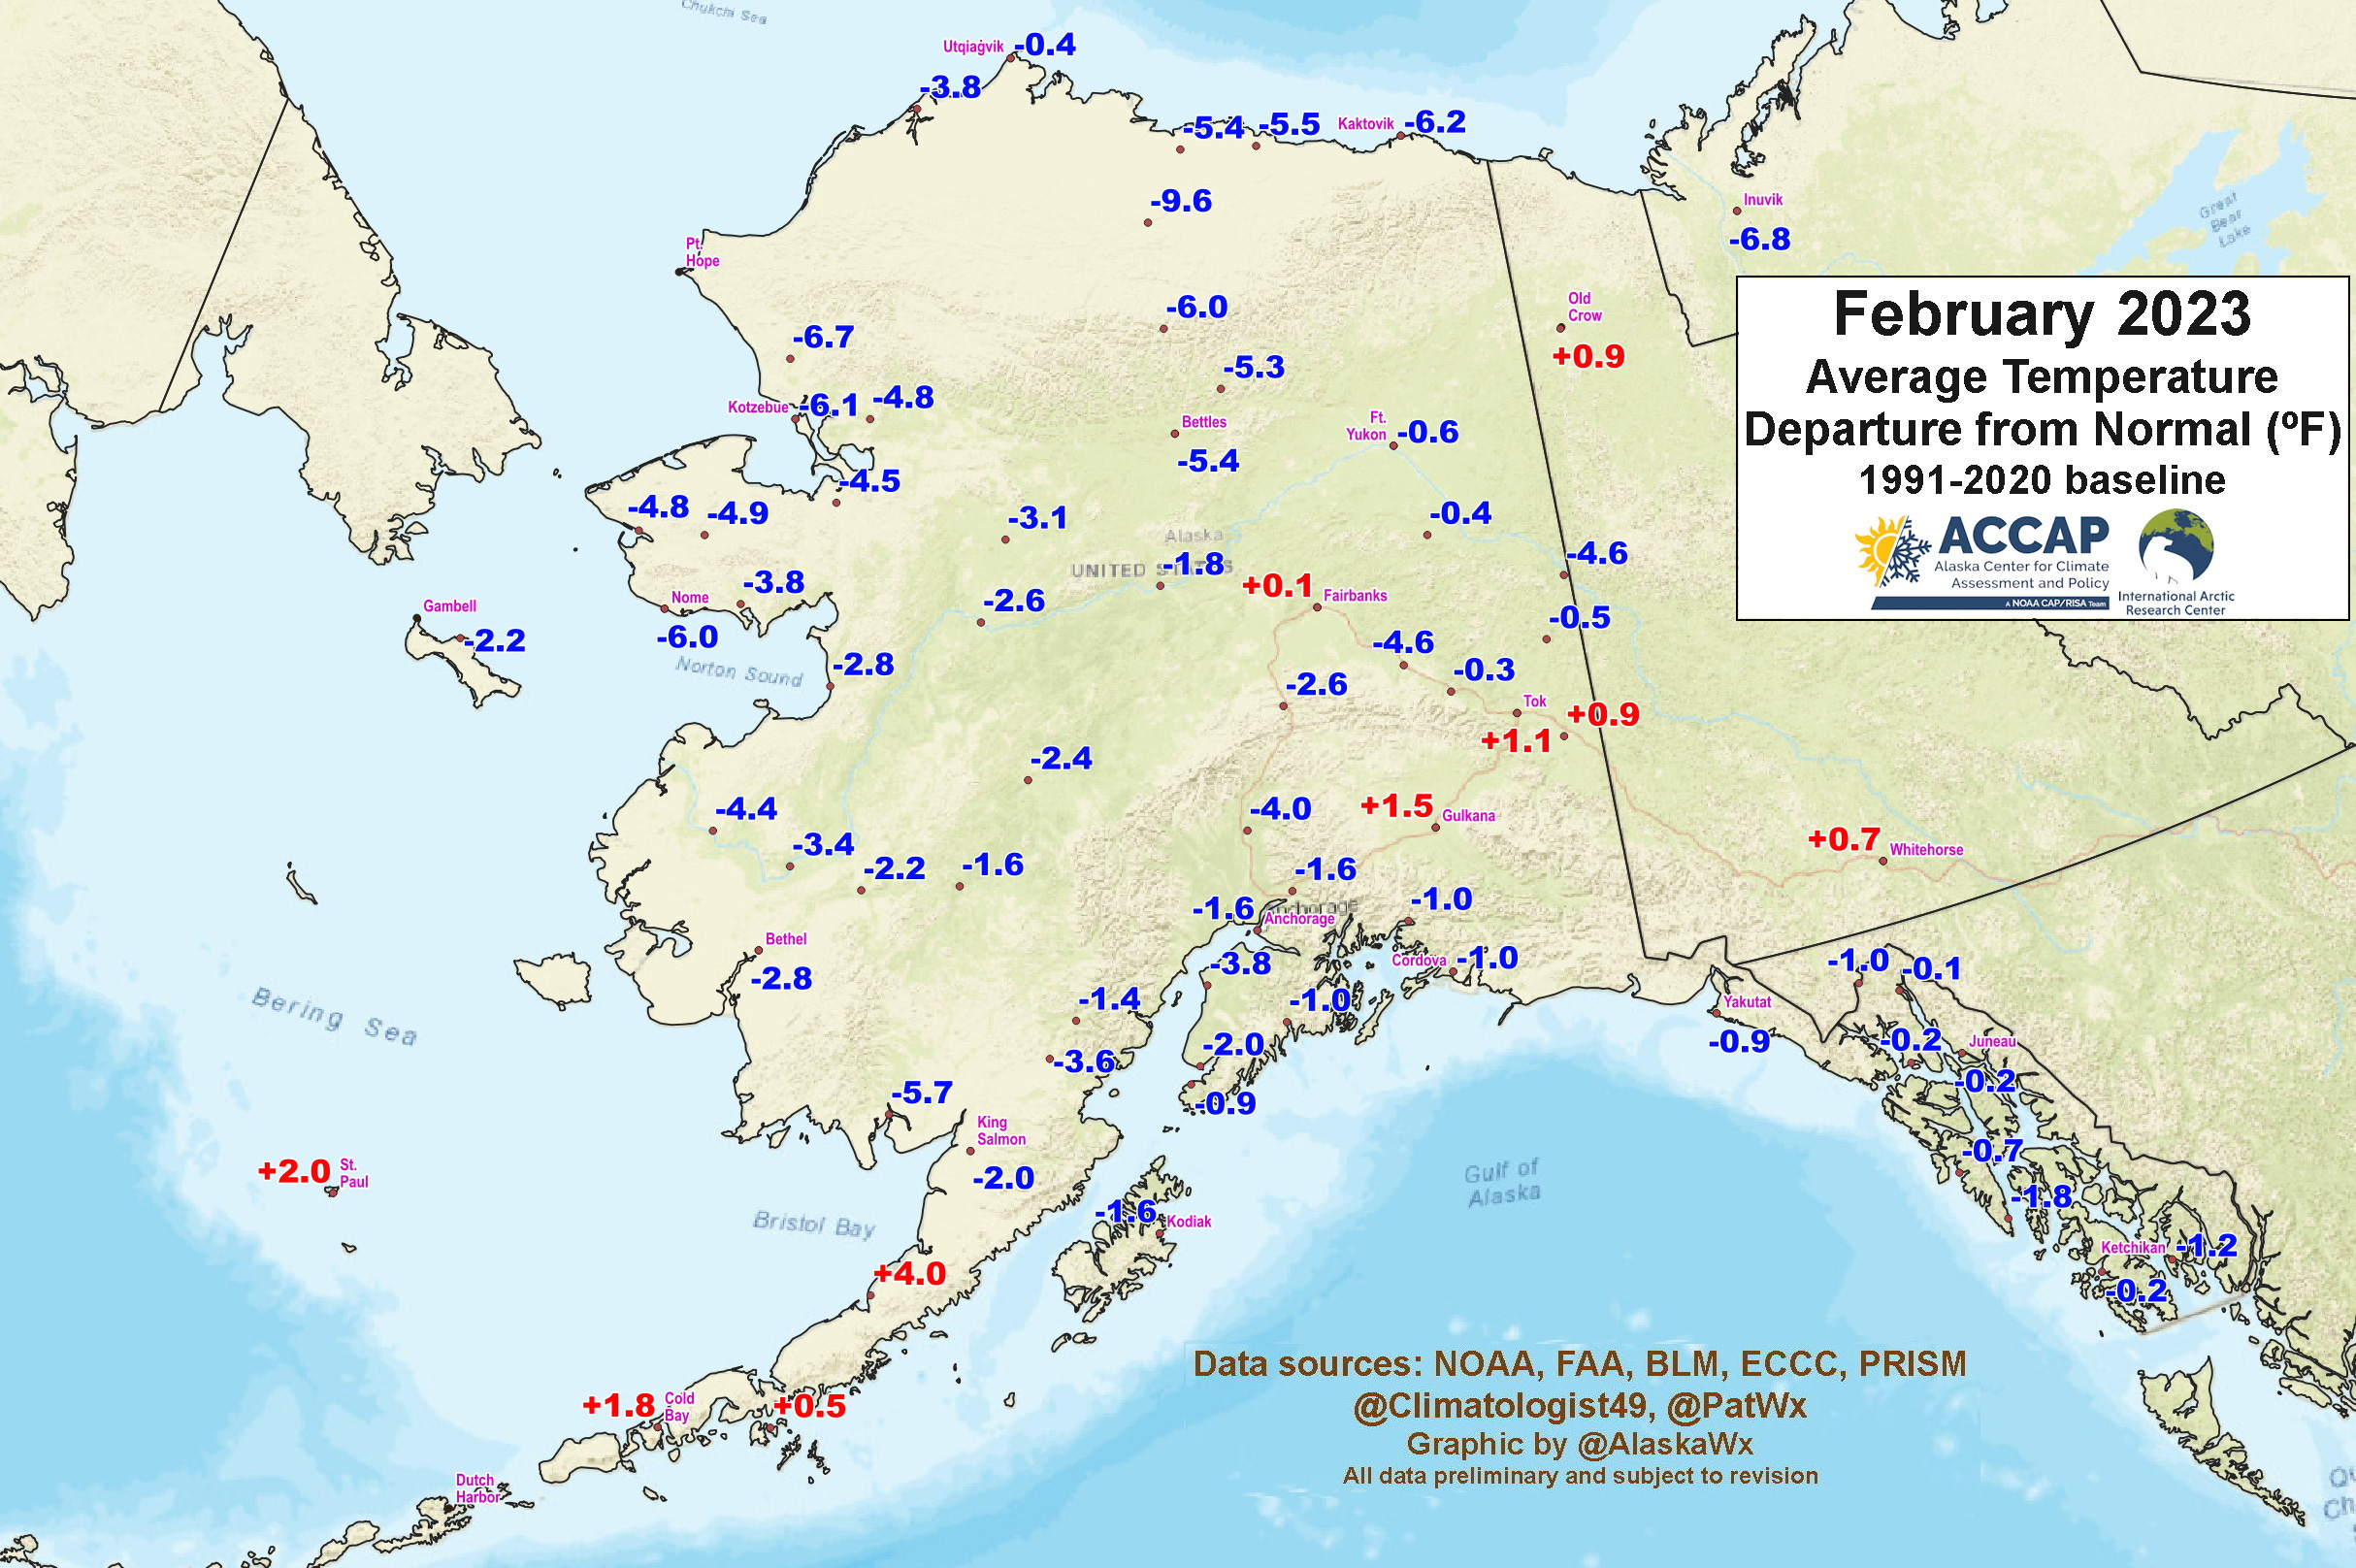
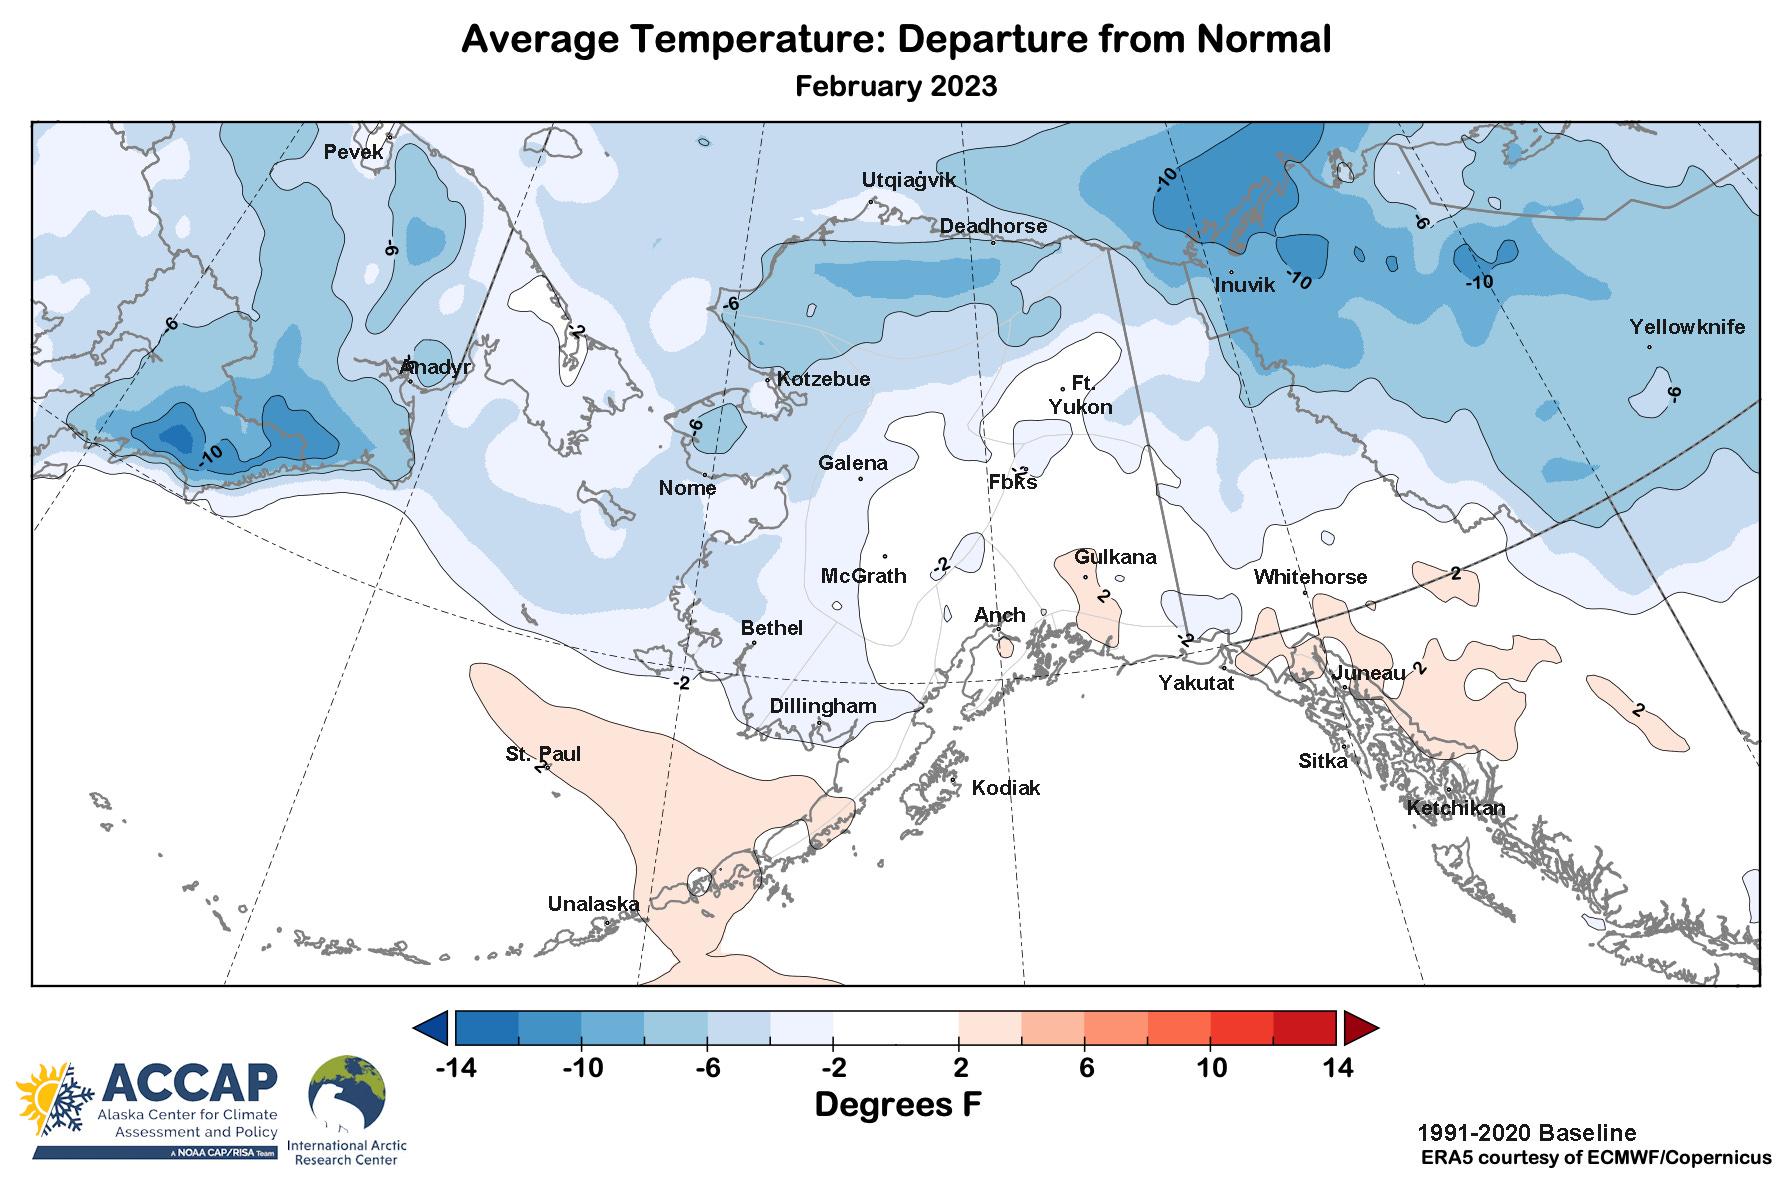
In a marked changed from January, February was cooler than normal across most of Alaska, though in most places not dramatically so. Figure 1 shows the point specific departures from the 1991-2020 normals. The coolest temperatures (relative to normal) were on the North Slope and across western and northwest portions of the state. The Alaska Peninsula and southern Bering Sea regions were warmer than normal, as was the Copper River Basin and upper Tanana Valley. [Added March 5: Figure 1a. shows the ERA5 departures, also relative to the 1991-2020 baseline.]
The Alaska daily statewide temperature index provides a convenient way to examine short term larger scale weather pattern variability, though of course this may “smooth out” regional differences. Figure 2 shows the daily values for February. A relatively mild pattern prevailed during the first and third weeks of the month and colder pattern in the second and fourth weeks. Statewide, the highest reliable temperature was 54F at Unalaska on the 22nd and 27th, while the lowest was -54F at Umiat on 3rd and 5th. Interestingly, over mainland Alaska south of the Brooks Range and in Southeast, many places saw the lowest temperatures of the month on the last two days of the month.
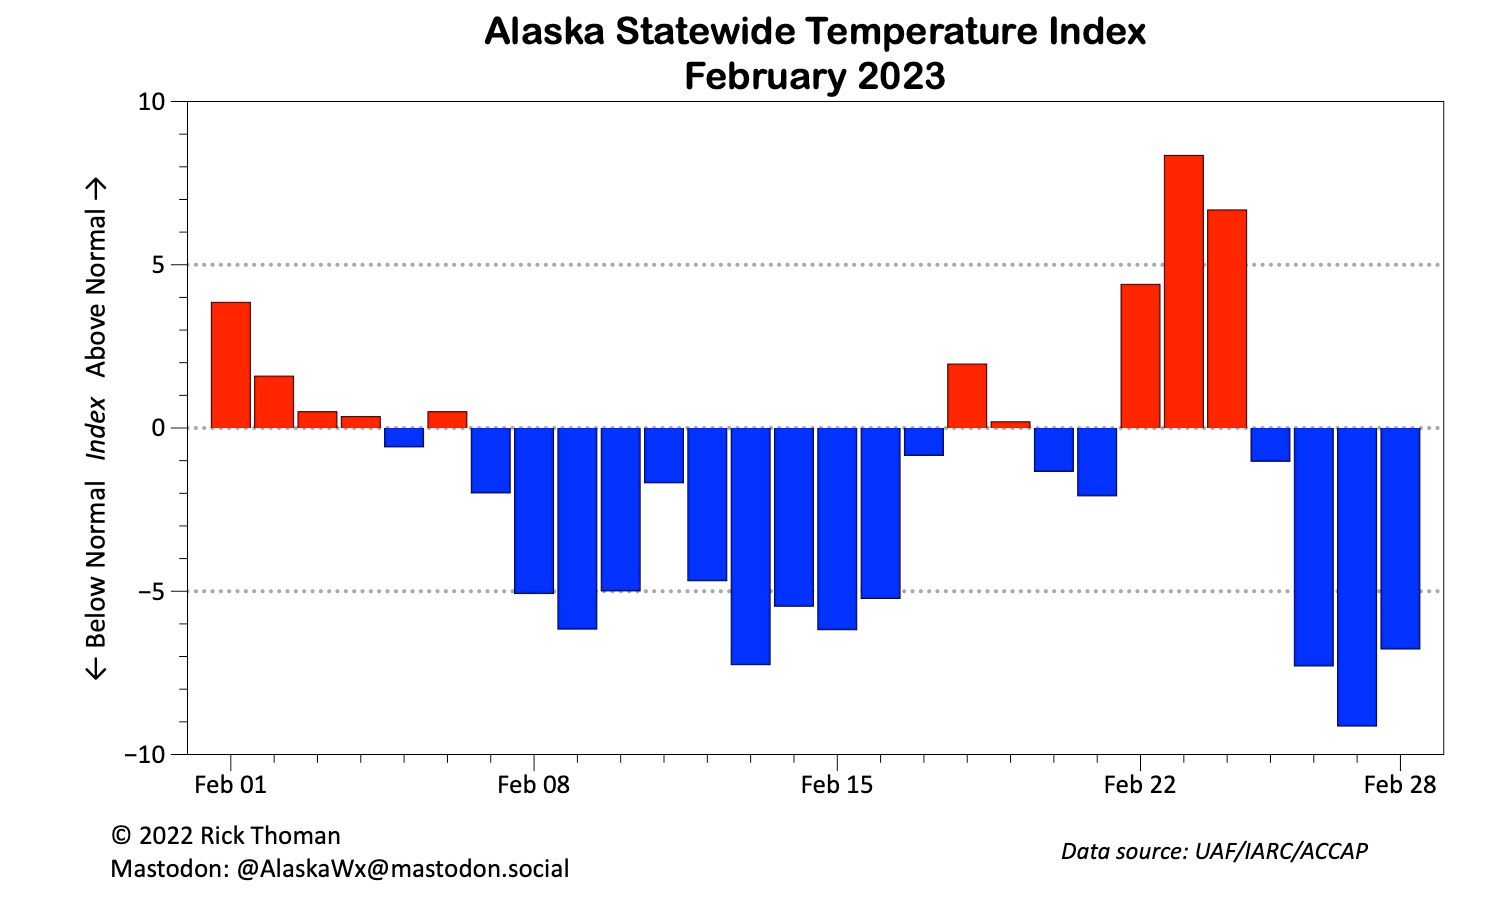
Brian Brettschneider and I developed the Alaska statewide temperature index as a way help answer the common question: “has it been hot/cold in Alaska?”. That’s a simple question, but because of Alaska’s size, widely different climates and seasonal variability it’s much more difficult to answer than it might seem. The index is a relative ranking on a unitless scale of -10 to +10 (not degrees). Values above +5 or below -5 indicate unusual conditions and values above +9 or below -9 indicate major departures from normal at the statewide level. Much more information about the index and the real-time values, updated daily, is here.
Sea Ice
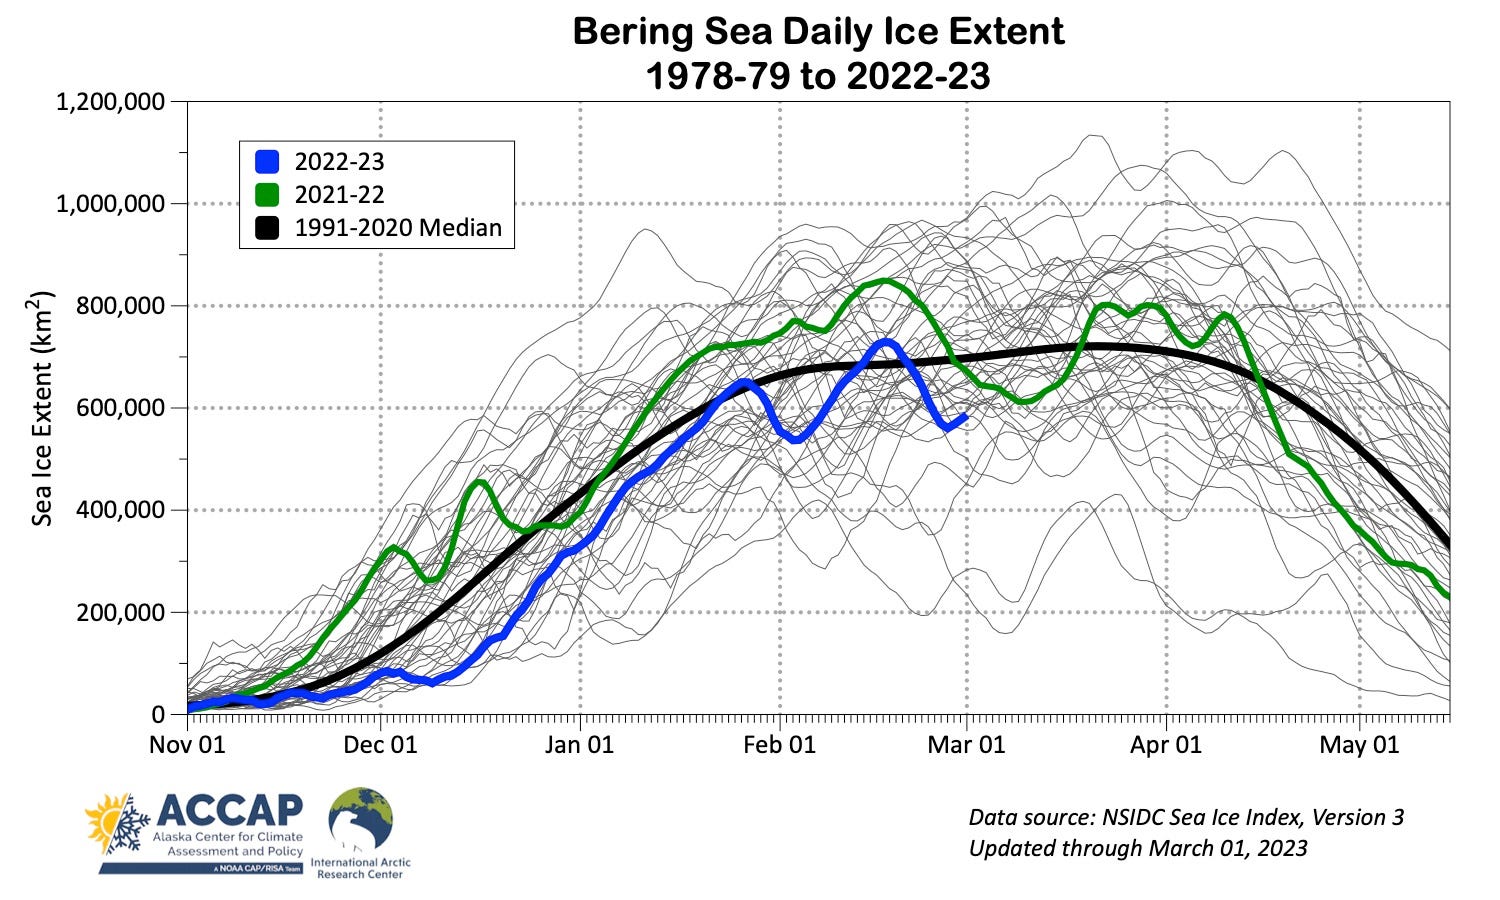
Sea ice concentration and extent in the Bering Sea during February were fairly typical for recent years. For the entire Bering, average ice extent was lower than February 2022 and lower than the 1991-2020 average. Nonetheless this was still the third highest February average in the past decade. As in January, sea ice in Bristol Bay was confined to the upper Bay, generally north of Pilot Point. The edge of the pack ice advanced to within about 50 miles of St. Paul Island around Valentines Day before retreating northward with a change in the weather pattern that brought prevailing south winds. Figure 3 shows the median daily sea ice concentration (0=no ice, 100=all ice) from the Advanced Microwave Scanning Radiometer - 2 (AMSR2) onboard the Japan Aerospace Exploration Agency (JAXA) GCOM-W1 satellite. The areas of lower concentration ice on the south side of St. Lawrence Island and the Chukotka Peninsula are typical for late wind and are sustained by the prevailing northeast winds.

The seasonal daily sea ice extent is shown in Fig. 4. February extent was generally below the 1991-2020 median, though not by a lot. Following the dip in extent the last ten days of the month it’s possible the maximum sea ice extent for the season was reached on February 17th, but that will depend on the winds in March: a long period of sustained north winds could still push ice south and exceed the maximum February extent.
Sea Surface Temperatures
February average sea surface temperatures in the Bering Sea south of the sea ice edge were significantly warmer than normal, with the largest departures from the Pribilof Islands southeast to lower Bristol Bay. This warmth extended into the North Pacific south of Aleutian Islands eastward to south of Kodiak Island. In contrast, Gulf of Alaska sea surface temperatures were quite close to normal.

Technical details: Monthly temperature departures from normal use the published NOAA/NCEI 1991-2020 values whenever available. For most of the FAA stations there are no published normals so derived 1991-2020 normals were constructed from the 1981-2010 PRISM data (Oregon State University) by B. Brettschneider. Canadian departures courtesy P. Duplessis.
The Alaska Statewide Daily Temperature index is one of the ACCAP tools, the landing page is https://uaf-accap.org/accap-projects/tools/
Daily AMSR2 high resolution passive microwave sea ice concentration available from U. Bremen. Landing page at https://seaice.uni-bremen.de/sea-ice-concentration/amsre-amsr2/
Daily sea ice area and extent for the Arctic and regional seas available from the National Snow and Ice DataCenter at https://nsidc.org/arcticseaicenews/sea-ice-tools/
Daily sea surface temperature from the NOAA OISSTv2 database accessed through NOAA NOAA/Physical Sciences Laboratory at https://psl.noaa.gov/data/gridded/data.noaa.oisst.v2.highres.html
Occasional reminder: I post Alaska and Arctic climate information nearly everyday on Mastodon. Follow me at @AlaskaWx@mastodon.social
Very nice summary.