


2024 Arctic Climate Review
Third warmest, third wettest

2024 was a warm and wet year for the Arctic overall, with both average temperature and total precipitation ranking as third highest since 1950 based on the ERA5 reanalysis. As always, there were important differences in both space and time. If you are interested in my 2024 Arctic seasonal summaries, you can find them at these links:
Temperature
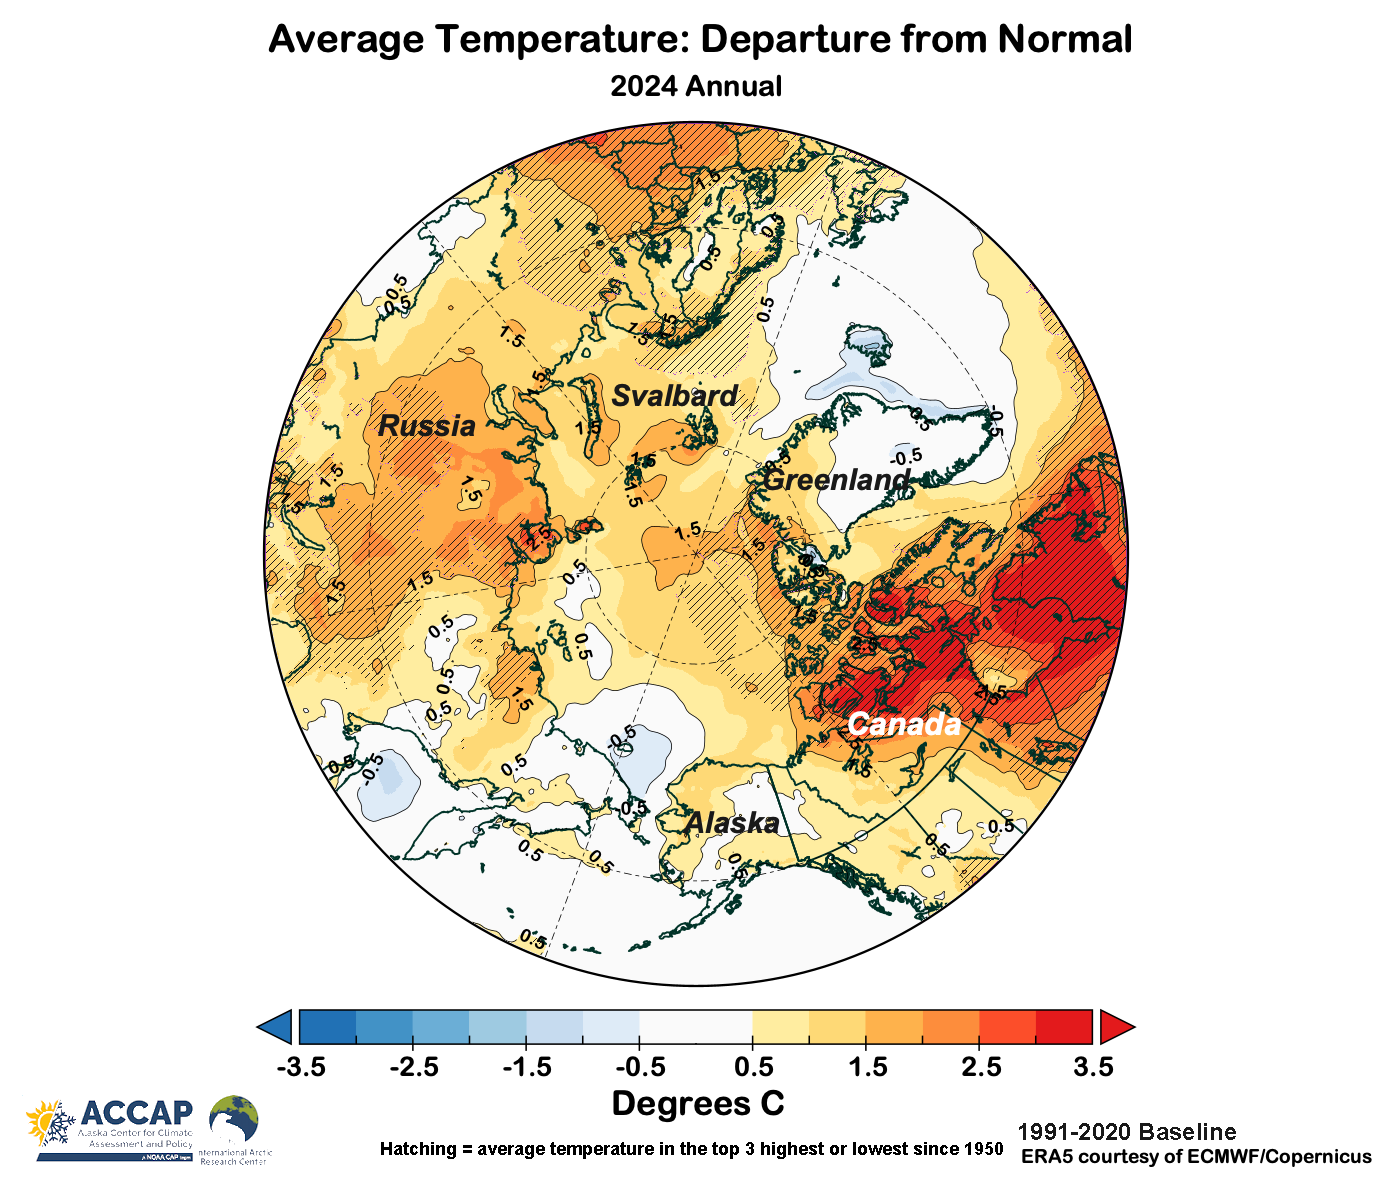
To exactly no one’s surprise, 2024 was another warm year in the Arctic. From Fig. 1, more than 90 percent of the Arctic (lands and seas north of 60°N) was warmer than the 1991-2020 baseline average, and if you prefer an older baseline, 99.87 percent of the Arctic had an annual average temperature above the 1951-1980 baseline. Nunavut, Canada had the second warmest calendar year while Iceland was the only significant land area cooler than average.
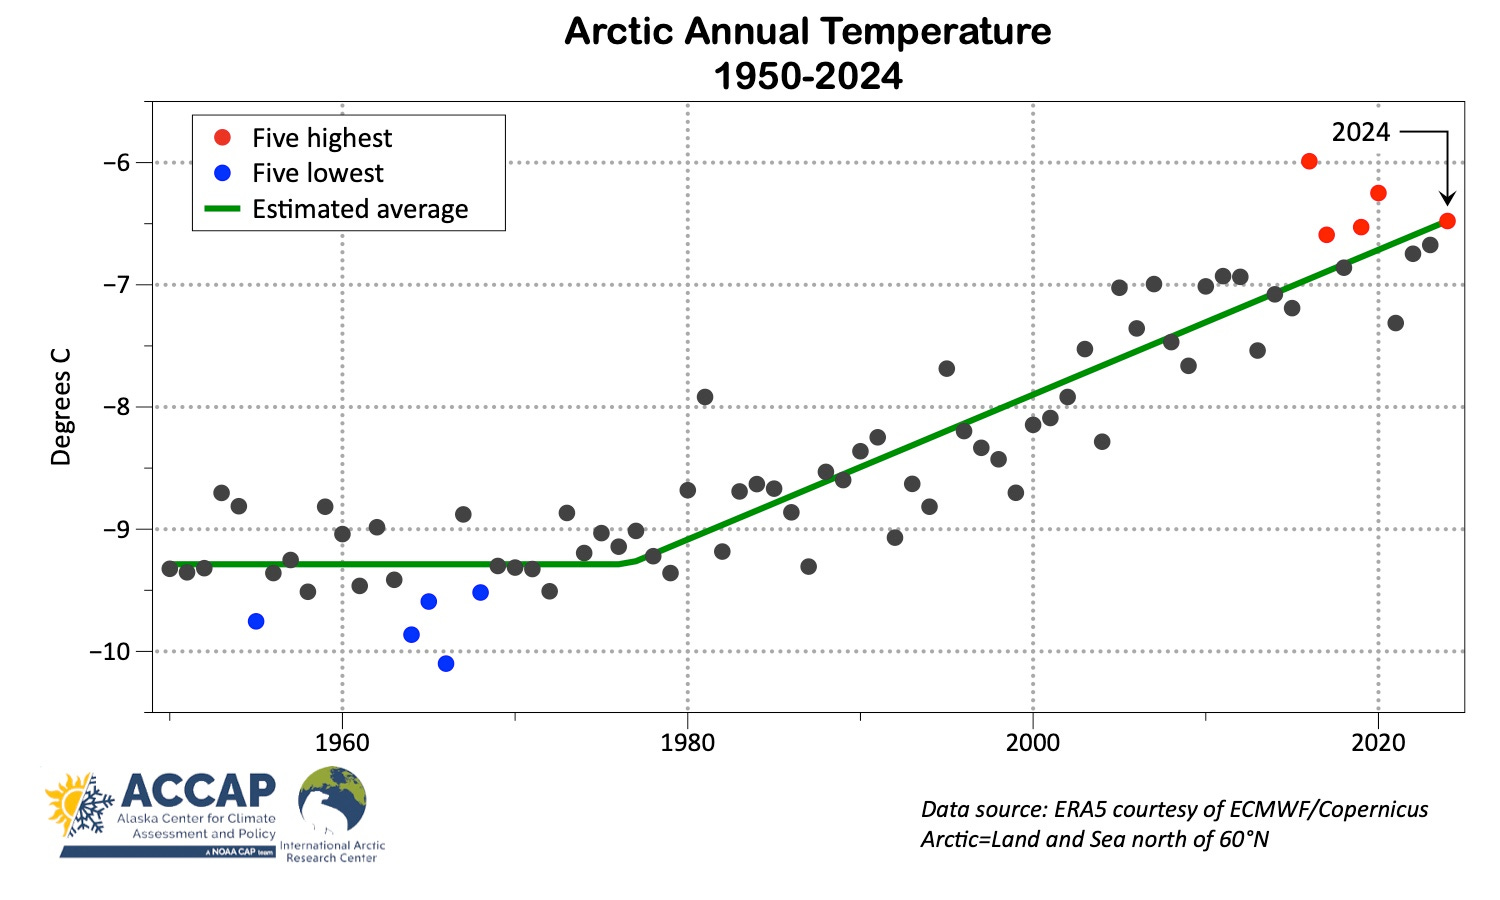
The Arctic-wide annual average time series since 1950 is shown in Fig. 2. 2024 edged out 2019 for the third highest annual temperature. The increase in average temperature since the late 1970s is as stark as it is stunning: an increase of almost 3°C in less than 50 years. For a mid-latitude context, 3°C is about the total range of the annual average temperature at Seattle in the past 50 years.
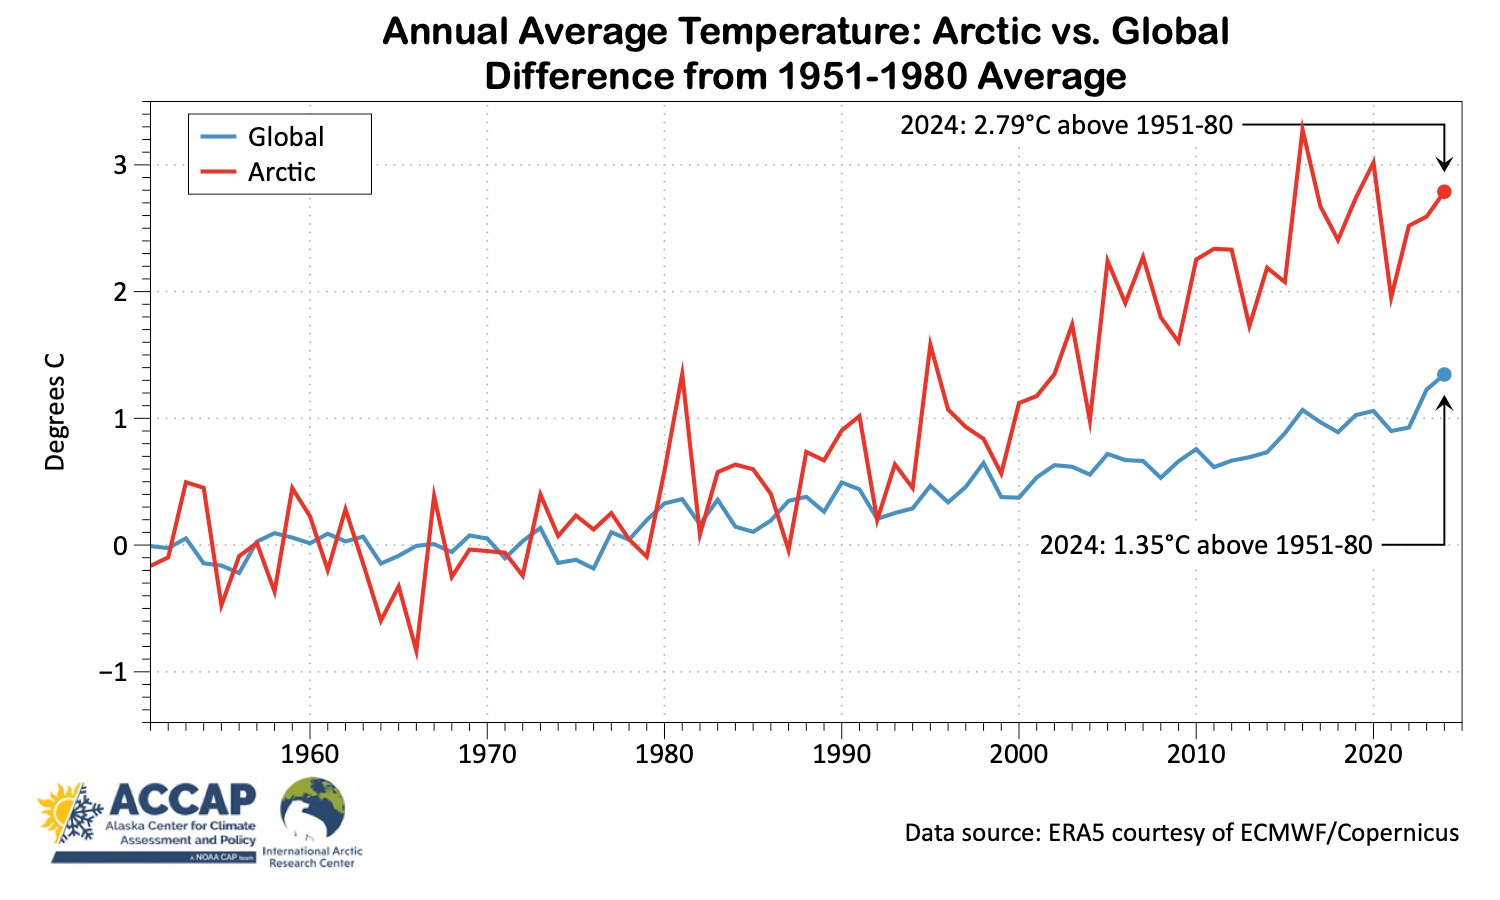
The Arctic continues to warm faster than the Earth as a whole. Figure 3 plots the difference in annual temperature from the 1951-1980 average for the globe and just for the Arctic. As you can see, the Arctic temperature departures started to diverge from the global departures around 1990. This is of course one measure of “Arctic Amplification”, where the Arctic is warming faster than the lower and mid-latitudes. Important factors contributing to Arctic Amplification are decreasing sea ice (extent and thickness), shorter snow cover seasons on land and increased water vapor in the Arctic atmosphere.
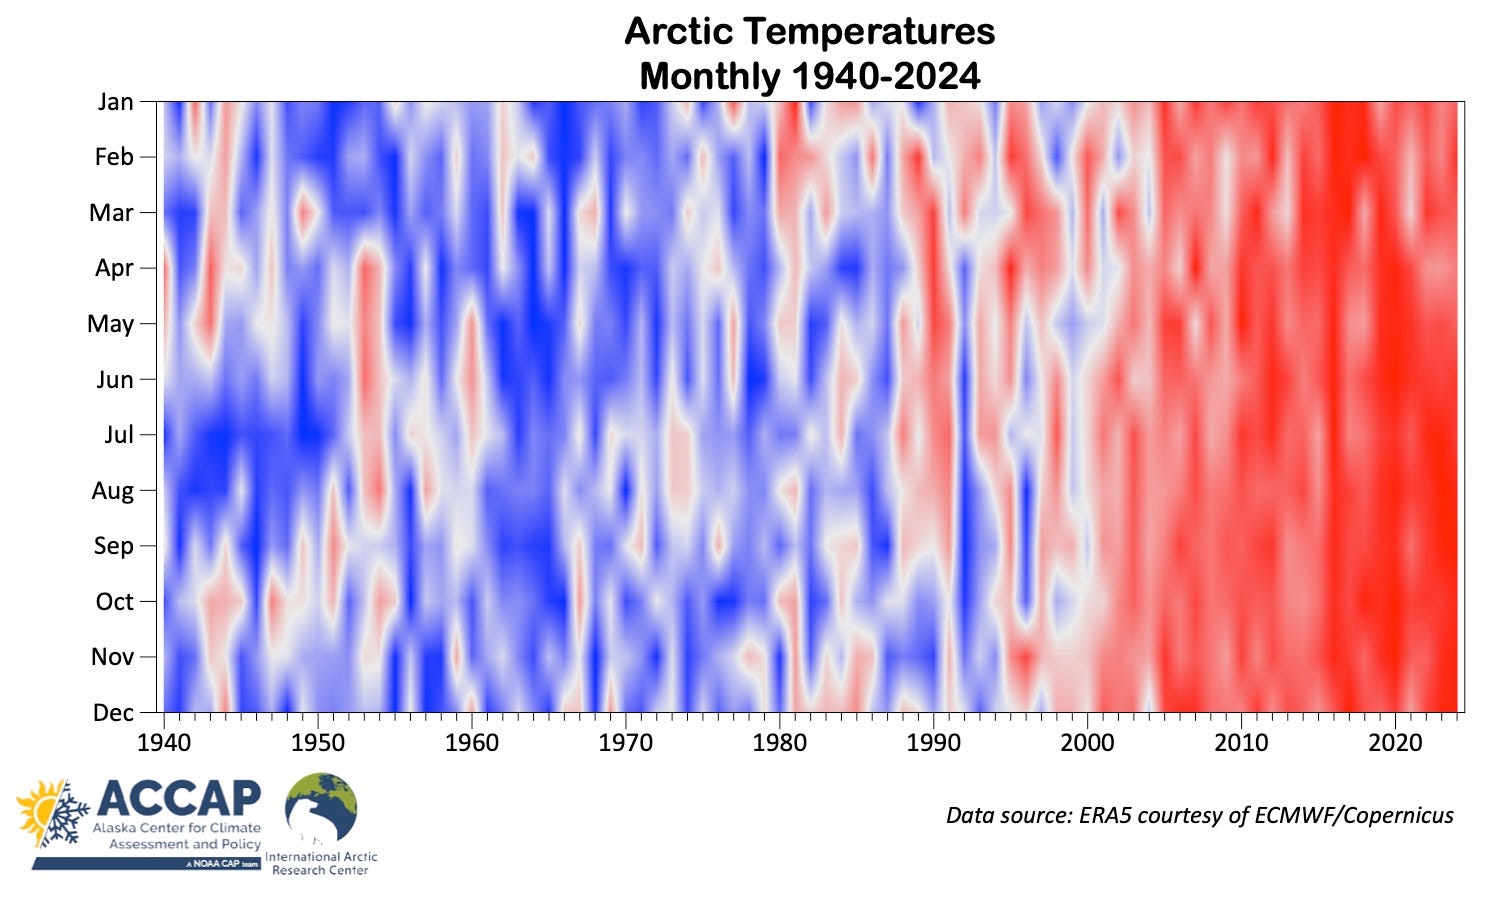
Lastly, mostly because I’ve come to like this presentation, Fig. 4 shows a “climate stripes” style view of monthly Arctic average temperatures 1940 to 2024. Unlike the annual average, which by construction smoothes out the monthly temperatures, the subseasonal variability is preserved in this graphic, e.g. the “red stripes” in the sea of blue in the 1950s and early 1960s, which mark warm seasons in an otherwise colder era, are in quite interesting, as are the much more uniform red shades since the early 2000s.
Precipitation
Annual precipitation was higher than the 1991-2020 average over 66 percent of the Arctic, as shown in Fig. 5. Precipitation was especially high (relative to average) from the Canadian High Arctic eastward across northern Greenland and much of the Greenland and Norwegian Seas region. Significantly below normal annual totals occurred in parts of the Northwest Territories, Canada and eastern Siberia. Overall, 2024 ranked as the third highest average precipitation since 1950 (only 2017 and 2020 higher) for the Arctic precipitation. Since 1950, Arctic annual precipitation has increased about 11 percent.

Snow
Unlike precipitation, snowfall over land, at least from the ERA5 perspective, was not exceptional. Figure 6 shows percent of snow relative to the 1991-2020 baseline. Normally I use different color palettes for different features, but here I use the same as in Fig. 5 for ease of comparison between precipitation (rain plus the liquid in melted snow) and snow (liquid in melted snow). Portions of Arctic Canada had significantly below normal snow, as did parts of north-central Siberia. In contrast, much of western Siberia and the Russian European Arctic saw above normal snow in 2024, as did parts of Alaska, northern Nunavut, Canada and Greenland.

You're right- no surprises this year, the trend lines are pretty consistent after smoothing. Warmer and wetter for a while longer..