Globally, this was the warmest June through August on record. The Arctic was also warm but not quite as extreme. This post focuses on the larger Arctic climate perspective. I’ll have a summer 2024 Alaska climate summary in a separate post.
Temperatures
The Arctic was (surprise!) warmer than the multi-decade average, though not quite as warm as 2022 and 2023. Overall, the June through August average temperature for the Arctic (land and sea poleward of 60°N) was 0.6°C above the 1991-2020 average (1.4°C above the 1951-1980 baseline). About 73 percent of the Arctic (78 percent of Arctic land) had a warmer than normal (1991-2020 baseline) summer, with this being the warmest summer in the past 75 years over the northern Nordic Arctic and parts of northern Siberia. In contrast, the Russian far northeast had the coldest summer in decades, with the Chukotka Okrug (the northeastern-most of the Russian “states”) having the lowest June-August average temperature since 1998. This is related in part to the unusual (by 21st century standards) persistent sea ice in the western Chukchi Sea. On the Atlantic side of the Arctic, Iceland had the coolest summer since 2015.

A prominent feature of Fig. 1 is that over most high Arctic ocean areas the summer 2024 temperatures were within 0.5° C of average. This is not an artifact of the reanalysis: temperatures over the ice pack in the high Arctic rarely deviate far from average in summer because the heat goes into melting ice and snow instead of raising the air temperature. It takes energy to change the phase of water from solid to liquid even though there is no change in temperature and this is known as the latent heat of fusion.
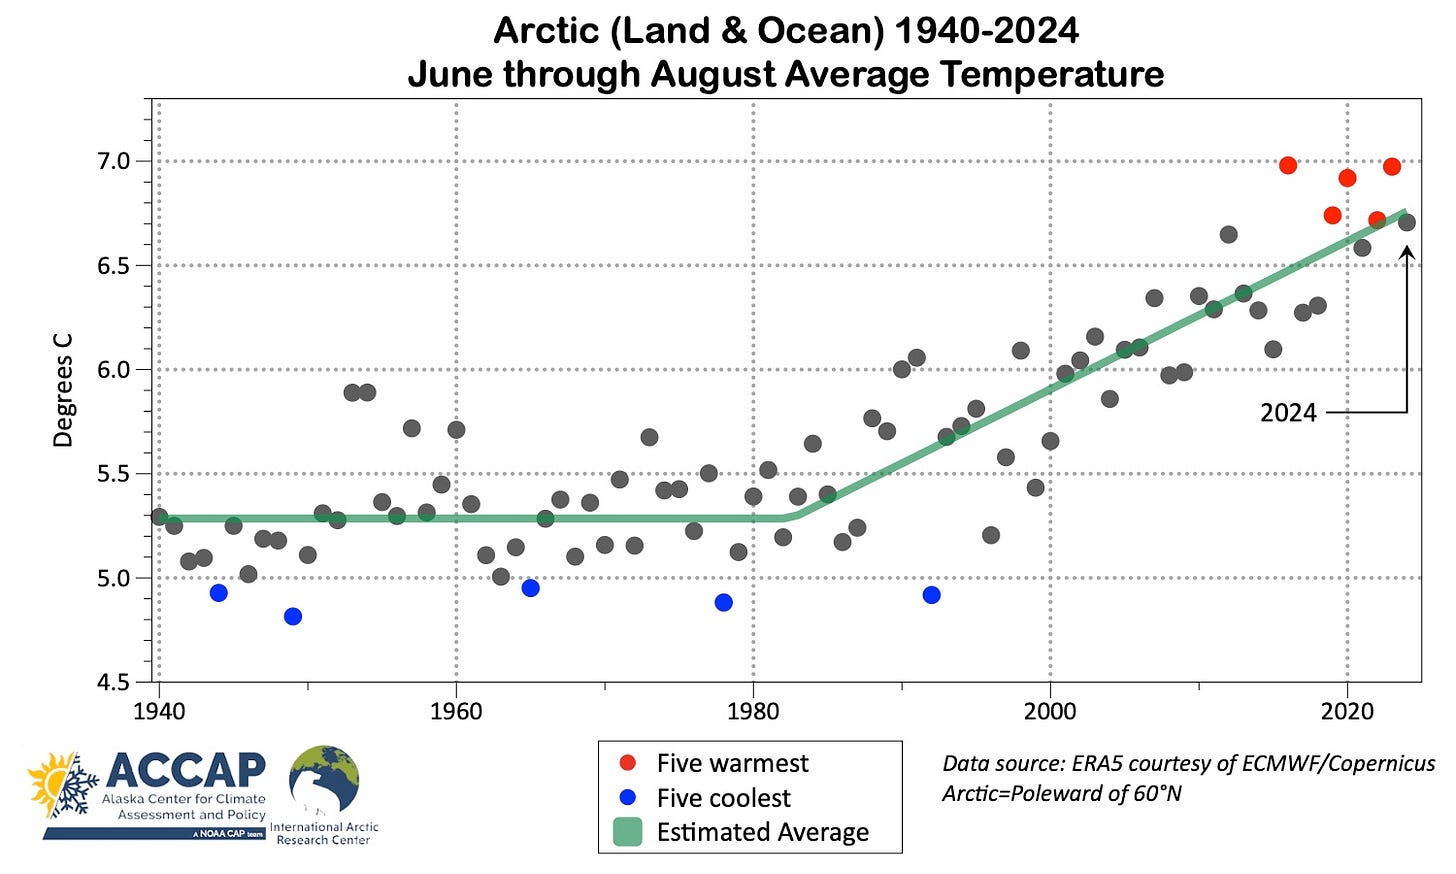
Summer 2024 average in context is shown in the time series in Fig. 2. The six warmest summers (since 1940) have all occurred since 2016 and this summer’s average temperature was almost exactly at the linear trend estimate of the time varying mean temperature.

Precipitation
The percent of normal precipitation for the summer is shown in Fig 3. The well above normal precipitation over eastern Greenland and western Alaska but below normal over portions of the Canadian Arctic is broadly similar to summer 2023 precipitation pattern. The below normal area across northeast Siberia corresponds with the main wildfire area in June and July. Overall, Arctic summer precipitation was 104 percent of 1991-2020 normal, and since 1960, summer average precipitation in the Arctic has increased a statistically significant 5 percent.

Sea surface temperature
Summer sea surface temperatures in the Arctic are strongly modulated by the presence or absence of sea ice, and so the timing of sea ice melt significantly impacts summer sea surface temperatures in the waters where ice persists through at least part of the summer. The Barents Sea, Gulf of Bothnia and near-coastal area of the Laptev and southeast Beaufort Seas were especially warm relative to the 1991-2020 baseline average.

In contrast, most of the Chukchi and the eastern Bering Seas had much below average sea surface temperature this summer. In the Chukchi Sea this is related to the comparatively high sea ice extent this summer. For the eastern Bering Sea, my working hypothesis is that the unusually low SSTs are the result of excessive storminess in July and August that kept the near surface ocean water well mixed and much below normal solar heating due to more cloud cover than usual.
Greenland Ice Sheet
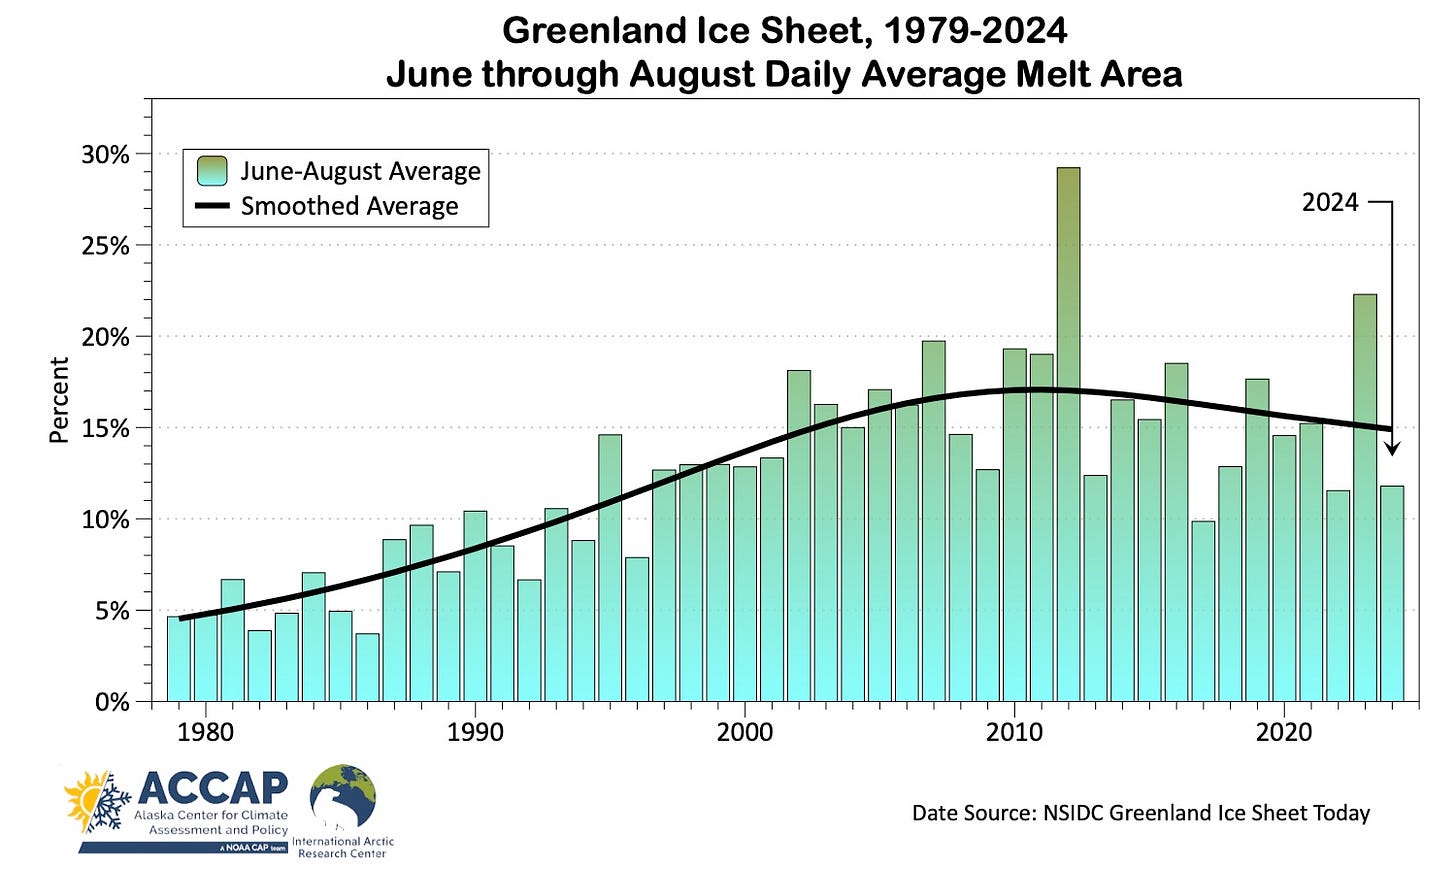
Following last year’s second highest average daily melt area, this summer’s average melt was notably lower, though very close to the 2022 average and a bit higher than 2017.

The daily melt area was close to average on almost every day during the summer: there wasn’t even a one or two day heatwave to produce melt over most of the ice sheet. The highest daily percentage of melt area was July 18 at 31 percent. This is the lowest seasonal maximum daily melt area since 2001.


Your analysis of the arctic climate is fantastic and I like reading your climate summaries. One thing I've always wondered- are there any other global C02 measurements. I know it is measured at a single station at altitude in Hawaii. It would make sense to me if there were lots more of these which could be tracked over time. 😊
Excellent. Looking forward to the wrap up. The boreal fire situation ties right in, I imagine. Here's to the high Arctic and the people who love her.