This post provides a quick review of the May climate in Alaska based mostly on site-specific station observations. I’ll have a Spring 2024 Arctic-wide summary once the ERA5 reanalysis for May becomes available.
Temperatures
May was cooler than normal over most of Alaska, but especially in southwest Alaska, where St. Paul, Bethel, King Salmon and Kodiak all saw the coolest May in more than a decade. A large chunk of the Interior was very close to normal. Figure 1 shows the site-specific departures. Much of Southeast Alaska snapped a long run of monthly average temperatures near to above normal. At Haines and Juneau, this was the first month to be significantly cooler than normal in the 3-category (tercile) sense since March 2023 and at Ketchikan it was the first month since April 2023.
The lack of really warm weather anywhere in the state was notable. The highest reported reliable temperatures appear to be 75F (23.9C) at Aurora (Fairbanks area) on the 21st and Whitestone Farms (near Delta Junction) on the 31st. This is the first time since 2017 that no official climate site reached at least 80F (26.7C) in May, and if the statewide high of 75F holds it would be the lowest May high temperature for Alaska since 2000, when Beaver Falls (near Ketchikan) had the state high temperatures of 72F (22.2C). The lowest reported temperature in Alaska in May 2024 was -9F (-22.8C) at Nuiqsut on the 1st.
Precipitation and snowfall
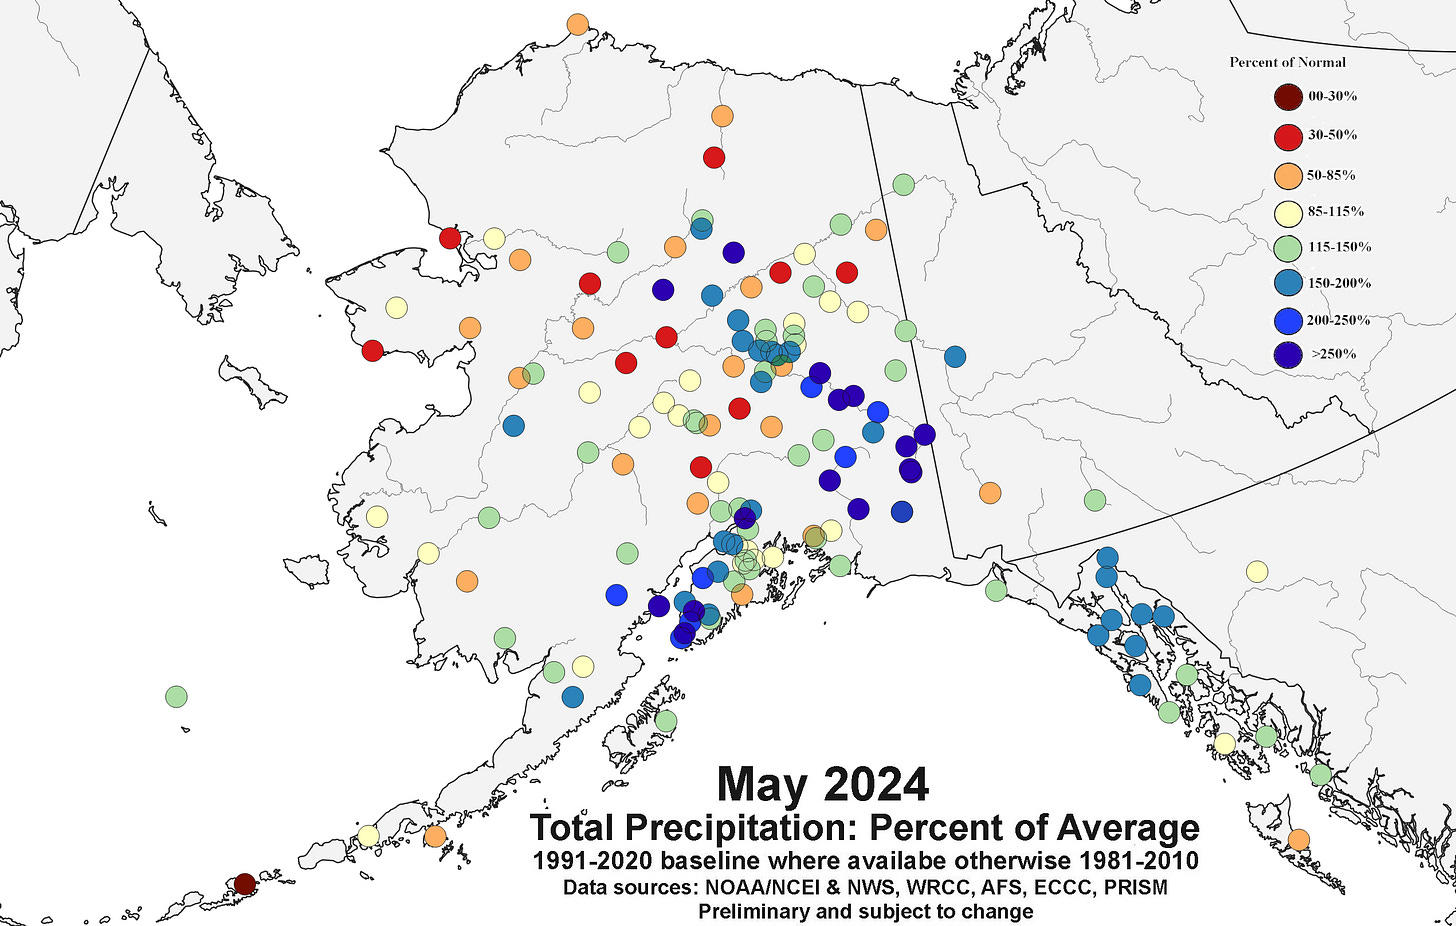
With the coming of the warm season we’re able to utilize many of the automated gauges that don’t report precipitation during the winter but are reasonably reliable with rainfall totals.1 Figure 2 plots the May precipitation as a percent of the normal. The variability over short distances may reflect reality, issues with the measurements or reporting and the like. However, it’s reasonably clear that at this scale, Southeast Alaska as well as the portions of the central and eastern Interior and Kodiak to the lower Mat-Su valley had significantly higher than average precipitation, while northern and western Alaska, based on limited observations, was generally drier than average.

The largest departures were in the Copper River Basin and the upper Tanana valley of the southeast Interior. For the third time in the past four years, Glennallen area had near record high precipitation in May. At Tok, 2.91 inches (73.9mm) precipitation total (which all fell as rain) is more than three times normal and is evidently the highest May total there since the observations began in the 1950s.
Snowfall in May2 was not heavy, though the timing in some spots was noteworthy. At Anchorage Airport, 0.7 inches of snow on May 8th tied for third highest snowfall so late in the season, and some of the higher elevations in the Anchorage metro area reported 5 to 7 inches accumulation. In Fairbanks, 0.5 inches of snow on May 6th was not by itself unusual, but it did mark the first occurrence of accumulating snow after green-up since 1943. Unsurprisingly, the highest snowfall total reported was 8.0 inches at the UAF Toolik Lake Field station in the Brooks Range.
Sea Ice
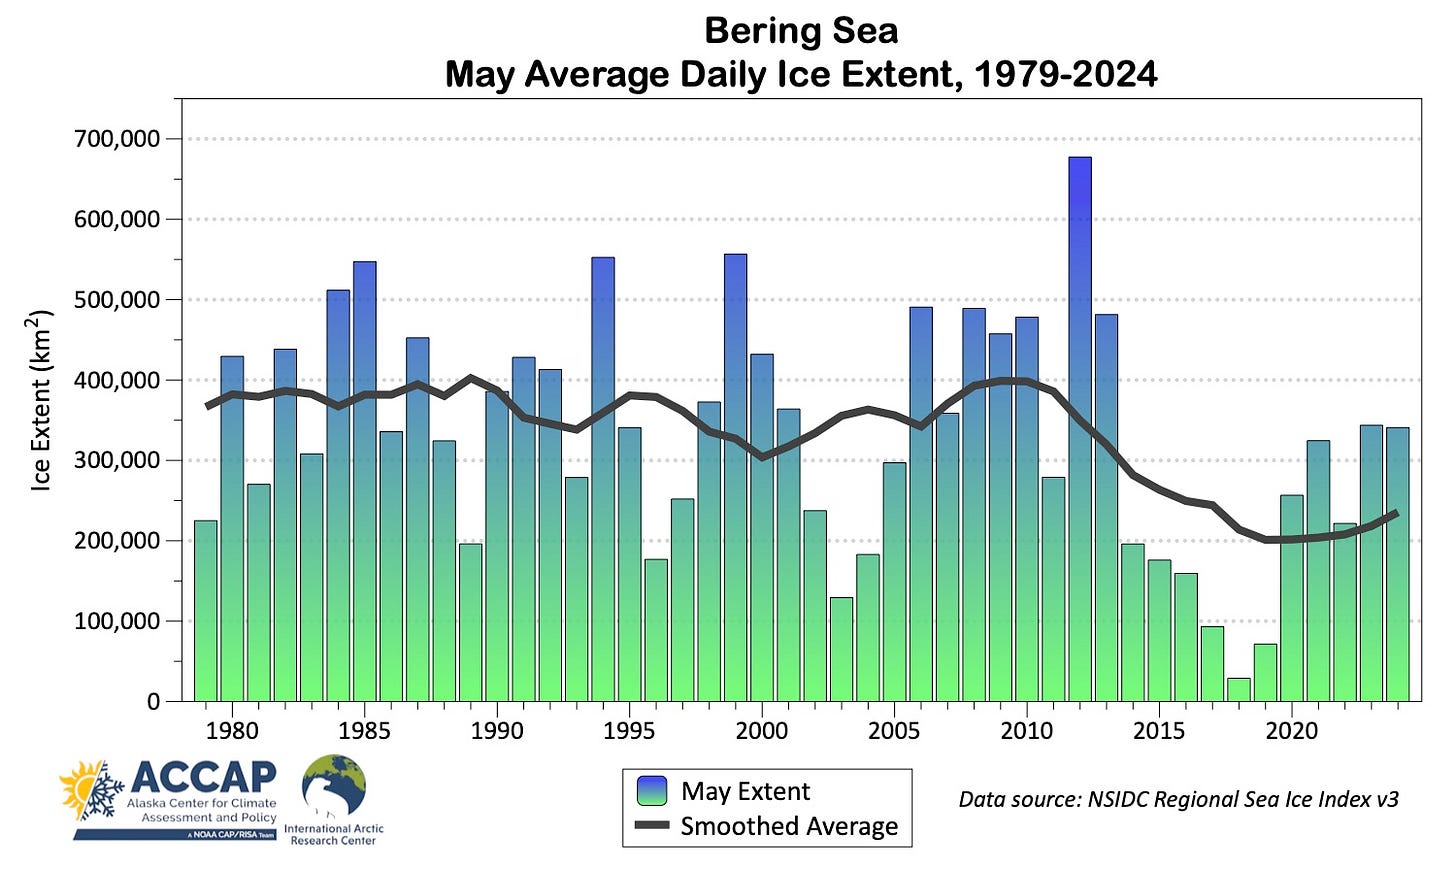
Sea ice extent in the Bering Sea started off May somewhat above average, but decreased by 81 percent during the month, which is a bit more than usual. The median daily Bering Sea Ice extent in May, shown in Fig. 3, was almost the same as in May 2023. In contrast, there were only occasional episodes of low concentration ice in the southern Chukchi Sea north of the Bering Strait, though persistent east winds finally allowed for sustained open water near the North Slope coast the second half of the month.

Figure 4 plots the average daily ice extent in May in the Bering Sea. While the ice extent has recovered from the exceptionally low years of 2017-19, there’s been nothing like what would have been even a moderately high year since 2013: between1979 and 2013, the May average ice extent exceeded 400,000 km² in 16 year out of 35 years. Since 2013, that has not occurred even once.

Technical details and underlying data sources
Site-specific climate statistics and factoids from NOAA Regional Climate Center’s ACIS website here. Monthly temperature departures from normal use the published NOAA/NCEI 1991-2020 values whenever available. For most of the FAA airport stations there are no published normals, so derived 1991-2020 normals were constructed from the 1981-2010 PRISM data (Oregon State University) by B. Brettschneider. Canadian departures courtesy P. Duplessis.
Rainfall departures constructed from multiple automated station types but especially the Remote Automated Weather Stations operated by the Alaska Fire Service and the National Park Service. Other stations used include SNOTel (National Resources Conservation Service) and ASOS (NWS) sites. ASOS and SNOTel use 1991-2020 baseline normals and RAWS the 1981-2010 PRISM normals. Because in most of Alaska monthly precipitation trends are not large, at this scale “mixing” baseline periods is not expected to be a problem.
AMSR2 microwave data is from the Advanced Microwave Scanning Radiometer 2 on JAXA's Global Climate Observation Mission - Water 1 (GCOM-W1) satellite at 10km² by 10km² horizontal resolution. The University of Bremen AMSR2 landing page with links to near real-time data in a variety of formats is here.
The NSIDC Sea Ice Index is based on the comparatively low resolution passive microwave data (nominal 25km² by 25km² but in practice is not that good) and given as the 5-day trailing average, so slightly lags changes in sea ice. At regional to Arctic-wide spatial scales this is usually not significant. Details on the Sea Ice Index are here. The regional daily data is available as an Excel spreadsheet here.
These are mostly the many Remote Automated Weather Stations (RAWS) widely deployed around Alaska by the Alaska Fire Service and National Park Service. For most all of these sites, the monthly 1981-2010 normals have been extracted from the Oregon State high resolution PRISM climatology for Alaska


