With the Memorial Day weekend here, except for the higher mountains and North Slope, the Alaska 2023-24 snow season is pretty much finished. Below is a wrap-up based on site specific observations. This means that large parts of the state are not included here because there are no daily snowfall observations. I’ll include a regional snow analysis for the 2023-24 using the ERA5 reanalysis with the Spring 2024 climate monitoring post.
Anchorage and Southcentral Area
In general snowfall in Southcentral was way above normal early in the winter and near or even a bit below normal after New Years, though of course with exceptions.
Anchorage airport (as measured at the NWS Sand Lake office) finished up with 133.3 inches (338.6cm) of snow for the 2023-24 season, 171 percent of normal and the second highest on record: 2011-12 at 134.5 inches (341.6cm) remains the highest in the 71 winters of observations. There is no long-term trend in total seasonal snowfall.

As always in the Anchorage area, there were significant differences in snowfall over short distances, dependent in part on elevation and in part on location relative to the Chugach Mountains. Below are other seasonal totals that I think are reasonably complete:
South Fort Eagle River (2100 ft MSL): 202 inches
Upper Dearmoun (1330 ft MSL): 197 inches
Eagle River (567 ft MSL): 99 inches, 140 percent of normal
Eklutna (640 ft MSL): 90 inches
Mat-Su Area
Talkeenta 7S (380 ft MSL, near Spur Road Junction): 117 inches
Amber Lake: (450 ft MSL): 152 inches
Lazy Mountain (730 ft MSL): 134 inches, 163 percent of normal
Little Hatcher Pass (900 ft MSL): 128 inches
Matanuska Experimental Farm (170 ft MSL): 76 inches, 152 percent of normal but less than 2022-23
Prince William Sound Area
Valdez: (60 ft MSL): 296 inches, highest since 2011-12 but close to 2021-22 total
Girdwood (270 ft MSL): 262 inches, 122 percent of normal, highest since 2011-12 but not in the top ten highest since the late 1960s
Main Bay (57 ft MSL): 265 inches, 102 percent of normal and less than previous two season
Kenai Peninsula and Kodiak
There are no readily available daily snowfall observations anywhere in the lower Kenai Peninsula or Seward areas. Here’s what there is:
Moose Pass (490 ft MSL): 100 inches (probably incomplete)
Funny River: (290 ft MSL): 77 inches (probably incomplete)
Soldotna 5SSW (180 ft MSL): 65 inches
Kodiak Water Treatment Plant (50 ft MSL): 23 inches, 54 percent of normal
Juneau and Southeast Alaska
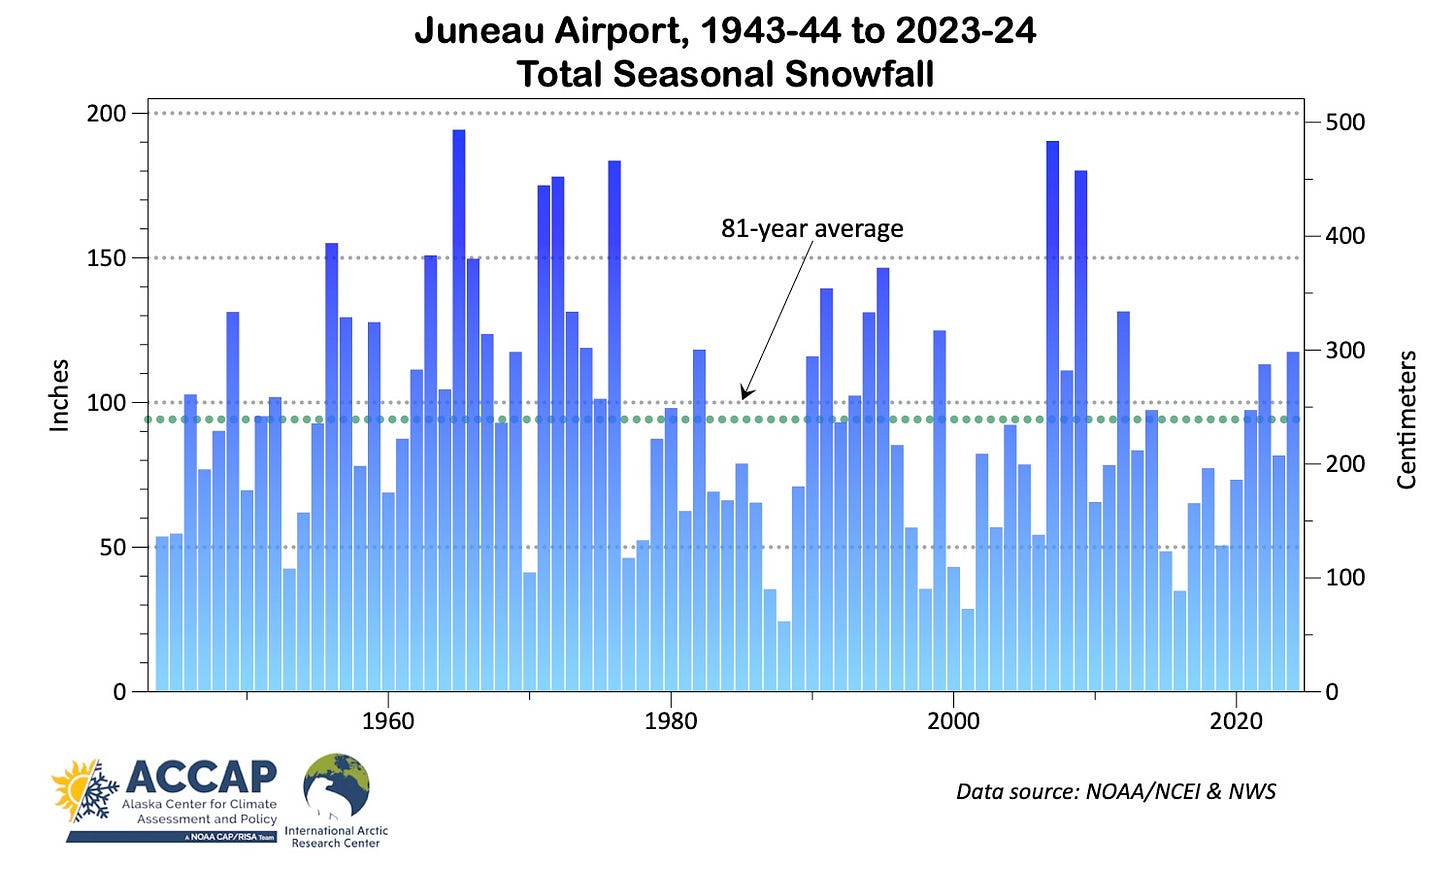
Juneau airport finished up with 117.5 inches (298.5cm) of snow for the season, which 134 percent of normal and the highest seasonal total since 2011-12. Nearly two thirds of that total fell in January and 64.6 inches (164.1cm) in the two weeks ending January 25th is the highest two-week total on record. Snowfall the rest of the winter was below normal. There’s no long term trend in seasonal total snowfall.

Other snow totals in the greater Juneau area
Snettisham Power Plant (30 ft MSL): 236 inches
Annex Creek (90 ft MSL): 212 inches
NWS Forecast Office, Mendenhall Valley (110 ft MSL): 141 inches
Auke Bay (40 ft MSL): 105 inches, 130 percent of normal
Northern and Central Southeast
Haines Highway Customs Station (820 ft MSL): 237 inches, 97 percent of normal
Haines (100 ft MSL): 161 inches, 99 percent of normal
Pelican (10 ft MSL): 130 inches
Hoonah (130 ft MSL): 113 inches
Southern and Outer Southeast
Little Port Walter (10 ft MSL): 74 inches, 73 percent of normal
Ketchikan 10N (300 ft MSL): 25 inches
Sitka Water Treatment Plant (40 ft MSL): 21 inches
Metlakatla Power Plant (60 ft MSL): 13 inches
Craig (43 ft MSL): 11 inches
Fairbanks and Interior Alaska
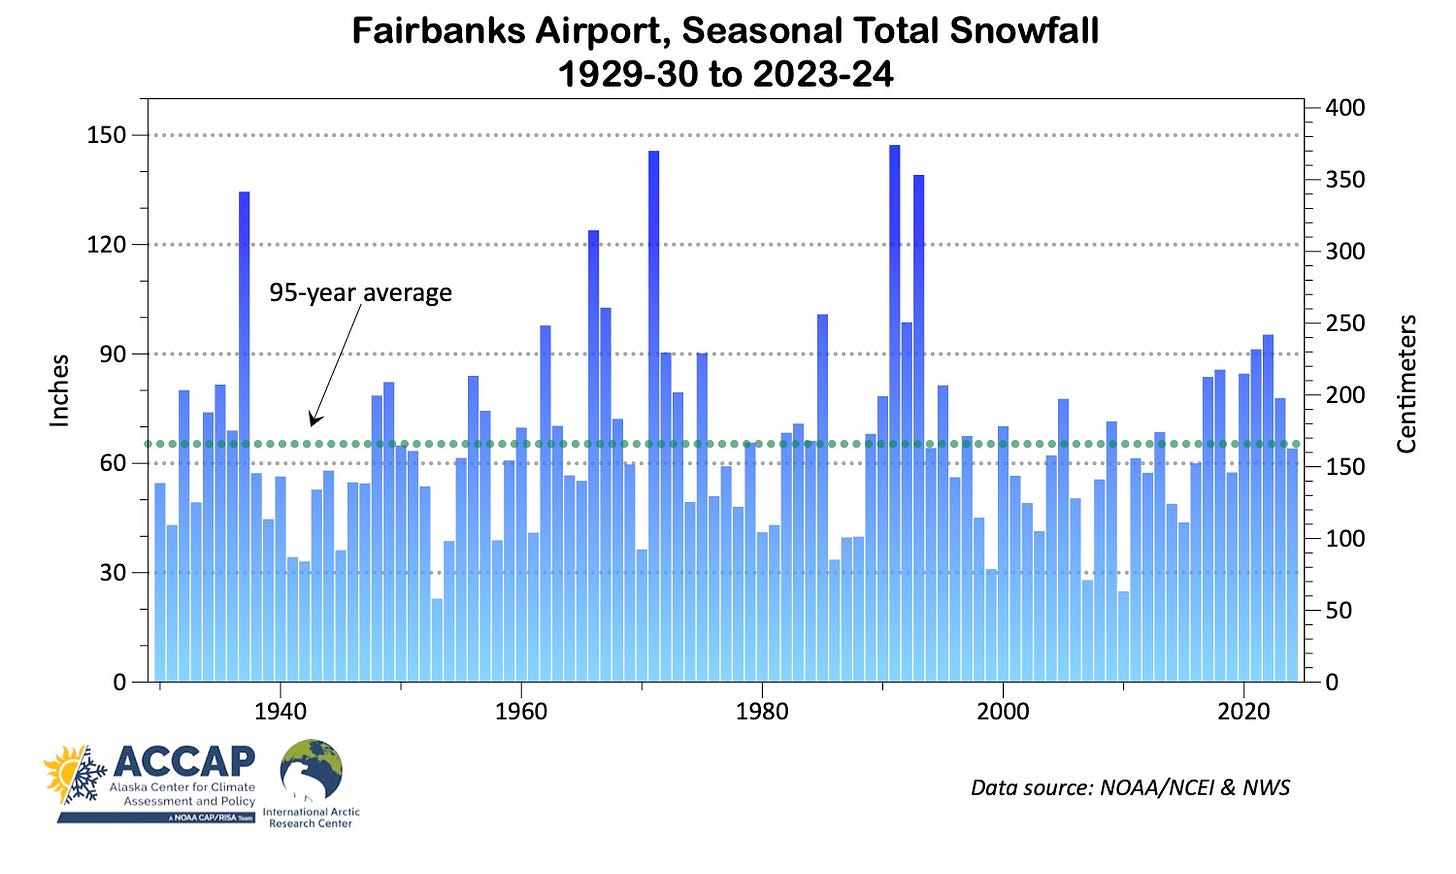
Fairbanks reported 64.1 inches (162.8cm) of snow for the season, 99 percent of normal but this was the lowest total since 2018-19. As is often the case (but not in the previous few years), snowfall after January was light. In fact, the total snowfall February through May was only 10 inches, the lowest total in that period since 2015-16.

The Fairbanks area usually has less dramatic differences in seasonal snowfall totals than coastal areas unless there is a major early or late season storm with rain at valley level and snow levels just a little higher (which did not happen this season).
Keystone Ridge (1600 ft MSL): 77 inches, 99 percent of normal
Goldstream Valley (630 ft MSL): 69 inches
South Fox (1000 ft MSL): 67 inches
North Pole (480 ft MSL): 63 inches
Aurora (440 ft MSL): 58 inches, 100 percent of normal
Elsewhere in the Interior
Wiseman (1180 ft MSL): 102 inches
Bettles (660 ft MSL): 98 inches, 100 percent of normal
Tanana (230 ft MSL): 91 inches, 182 percent of normal, highest since 2019-20
Denali National Park HQ (2070 ft MSL): 82 inches, 107 percent of normal
Eagle (850 ft MSL): 81 inches, 131 percent of normal
Tok (1660 ft MSL): 66 inches
Dry Creek (1360 ft MSL): 62 inches, 109 percent of normal
Circle Hot Springs (860 ft MSL): 53 inches
Chicken (1800 ft MSL): 45 inches, 121 percent of normal
Big Delta (1000 ft MSL): 43 inches, 102 percent of normal
Distribution of snow observations in Alaska
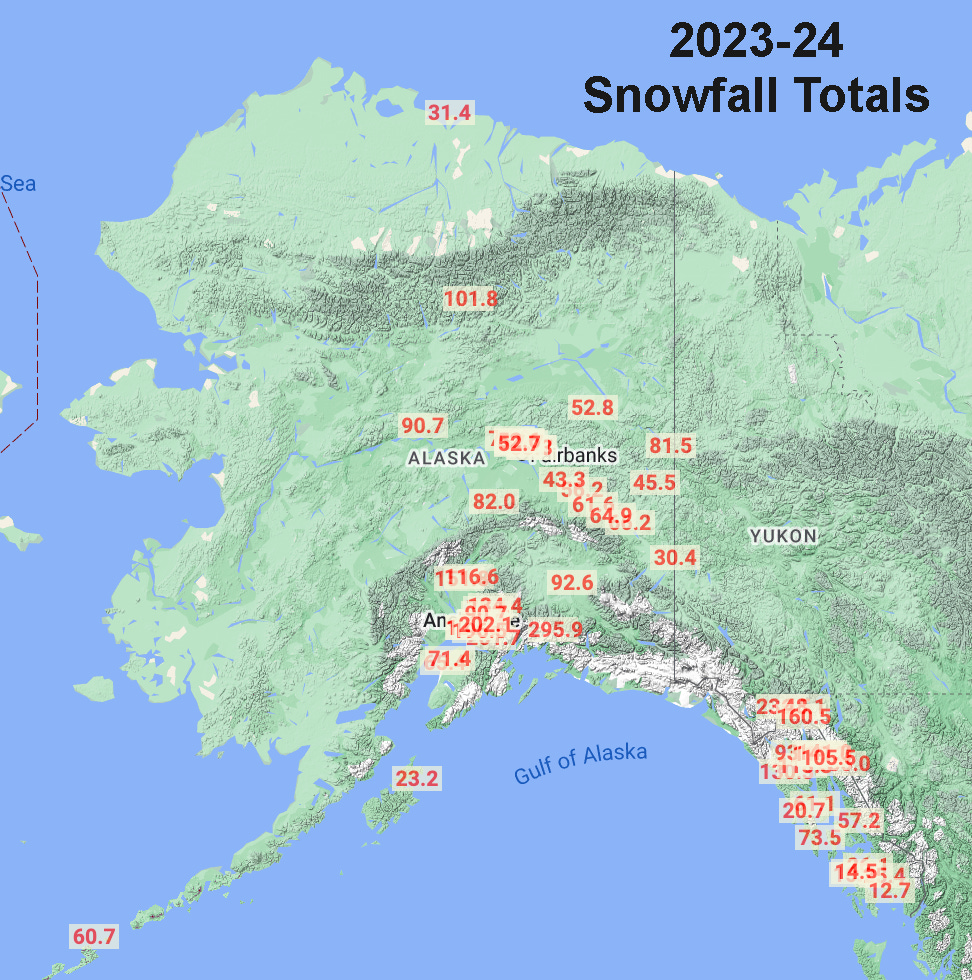
Figure 4 is a plot of 2023-24 seasonal snowfall totals through May 26, (sites with more than 30 days of missing data excluded). The CoCoRaHS citizen science program has helped increase snow observations in parts of urban Alaska (though only a few sites have seasonally complete observations), but the almost complete lack of observations in northern and western Alaska is a sad testament to decline of in situ climate observations in Alaska overall.


Is the apparent Fbks decrease in variance ‘65-‘95 vs. ‘95-present statistically significant?