


March 2025 Arctic Climate Summary
Surprise! Warmer and wetter than average

This is the March 2025 climate summary for the Arctic. The March climate summary for Alaska is here.
To no one’s surprise, March 2025 temperature and precipitation for the Arctic overall were above average. Most of the snowpack that’s going to accumulate for the season has done so by the end of March, and this year, above average snow water equivalent over much of the Russia Arctic and Interior Alaska means that an especially early start to wildfire season is less likely. Arctic-wide Sea ice extent reached its maximum in the second half of March and the month overall was at record low extent.
Temperature
March average temperatures were above the 1991-2020 baseline average over about 75 percent of the Arctic (land and seas poleward of 60°N latitude). The mildest areas (relative to average) were in Nunavut, Canada and adjacent areas in Baffin Bay as well as the Nordic Arctic. Significant parts of the Northwest Territories, Canada and the Russia far east were notably cooler than average, and the Bering Strait region had the coldest March since 2015. However, only a small area in eastern Siberia ranked in the top three coldest Marches since 1950 in ERA5 data, compared to about 6 percent of the Arctic with a “top three” mildest March.

The March average temperature was a bit higher than both 2023 and 2024. Overall, this was the eighth highest March average temperature. While impressive by itself, this is the lowest rank for an Arctic monthly average temperature since May 2024.
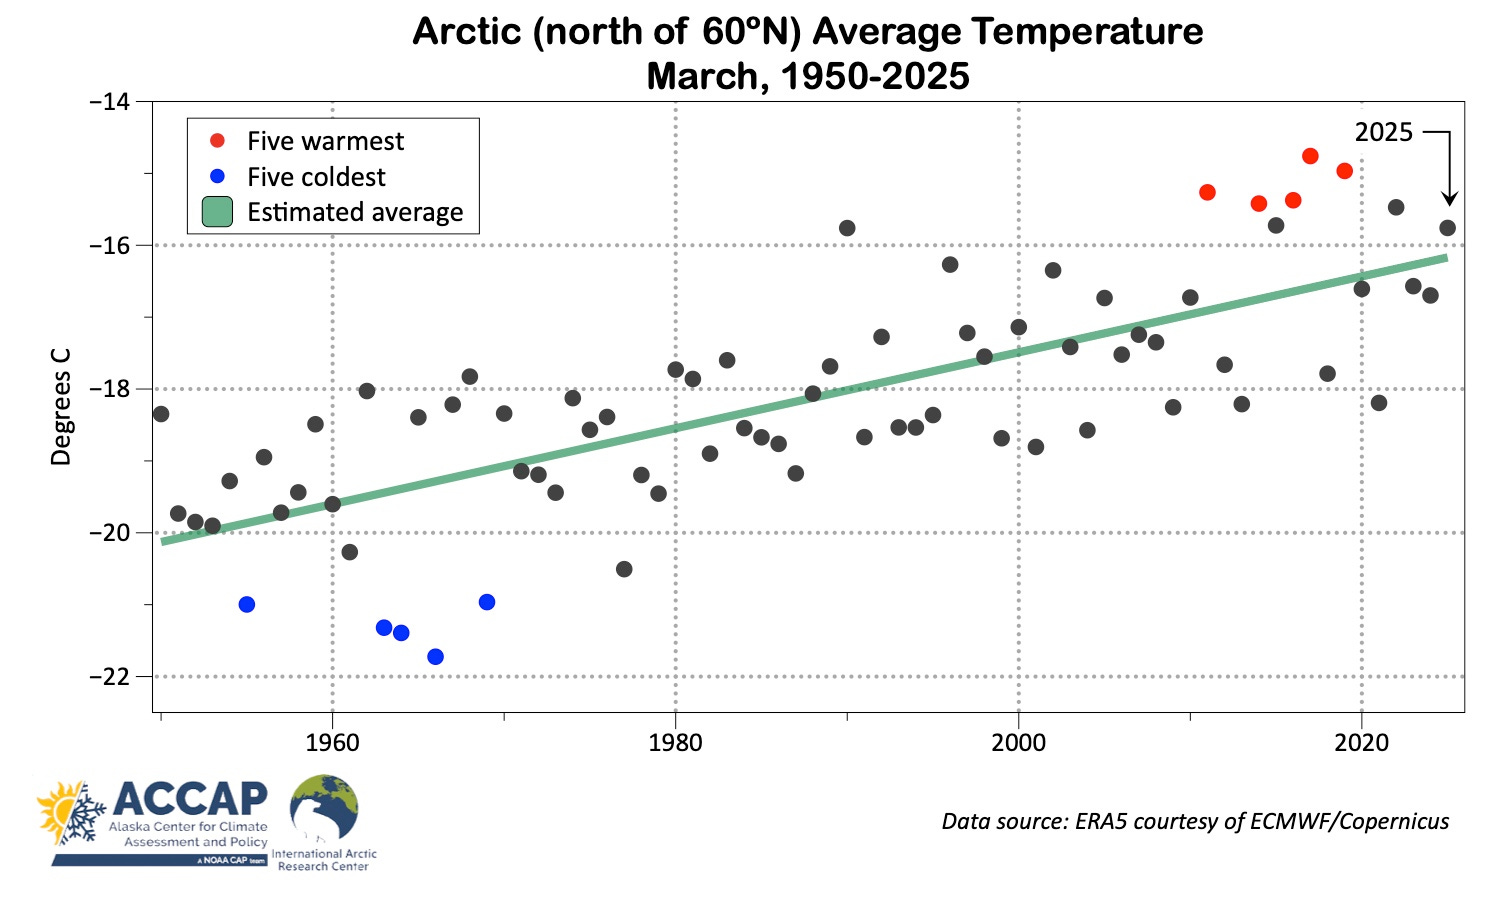
Like all months in the Arctic, the trend is dramatic: in this case a 4°C increase in the average temperature since 1950.
Precipitation
March precipitation in the Arctic overall averaged 109 percent of the 1991-2020 baseline average and the seventh highest total for the month since 1950. Portions of eastern Nunavut, Canada and much of Greenland had way above average totals, while to the west, portions of the Northwest Territories and the Yukon Territory, Canada had "“top three” driest March. Totals relative to average were regionally mixed in the Asian and European Arctic as well.
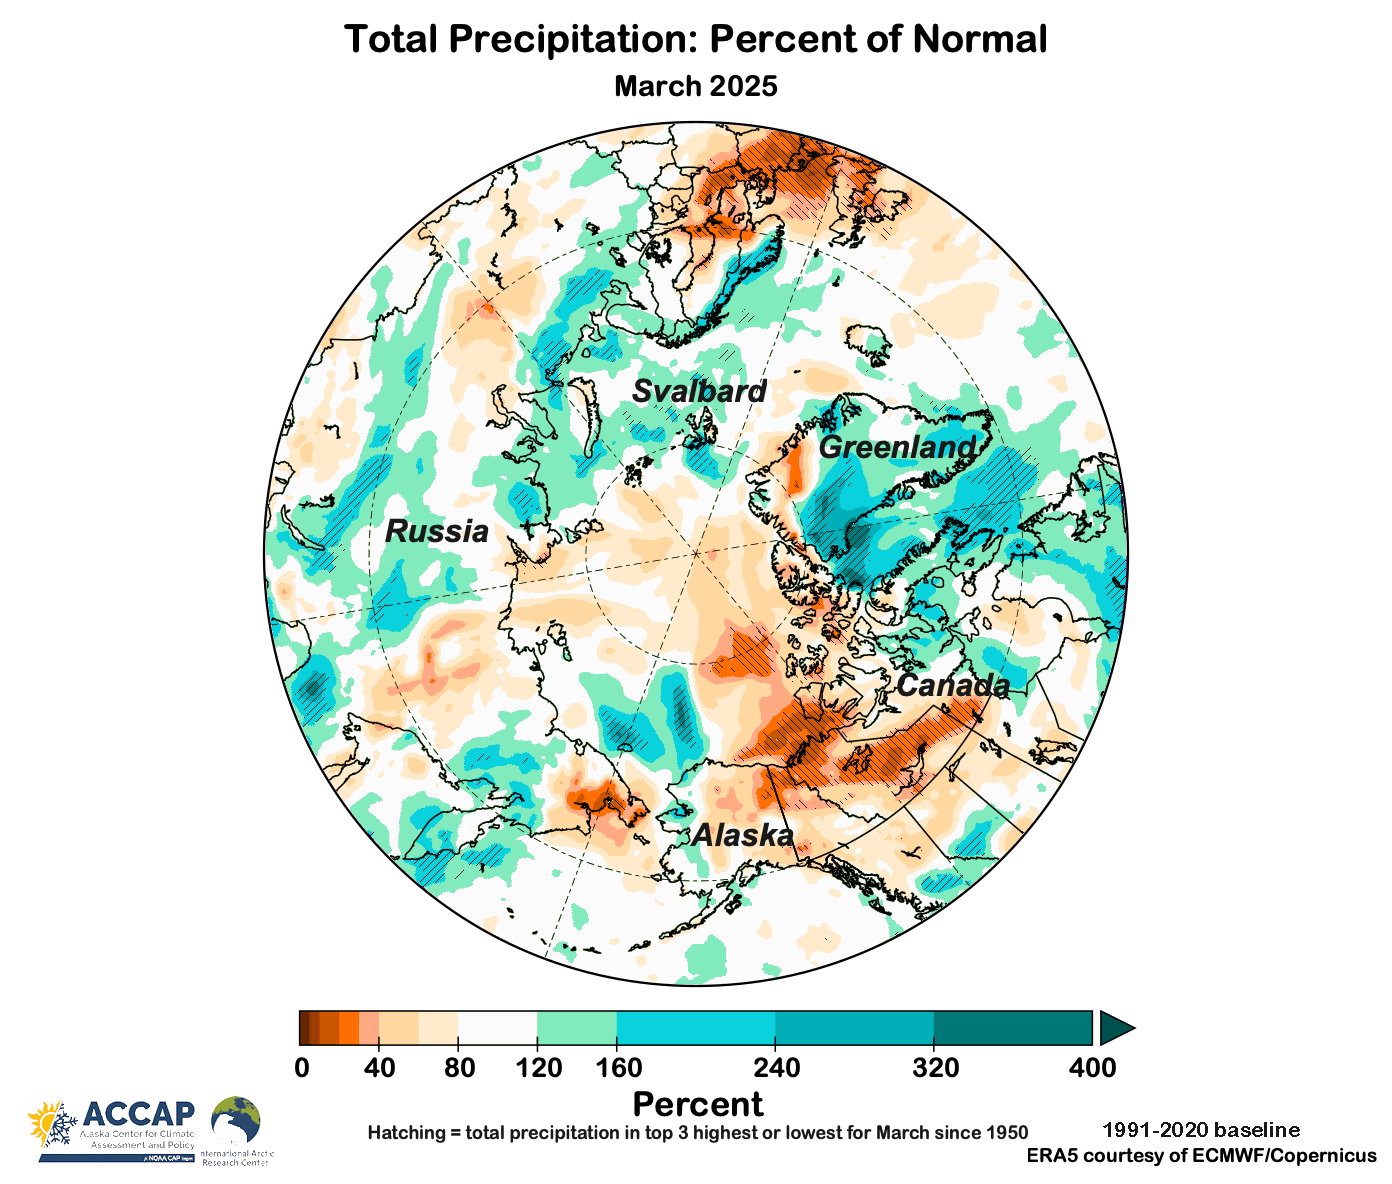
While the month ranked as the seventh wettest March for the Arctic overall, about 53 percent of the area saw March precipitation below the 30-year average. How can a month be the seventh wettest for a region when literally most of the area was drier than long term average? The answer is surpassingly simple, and if you live in an area with a distinct dry season, you probably know how that happens. Much of the Arctic typically receives very little precipitation in March, and of course there can’t be less than zero precipitation. On the other hand, when all the ingredients come together, there can be a lot of precipitation even in typically dry areas, and there’s no upper limit.
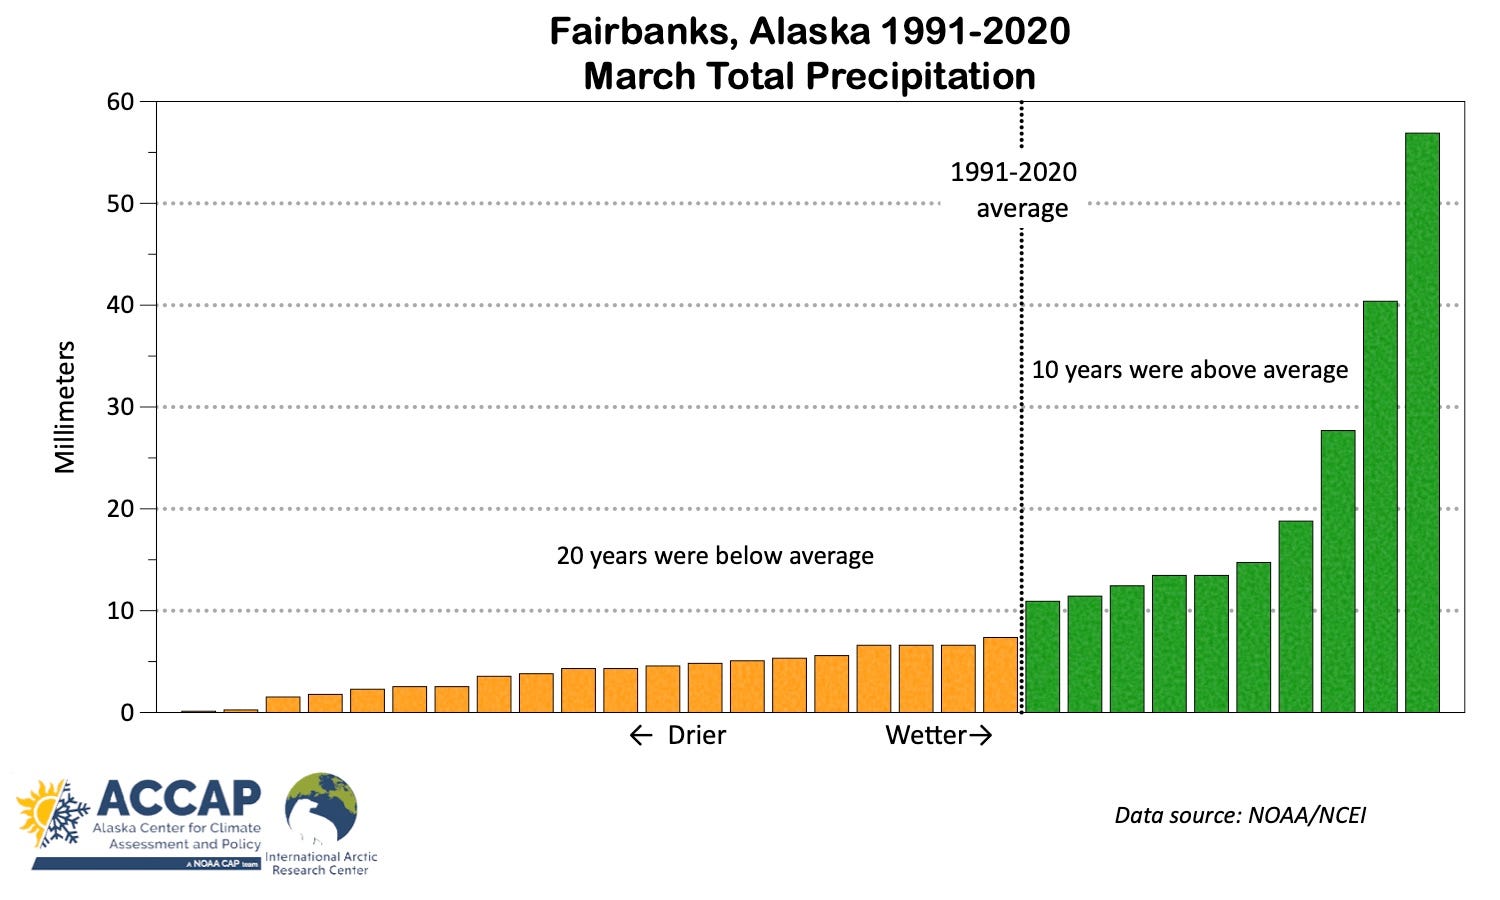
Figure 4 illustrates this with site-specific data from Fairbanks, Alaska. Total precipitation each March between 1991 and 2020 is plotted, rank ordered from lowest precipitation on the left to the highest on the right. The 30-year average (mean) is 10mm. However, in most years the total is below the average because the driest years are butting up against the zero lower limit while the wettest Marches have much more than most and this pushes up the mean: in fact, the three wettest Marches (1991, 2009 and 2020) account for more than 40 percent of the entire 1991-2020 total.
Snowpack
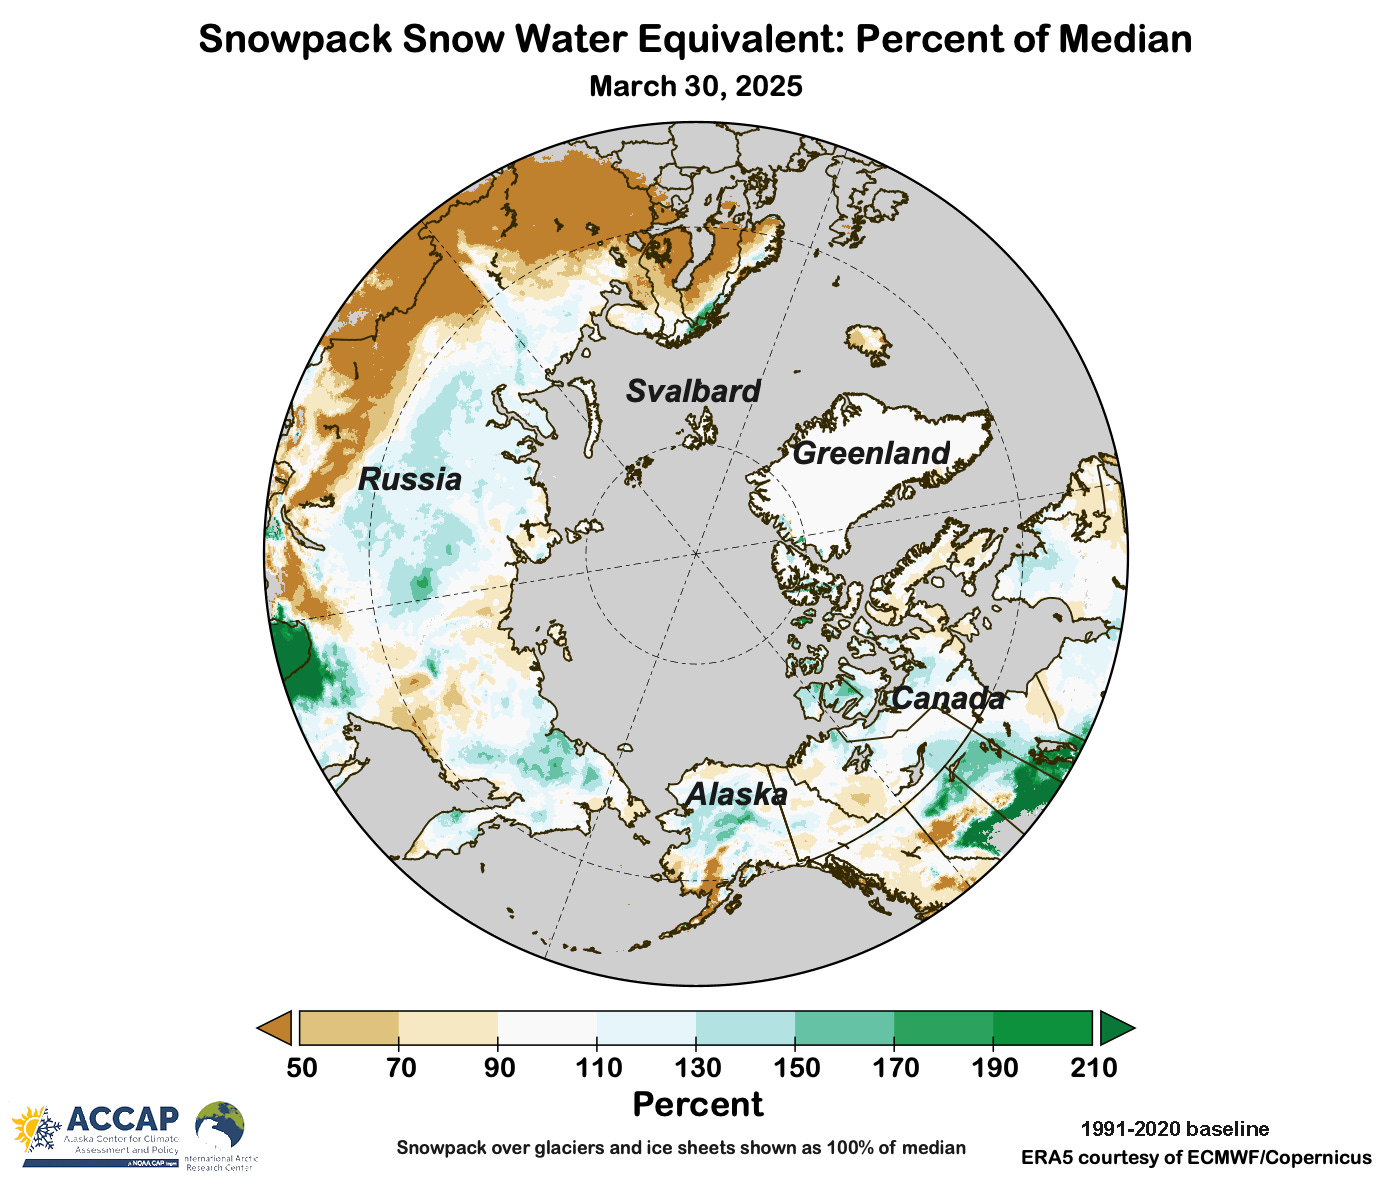
Figure 4 shows the snowpack snow water equivalent (the amount of water if all the snow was melted at once) as of March 30. At this scale, the main features include above normal snowpack across much of the Russia Arctic except for parts of eastern Siberia and below normal snowpack on the Nordic Arctic. North America snowpack is mixed, with especially marked contrast across Alaska. Also worrisome is the mostly below snowpack in much of the boreal forest region of the northwest Canada Arctic.
Sea Ice
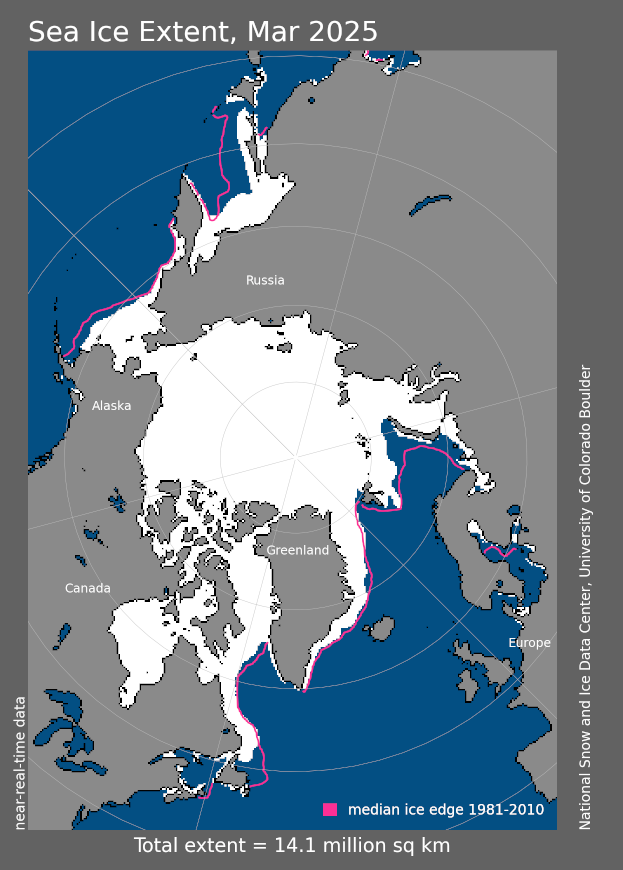
Sea ice extent in the Arctic1 reached the seasonal maximum on March 22, and it was the lowest seasonal maximum in the 47-year satellite record (more information in my post here). Unsurprisingly, the March average extent was also the lowest in the satellite era. The average sea ice extent of 14.14 million km² was about 887,000 km² (6 percent) lower than the 1991-2020 average.
Technical Details
As usual in this newsletter, Arctic means “poleward of 60°N” unless otherwise specified.
ERA5 monthly temperatures, precipitation and snow data available here.
Code by B. Brettschneider/NWS Alaska Region allowing rapid ERA5 regional analysis is invaluable for my work.
The NSIDC Sea Ice Index is based on the comparatively low resolution passive microwave data (nominal 25km² by 25km² but in practice is not that good) and given as the 5-day trailing average, so slightly lags changes in sea ice. At regional to Arctic-wide spatial scales this is usually not significant. Details on the Sea Ice Index are here.
Sea ice on the east coast of Canada and in the Sea of Okhotsk in late winter and early spring can extend south of 50°N, well beyond most definitions of “the Arctic”. However, by convention this is included in the Arctic sea ice total area. More rigorously, this would be referred to as the northern hemisphere sea ice extent.
No surprises. The multi-decade trend lines are clear. But I would not expect to see the apparent linear progression. Shouldn't the graphic show a curve in recent time?
How do you summarize “climate” based on one month?