The March 2025 Arctic climate summary is here.
Temperatures
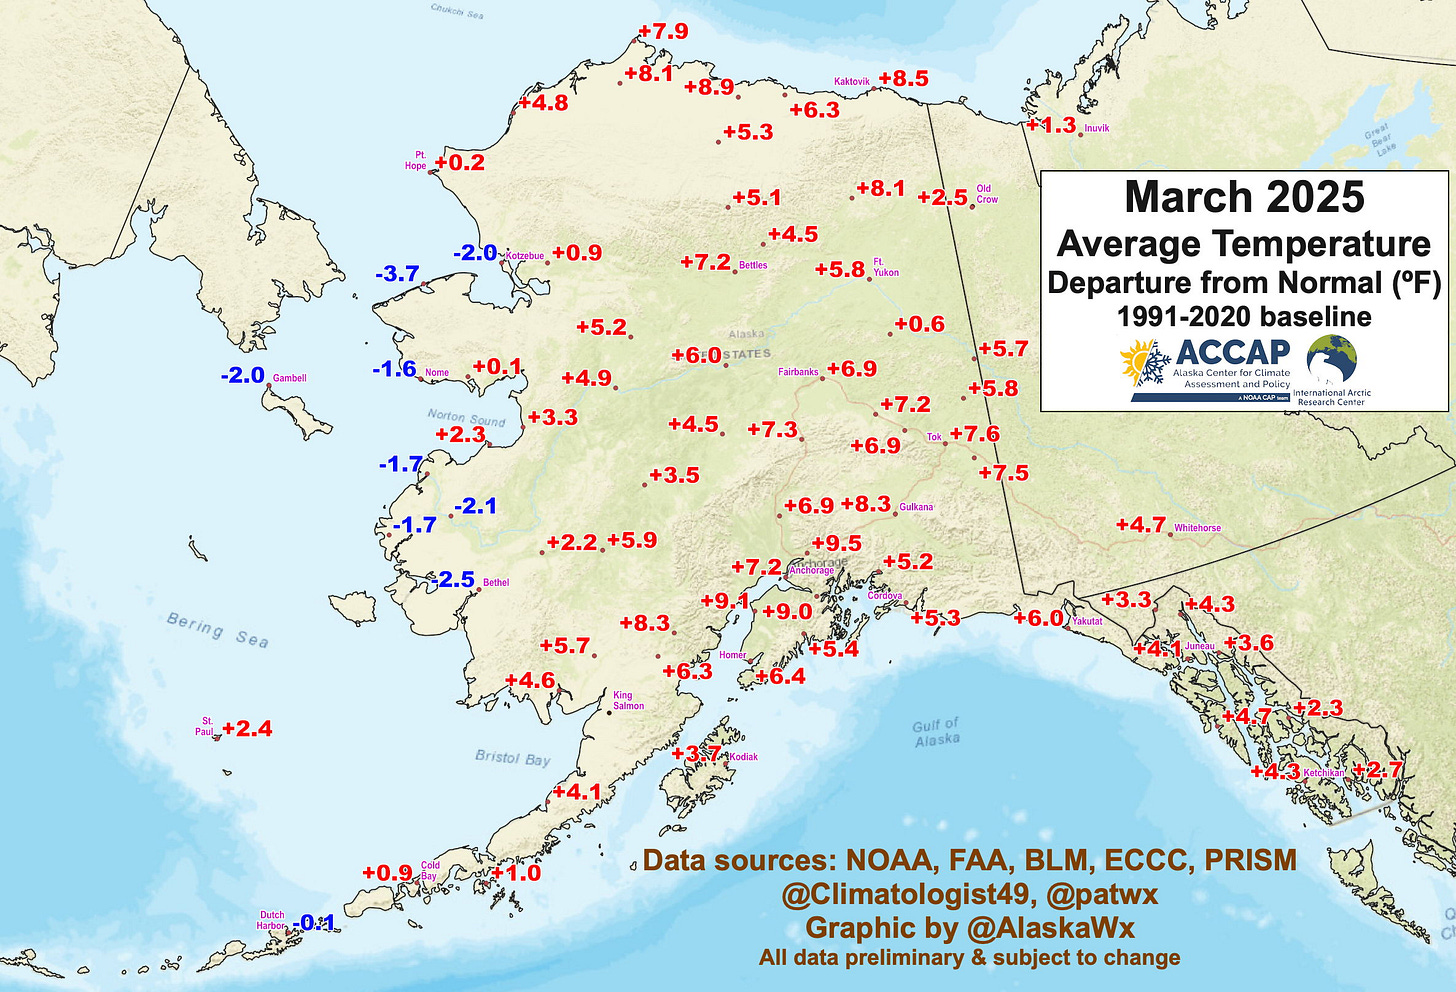
March 2025 was milder than the 1991-2020 average over most of the state (88 percent of the state in ERA5 data) but was not in the the top ten mildest in either the ERA5 data or NCEI analysis. Evident in Fig. 1a is the very sharp transition from above average to below average across the west coast. On St. Lawrence Island this was the coldest March since 2012.

Figure 1b. shows the site specific temperature temperatures. This month there is pretty good agreement between the station observations and ERA5. A few places in Southcentral had a top ten mildest March.

Temperature extremes around the state from reliable reports in March ranged from 63F (17.2C) at Thorne Bay (Prince of Wales Island) on March 27th to -40F (-40.0C) at the Pargon Creek SNOTel northeast of White Mountain on the Seward Peninsula on the 24th. The lowest reported community temperature was -34F (-36.7C) at Selawik on the 17th.
Precipitation and Snow
March is climatologically either the driest or second driest month for most of mainland Alaska, and this year was generally true to form. Figure 2a shows that precipitation totals were below normal for much of Alaska, although not everywhere. Much of central and southern Southeast were near to a bit above normal, as was Kodiak and a ribbon of above normal totals from Bristol Bay northward to Northwest Arctic Borough and the western North Slope.

Figure 2b shows the site specific totals relative to the 1991-2020 normals.

Snowfall in March was correspondingly light in most areas. One exception was the urban Anchorage area, where 16.9 inches of powdery snow at the airport was above normal and almost four times the amount that fell all of the December through February mid-winter season. There are no in situ snow observations in the western Alaska area that had above normal precipitation. From the available observations, the NWS cooperative site Haines 40NW (at the Alaska/BC border on the Haines Highway in northernmost Southeast) total of 24.8 inches (63.0cm) was the highest in state.
Sea Ice
Sea ice in the Bering Sea reached its seasonal maximum extent on March 26, tied for the fourth lowest since 1979 in data from the National Snow and Ice Data Center. The March monthly average was not quite as low, ranking as tenth lowest in the satellite era. The median daily concentration from the higher resolution AMSR2 passive microwave data is shown in Fig 3.
The area of lower concentration on the south side of the northern Bering Sea lands is a normal feature of the Spring ice and occurs during periods of sustained north winds that push the ice away from the land.
Snowpack
With relatively low snow in March, snowpack snow water equivalent at the end of the month showed little overall change from February. Thin to non-existent snowpack was found across the Bristol Bay region and across low elevations on the Alaska Peninsula and Kodiak Island, as well as portions of the upper Kuskokwim valley, the western Kenai Peninsula northward across Anchorage to the Palmer and Wasilla areas. Snowpack was also way below median in most of Southeast from Juneau southward. In contrast, much of the Interior except for portions of the upper Yukon Valley had above median snowpack.

This sharp contrast in snowpack snow water equivalent will play a role in the shape of break-up on Alaska’s big rivers in the coming weeks.


Sea ice low again. That mapping tool is great. Thank you!