Sea ice extent for the Arctic as a whole has most likely reached the maximum extent for the season, while ice extent near Alaska is still flirting with the highest level for Spring 2024.
Arctic Sea Ice
Sea ice extent in the Arctic has very likely reached the maximum for the 2023-24 cold season. The 5-day running average extent from the National Snow and Ice Data Center preliminary peaked at15.01 million km² on March 14 and has since fallen more than 150,000 km² (through March 24). Figure 1 plots the annual maximum extent each year since 1979. This year brought the highest maximum extent since 2020, and more than 300,000 km² above the 2014-2023 10-year median.

The trend over the past 46 years is clear, with the typical maximum extent now more than 10 percent lower than in the early 1980s. The maximum Arctic ice extent is determined by ice in the “marginal” seas, e.g. the Sea of Okhotsk and Bering Seas on the Pacific side of the Arctic and in the Barents Sea, Baffin Bay and the Greenland Sea on the Atlantic side, with the entire central Arctic basin having 15 percent or higher sea ice concentration.
The model ice thickness for March 23 from the Danish Meteorological Institute (DMI) for this year (left) and the same date last year (right) is shown in Fig. 2. As I noted in last month’s sea ice update, northwest of the Canadian Arctic Islands there is much less ice that is 3 meters or more thick this year compared to last year, and total modeled ice volume in this framework remains lower than any of the previous four years.

The age of Arctic sea ice age product shows just how stark the picture is this spring. Figure 3 shows the analyzed ice age (years) as of early March. First year ice is much more susceptible to disruption and melt by summer storms and waves action. The band of 2 and 3 year ice east of Greenland is being transported out of the Arctic and is destined to melt in the North Atlantic in the coming months.

Sea Ice near Alaska
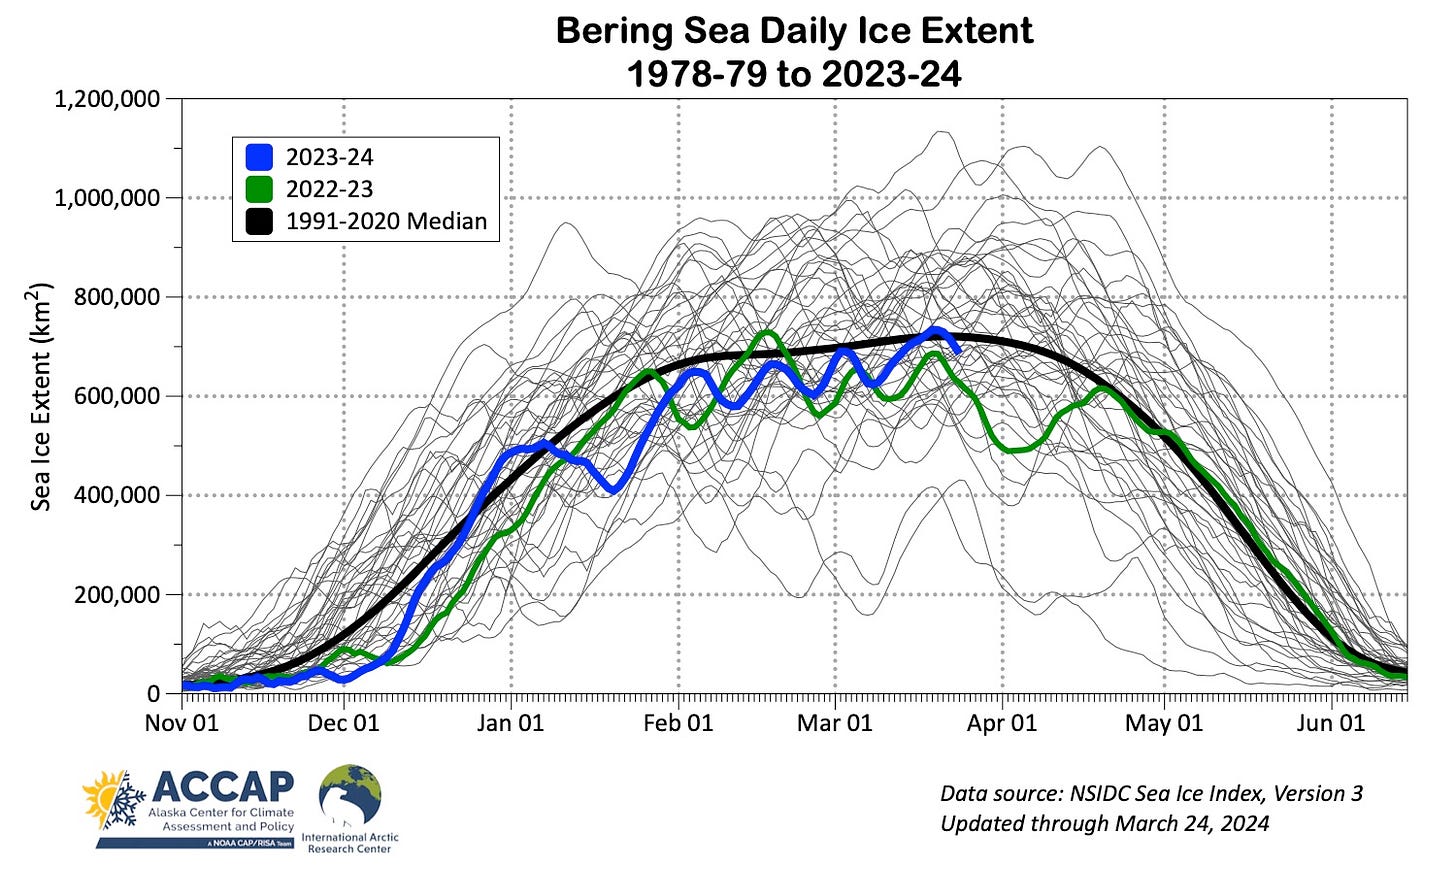
I had expected to be able to report that sea ice in the Bering Sea reached its maximum extent for the season last week, and that might well be the case, but not definitely. Fig 4 shows the March 18 sea ice concentration analysis near Alaska from the National Weather Service Alaska Region Sea Ice Program, which (so far at least) is the farthest south extent of the ice edge in Alaskan waters.

After several days of stormy south to southeast winds, from about the Pribilof Island westward turned north after March 23 and pushed the ice edge to the south. Figure 5 plots the daily ice extent from the National Snow and Ice Data Center’s Sea Ice Index, version 3 through March 24. The Sea Ice Index is a 5-day running average, e.g. the value for March 24 is the average of March 20 through 24, so the SII lags the daily analysis. In any case, the 2024 maximum ice extent is sure to be well below the 1991-2020 average maximum.

The good news is that the cold weather during the first half of March thickened ice in the southern Beaufort Sea. Figure 6 shows the combined SMOS/CryoSat-2 sea ice thickness product from AWI for the week ending March 21. Based on this multi-satellite derived product, ice thickness was typical to below the 2011-23 median in the Beaufort and eastern Chukchi Seas. Ice in the southwest Chukchi and Bering Seas was mostly thicker than usual with the important exceptions of Norton Sound and the northern Gulf of Anadyr.


Averaging over the period we have reliable data, which of the separate subregions, i.e. Beaufort Sea, etc. provides the best "bellwether" predictions for ice maximums for the Arctic region in general?