Sea ice extent in the Arctic continues to slowly increase toward the seasonal maximum extent that in most recent years occurs in early March. There been some interesting developments with sea ice since my mid-January sea ice post, so here’s an update.
Arctic-wide Sea Ice
February 17 Arctic-wide total sea ice extent effectively the same as this date in 2020 and 2022, and ranks as 15th lowest for February 17 since 1979. The total extent of 14.61 million km² is about 5 percent below the 1981-2010 median. Figure 1 shows that most of the “missing ice” is in the Barents Sea (a change from mid-January) and on the Newfound and Labrador coast. Sea ice on the Pacific side of the Arctic, in the Bering Sea and the Sea of Okhotsk, is close to the baseline median.
While horizontal ice extent is close to average, ice volume is quite low. Figure 2 shows the modeled sea ice thickness from the Danish Meteorological Institute (DMI) for February 17 (left) and the same date last year (right). Northwest of the Canadian Arctic Islands there is much less ice that is 3 meters or more thick this year compared to last year. While sea ice will continue to thicken for another 6 to 8 weeks, this is an ominous sign for ice loss in the upcoming summer simply because thicker ice takes more heat to melt, which can come from under ice ocean water, air temperatures or wave action (which adds mechanical breakage of the ice into the mix).

Integrating sea ice concentration and thickness gives an estimate of the Arctic-wide sea ice volume: in DMI’s model, ice volume currently is the lowest in the past five years for this point in the season and is about 5 percent lower than last February. While typically, the maximum sea ice volume occurs in April, at this point the trajectory of the season is pretty much locked in, with the main variable of interest being where the thick ice ends up as the melt season commences.
Alaska Sea Ice
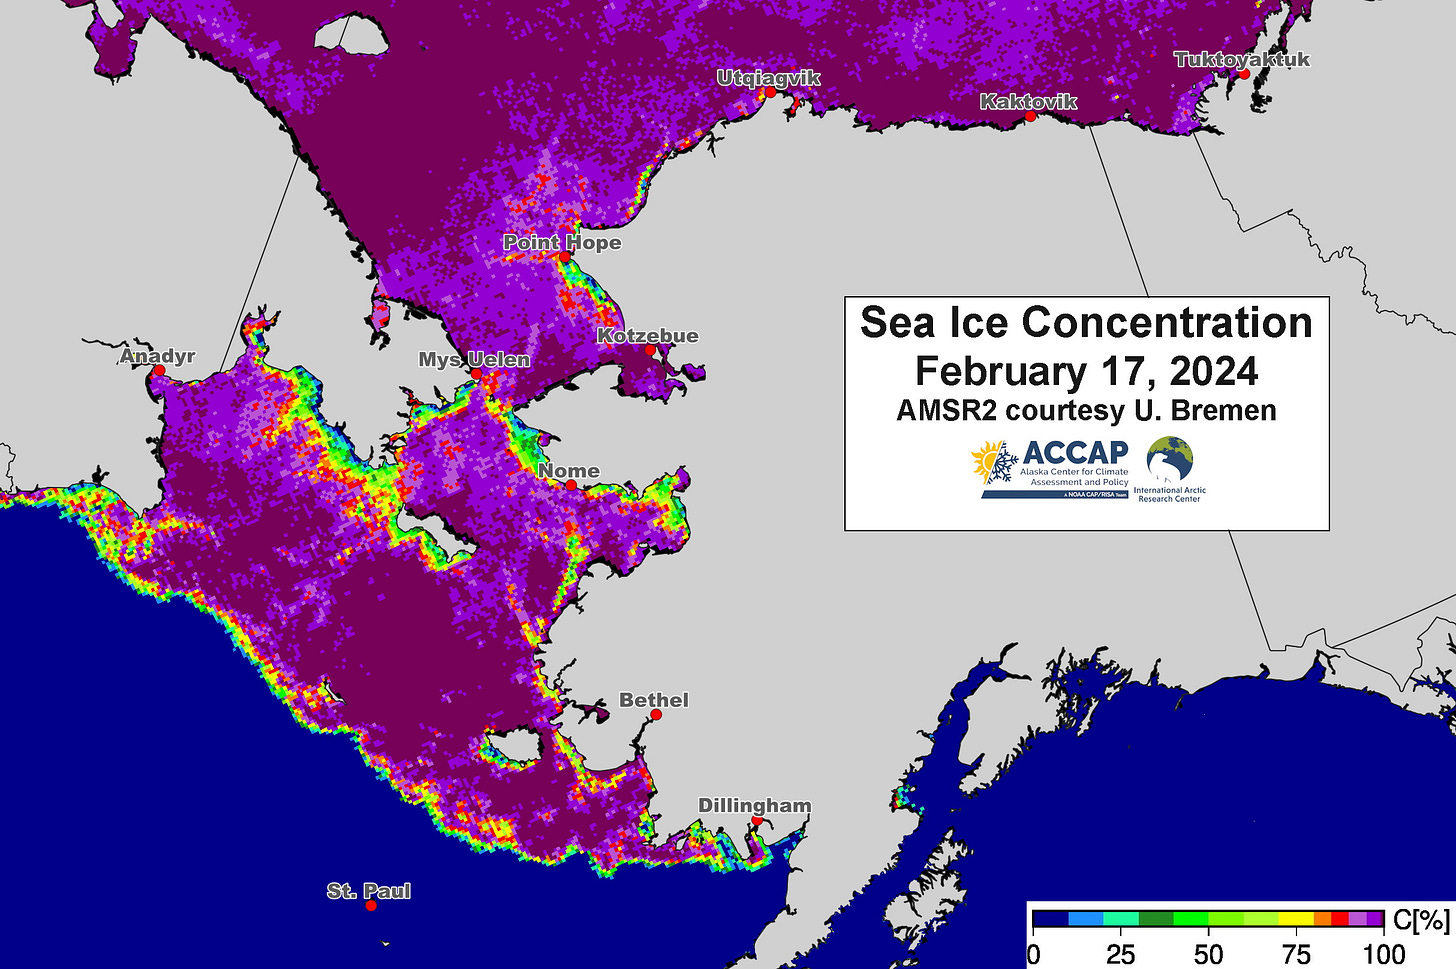
Figure 4 shows sea ice concentration from the higher resolution AMSR2 dataset. As of February 17, 2024, the pack ice edge was about 95 miles (150km) northeast of St. Paul Island and about 45 miles south of St. Matthew Island. The regions of lower concentration ice off the south to southwest facing shores of some land areas, e.g. Seward Peninsula, St. Lawrence Island, are common this time of year and reflect recent north to northeast winds that pushes ice away from the land.

The Bering Sea daily sea ice extent for the past 46 seasons is shown in Fig. 4. The mid-February sea ice extent (NSIDC data) was close to the 1991-2020 median but lower than the same time last year (the maximum sea ice extent for the 2022-23 season occurred on February 17).

Satellite derived sea ice thickness for the week ending February 15 is shown in Fig. 5. This uses the blended sea ice thickness product that combines observations from SMOS (good for thinner ice) and CryoSat-2 (good for thicker ice) data and is available since the 2010-11 winter. I’ve plotted the current thickness as one of three categories (terciles) relative to the same week 2011 through 2023. This is much shorter than is usual for a climate baseline but as this includes both high and low ice years it’s hopefully representative of the current climate.

Most of the Bering Sea, southern Chukchi Sea, and most of the southern Beaufort Sea have near to significantly below (recent) average thickness, while the western Chukchi and eastern East Siberian Seas have above average thickness. Especially in the Bering Sea, where ice is thinner than north of the Bering Strait, this relative sea ice thickness could change significantly depending on winds and storminess.


Really valuable information. You are providing a greatly needed service! I don't fancy the trendlines the data you present indicate- .spells trouble for summer and later solar warming of ice-free surface water. With mixing, what happens to all those mega-joules? The Arctic oceanic heat savings account's deposits keep outpacing the withdrawals except for short-term fluctuations. That leads to a place we don't necessarily want to go.
As an aside - the Great Lakes are (unbelievably) nearly ice free.
https://www.climate.gov/news-features/event-tracker/ice-coverage-nearly-nonexistent-across-great-lakes-historical-peak
*
CURRENT ANALYSIS: https://usicecenter.gov/pub/iceconc_D9.png
*
MODIS SAT Imagery of Hudson Bay also shows some very small areas of low or even isolated near ice free conditions along NW coast of the Bay north of Churchill and some spots within James Bay (mainly wind driven low volume ice) - but especially low thickness across much of Hudson Bay (possible record for date) due unseasonably 'warm' winter season