A quick update on Arctic sea ice as of mid-January. While total sea ice extent is higher than recent years, contrary to some social media wags, sea ice extent is not at record high levels. In fact, current sea ice extent is lower than the extent was at this point in the winter every year from 1979 through 2004. Sea ice thickness is low even compared to most recent years.
Sea Ice Extent
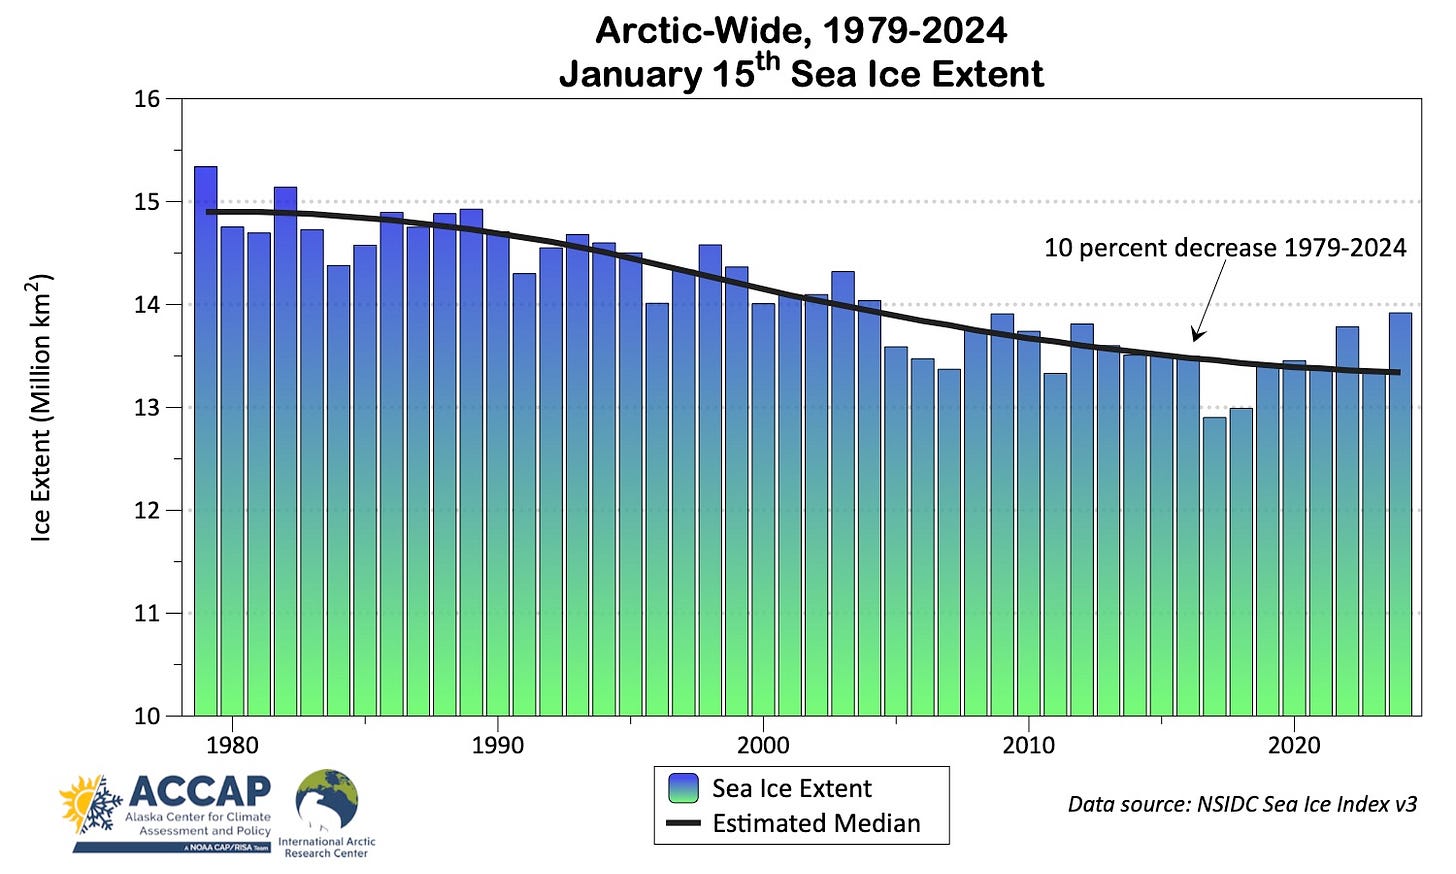
Sea ice extent as of January 15 in National Snow and Ice Data Center (NSIDC) analysis was 13.92 million km². Figure 1 plots the values for each year on this data since 1979 as well as an estimate of the time varying median. The 2024 extent is about 3 percent below the 1981-2010 median, but the highest since 2004, though both 2009 and 2012 were similar.

Although the trend over the past 46 years is not strong compared to the summer, the 10 percent decrease means that typically, more than 1.5 million km² of northern hemisphere ocean that used to have significant ice in mid-January is now open water.
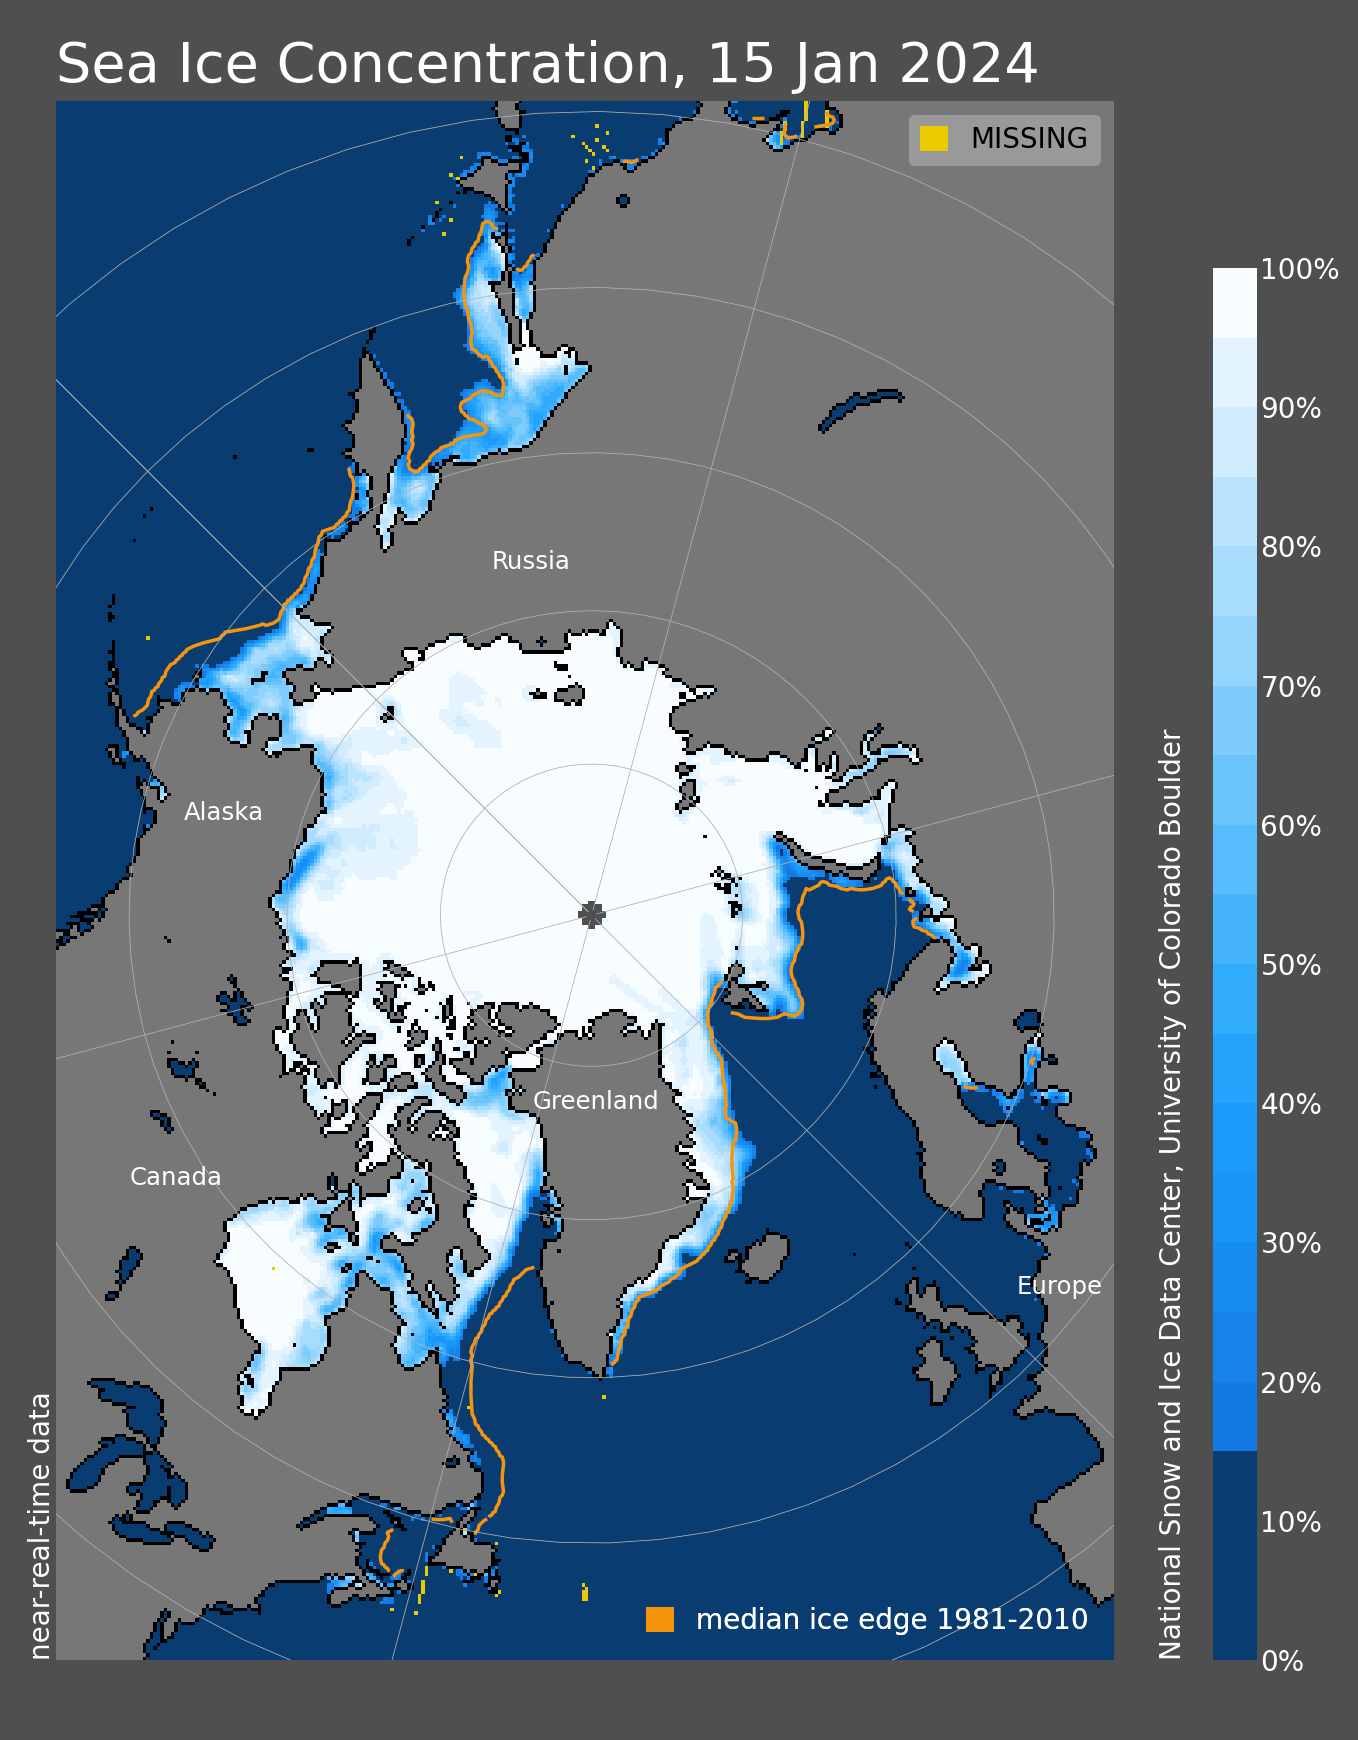
Sea ice concentration for of January 15 from NSIDC is shown in Fig. 2. What’s striking here is how “normal” this looks. In recent years it has often been the case that ice extent is unusually low (more rarely high) in one sector of the Arctic but not another. As of mid-January, in both the Atlantic and Pacific sectors, the southern ice edge was close to the 1981-2010 median. Baffin Bay and the Labrador coast and the Bering Sea had a bit less ice than the 1981-2010 median but the Greenland and Barents Seas ice edge was near median.
Sea Ice Thickness and Volume
While horizontal ice extent is close to “normal”, ice volume is quite low. Figure 3 shows the modeled sea ice thickness from the Danish Meteorological Institute (DMI) for January 15 (left) and the same date last year (right). Note that northwest of the Canadian Arctic Islands there is noticeably less ice that is 3 meters or more thick this year compared to last year. Similarly, north of the Russian coast, this year there is less of the 2-to-3 meter thick ice. Integrating sea ice extent and thickness gives an estimate of the ice volume, which by the DMI estimate is about 5 percent lower this year than at this point in the season in 2023.

Sea Ice Near Alaska
Frequent stormy weather across northern and western since New Year’s Eve has created many areas of lower concentration ice near the Alaska coast. Thin ice has been readily moved around, and in the southeast Bering Sea there has been some ice melt.
Figure 4 compares the AMSR2 December 31, 2023 sea ice concentration (left) to the January 15, 2024 concentration (right). The most obvious changes are Beaufort Sea, where are substantial area of open water and low concentration ice has developed from the northern Yukon Territory coast northwest to north of Prudhoe Bay. In the Chukchi Sea areas of low concentration have developed in many areas from the northern Seward Peninsula coast into Kotzebue Sound and then to north of Point Hope. Open water was seen offshore of Shishmaref the second week of the month, and on January 14 strong winds moved ice through nearshore open water and onto land just west of town. In the Bering Sea, ice has melted out in Bristol Bay, and in the central Bering Sea the ice edge has retreated north about 100 km (60 miles), while ice has increased significantly in the Gulf of Anadyr.

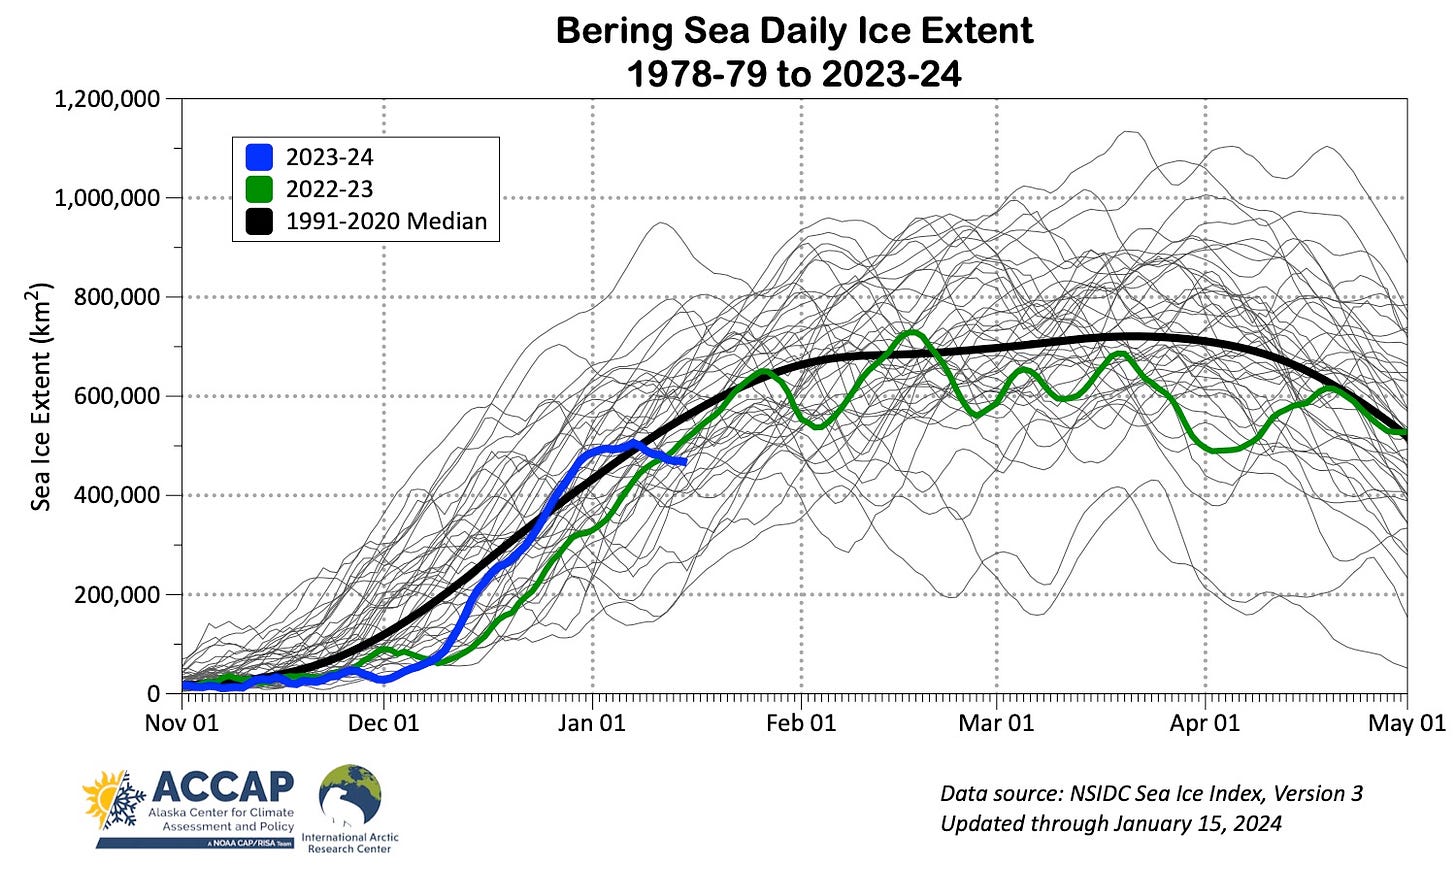
Figure 5 shows the daily evolution of sea ice extent in the Bering Sea from the NSIDC data through January 15, 2024. After increasing rapidly in mid and late December, ice extent increase stalled the first week of January and has since decreased a little.

As is evident from the traces of past season daily ice extent, this is not at all unusual and reflects shifting dominant winds in the eastern Bering Sea, where sea ice has the greatest variability.


