Early and mid-summer weather in Interior Alaska is usually comfortable, with endless days, the occasional thundershower, moderate humidity and mild temperatures. Of course, individual days, weeks or even entire seasons can be quite different in character, and on top of usual variability across time scales there is the warming climate.
For many people (myself included), there are two related summer events that can produce real discomfort, as opposed to say, the inconvenience of “it rained on the kids’ birthday party”. One is heat, the other is wildfire smoke.
Summer Heat
NOAA/NWS has made excessive heat a priority, with an expanded suite of forecast products, but Alaska is not included in that. That’s not surprising, given that by mid-latitude standards nowhere in Alaska gets especially hot. Temperatures 90F and higher occur only in the Interior with any regularity, and nowhere does it get that warm every summer. Overnight low temperatures only rarely stay above 60F and overnight lows above 70F are almost unknown.
So why are less extreme temperatures such a problem? One of course is simply acclimation: people are used to lower temperatures. Another factor is the very long days: at Fairbanks the sun is above the horizon more than 18 hours a day from early May to early August. At the same time, the sun angle at high latitudes is lower than farther south. A lower sun angle means that more of any vertical surface (including, say, your body) is exposed to direct sun during the midday hours and shines into windows more effectively. For more details see Brian Brettschneider’s Forbes article “Why Does It Feel So Warm In Alaska On A Sunny Day?”, here.
Because buildings in Interior Alaska are designed to retain heat during the long winter, and very few residential buildings have any built-in capacity for cooling beyond opening windows, even moderately warm temperatures by mid-latitude standards can result in unpleasantly warm homes. In Interior Alaska daily average temperatures above 65F seem to correspond pretty well as to when it starts to get “uncomfortably warm”
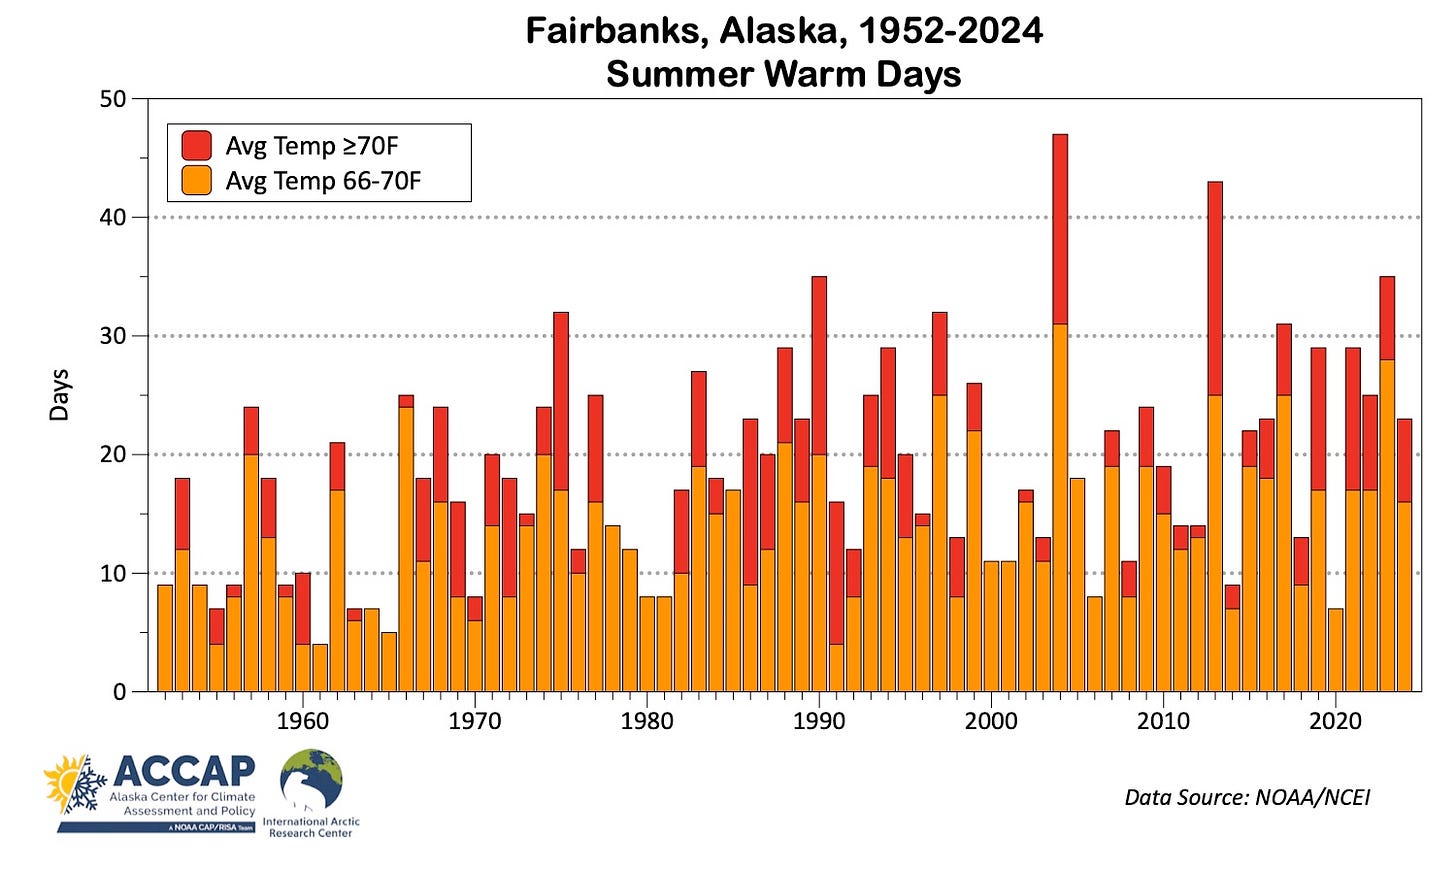
Figure 1 plots the number of days each year 1952 to 2024 for the Fairbanks Airport when the average temperature was above 65F, with the days with an average temperature 70F or higher highlighted. By long standing convention, the daily average temperature is simply the average of the daily high and low. For example, a day with a high of 76F and low of 56F and a day with a high of 81F and low of 51F both have an average of 66F.

Every summer has at least a few “uncomfortably warm” and, no surprise, there is a dramatic trend (86 percent) toward more days per summer with an average temperature above 65F nowadays compared to the early 1950s.
Wildfire Smoke
Wildfire is a long established part of the boreal forest ecosystem, though evidence suggests that both the frequency and intensity of fires have increased in recent decades.
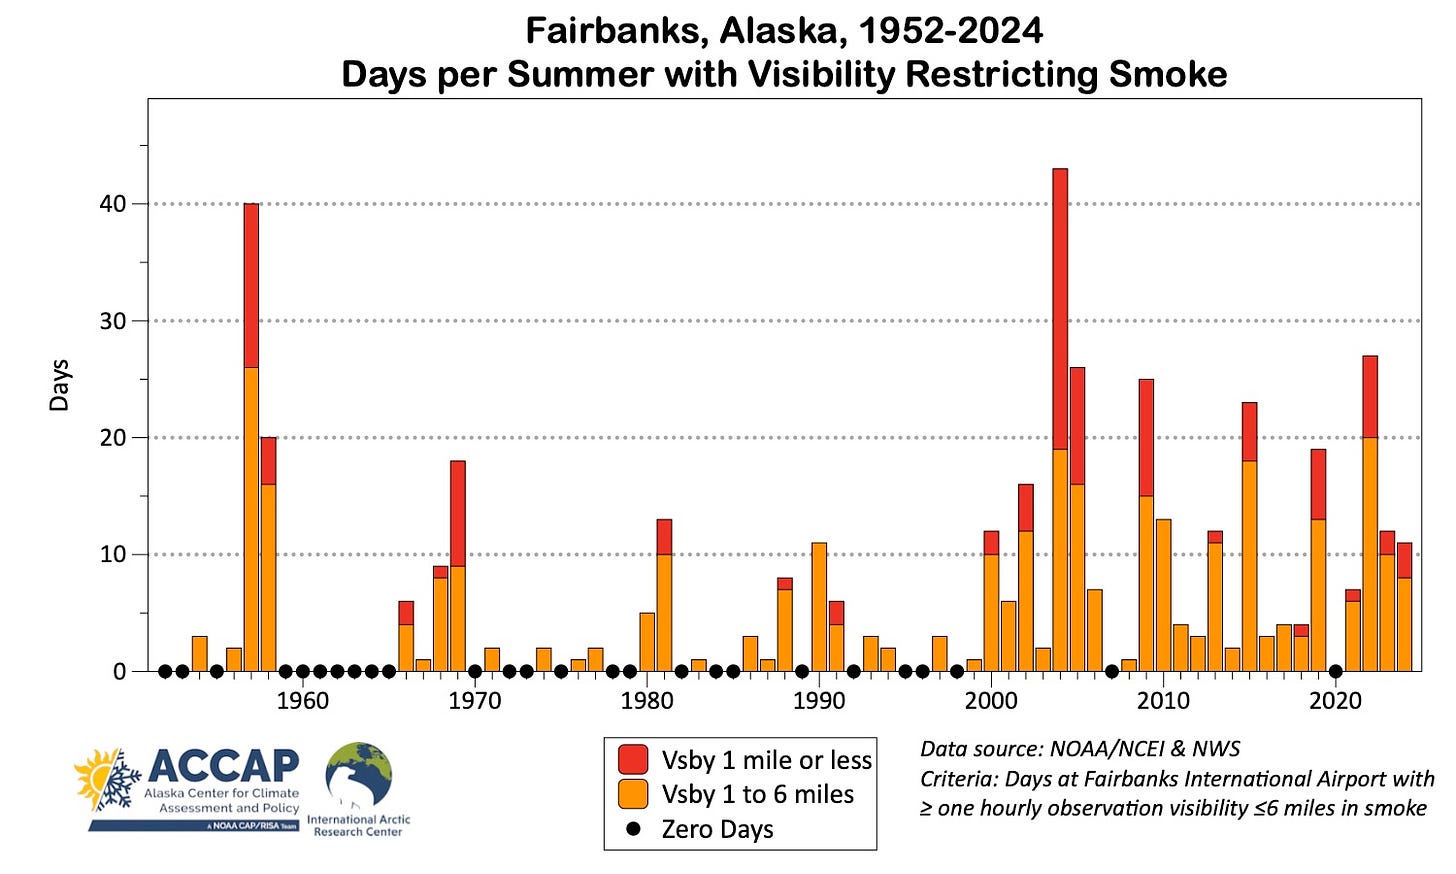
Figure 2 plots the number of days per summer since 1952 at Fairbanks Airport with smoke dense enough to reduce visibility to 6 miles (10km) or lower at some point during the day, with days with when the visibility dropped to 1 mile (1.6km) or less highlighted.1 The most striking feature of this graphic (and I use variations of this a lot) is that prior to 2000, it was not uncommon for there to be no smokey days at all during the summer, while since 2000 that has only happened twice. Also note that only one summer in the 49 years 1952 to 2003 (1957) had more than 20 days with visibility restricting smoke. In the 21 years since 2003, there have been five such summers.

Smoke is a problem not only because of outdoor air quality, but it also has impacts on indoor conditions. Many people want to keep the “wildfire smoke smell” out of their homes, but closing all the windows for any significant period of time brings back the “hot house” problem. Unlike air conditioning, some residences in Interior Alaska do have air filtration systems (air quality is also an issue in winter due to persistent temperature inversions), and modern homes that are built “supertight” to conserve heat in winter require some form of mechanical air exchange to keep indoor air fresh.
Summer Discomfort Index
Putting the two sources of Interior Alaska summer weather unpleasantness together, I came up with a regionally specific “summer discomfort index”. The goal was to generate a simple index to quantify the “uncomfortableness” of the summer. The result is shown in Fig. 3. This is simply the number of days with an average temperature above 65F plus the number of days with visibility restricting smoke, plus a “bonus” point for really warm days (average temperature 70F or higher) and really smoky days (visibility 1 mile or less). I’ve color-coded each year to indicate the relative importance of each factor. First off, most of the really unpleasant summers are a the result of a combination of heat and smoke.
You can also immediately see why people may start to cry when you mention summer 2004. It remains in a class of awfulness by itself. And given the trends in both warm days and smoke frequency, it’s no wonder that it feels like nowadays we have more uncomfortable weather than we did in the past, and as well look to the future, that maybe it’s time we add indoor cooling as an important design feature for residence.
Technical details
Daily average temperature data, filtered by specific thresholds can be readily extracted from e.g. scACIS or cli-MATE, both operated by NOAA’s contract Regional Climate Centers.
Smoke data extracted from surface aviation observations for Fairbanks International Airport. The digitization of written surface airways observations (pre-1985) is inconsistent and contains many errors. Therefore I examined scans of the paper forms in constructing the data used in Fig. 2.
Smoke as a restriction to visibility in airways observations has not been impacted by the automation of observations that occurred in 1998, as smoke is not part of the automated observation suite of possible reasons for reduced visibility: in the absence of precipitation occurring, the obstruction is either “mist”, “fog” or “haze”, which is assigned algorithmically based on the visibility and dew point depression. Any observation of smoke requires a human observer to augment that into the observations, so smoke as the obstruction to visibility is determined the same way today as it was in 1952.


https://substack.com/home/post/p-147142550
Note the x-axis mislabeling of 2000 as 2020
Colder climate before 1970, less smoke, maybe less fires or lightning strikes ?