


Autumn Snow Trends in the Arctic
More complex than you might guess

Snow is an important component of the Arctic environment and serves as a major climate control. Five to nine months of precipitation build up in the snow pack that then melts and run off in a few weeks in the Spring. The presence of even a thin snow cover on sea ice or land allows for much lower surface temperatures than would otherwise occur. While the presence or absence of snow cover is comparatively easy to estimate from satellites, the amount of snow that falls is a much different parameter. In-situ measurements of the melted water content of snow are standard part of climate observations, there is no systematic reporting of the water equivalent of rain vs. snow. So when investigating multi-decade trends of snowfall, we rely on climate reanalysis, though we are confident that the partitioning of precipitation type into frozen vs. liquid is at times problematic.
As a reminder, snowfall in ERA5 reanalysis is the liquid equivalent of frozen precipitation at ground level, and so not the same as what you shovel away, which is typically the solid accumulation of snow.
If you’re looking for more of an Alaska focus on autumn snow changes, I wrote about that in October 2023 and you can read the post here.
Autumn Snowfall
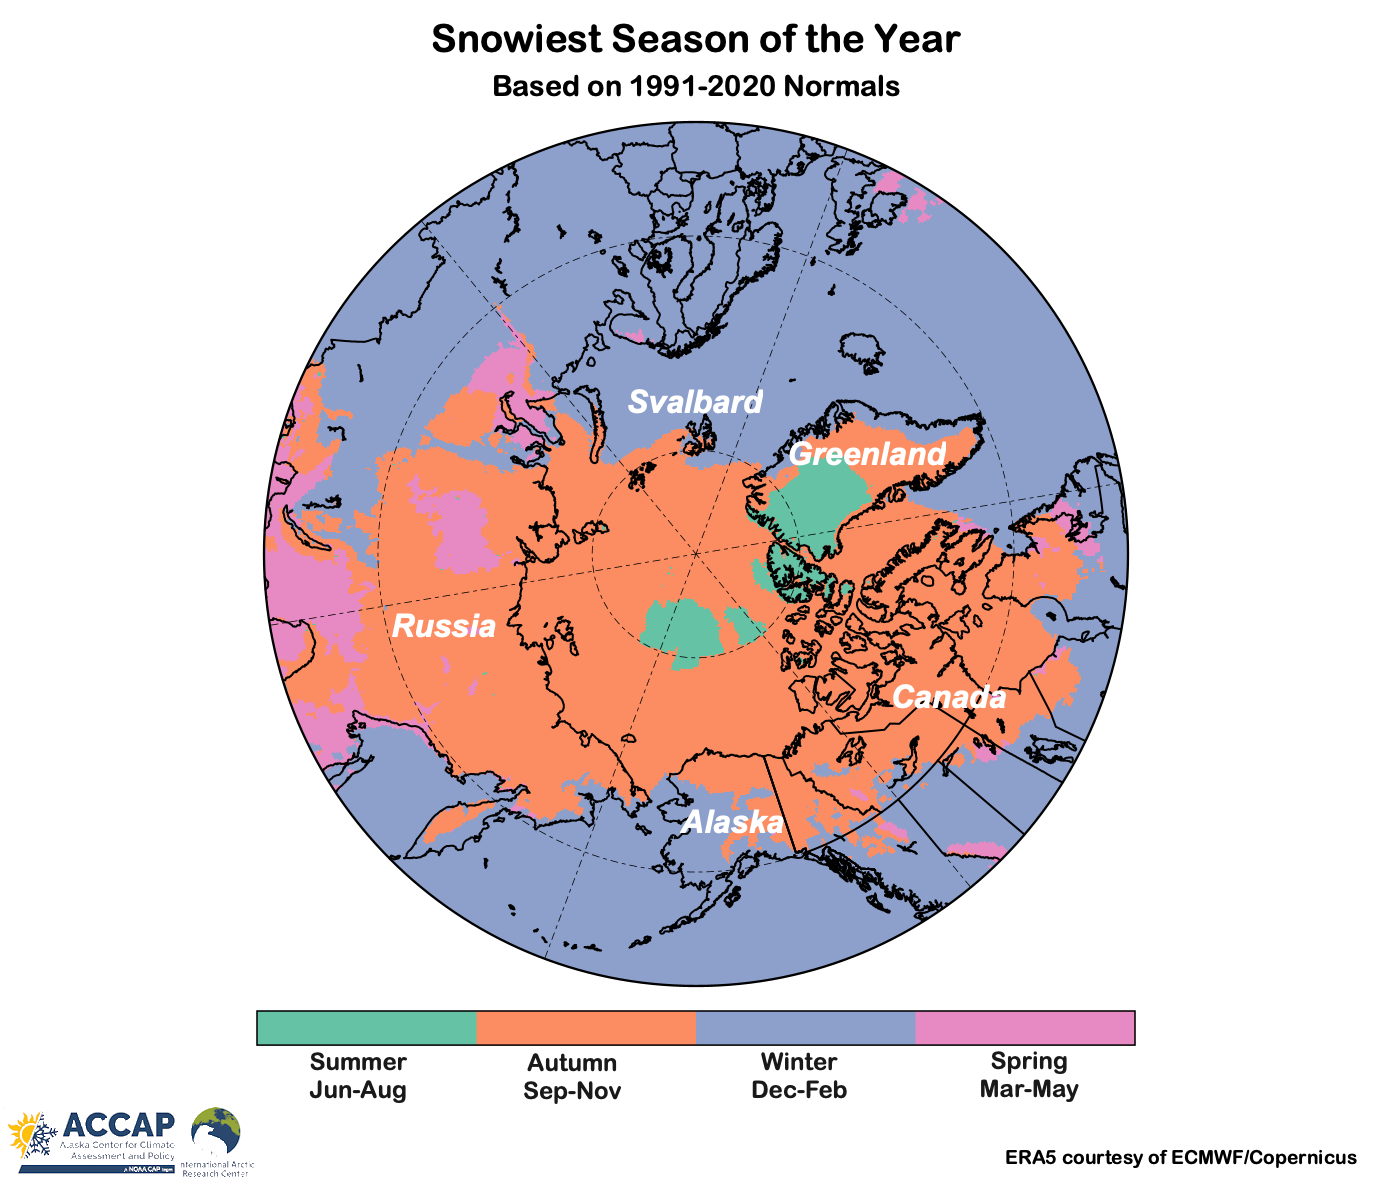
September through November typically has the highest snow of the four (canonical) seasons over most Arctic (Fig. 1), and for most non-glaciated land areas it’s the season when the cold season snow pack is typically established.
Typical autumn snowfall (like precipitation) varies greatly in the Arctic (Fig. 2), with leeward mountain areas adjacent to oceans receiving 5 to 50 times as much snow as the vast “polar desert” of northern Greenland and much of the Asian and northwest North American side of the Arctic Ocean.

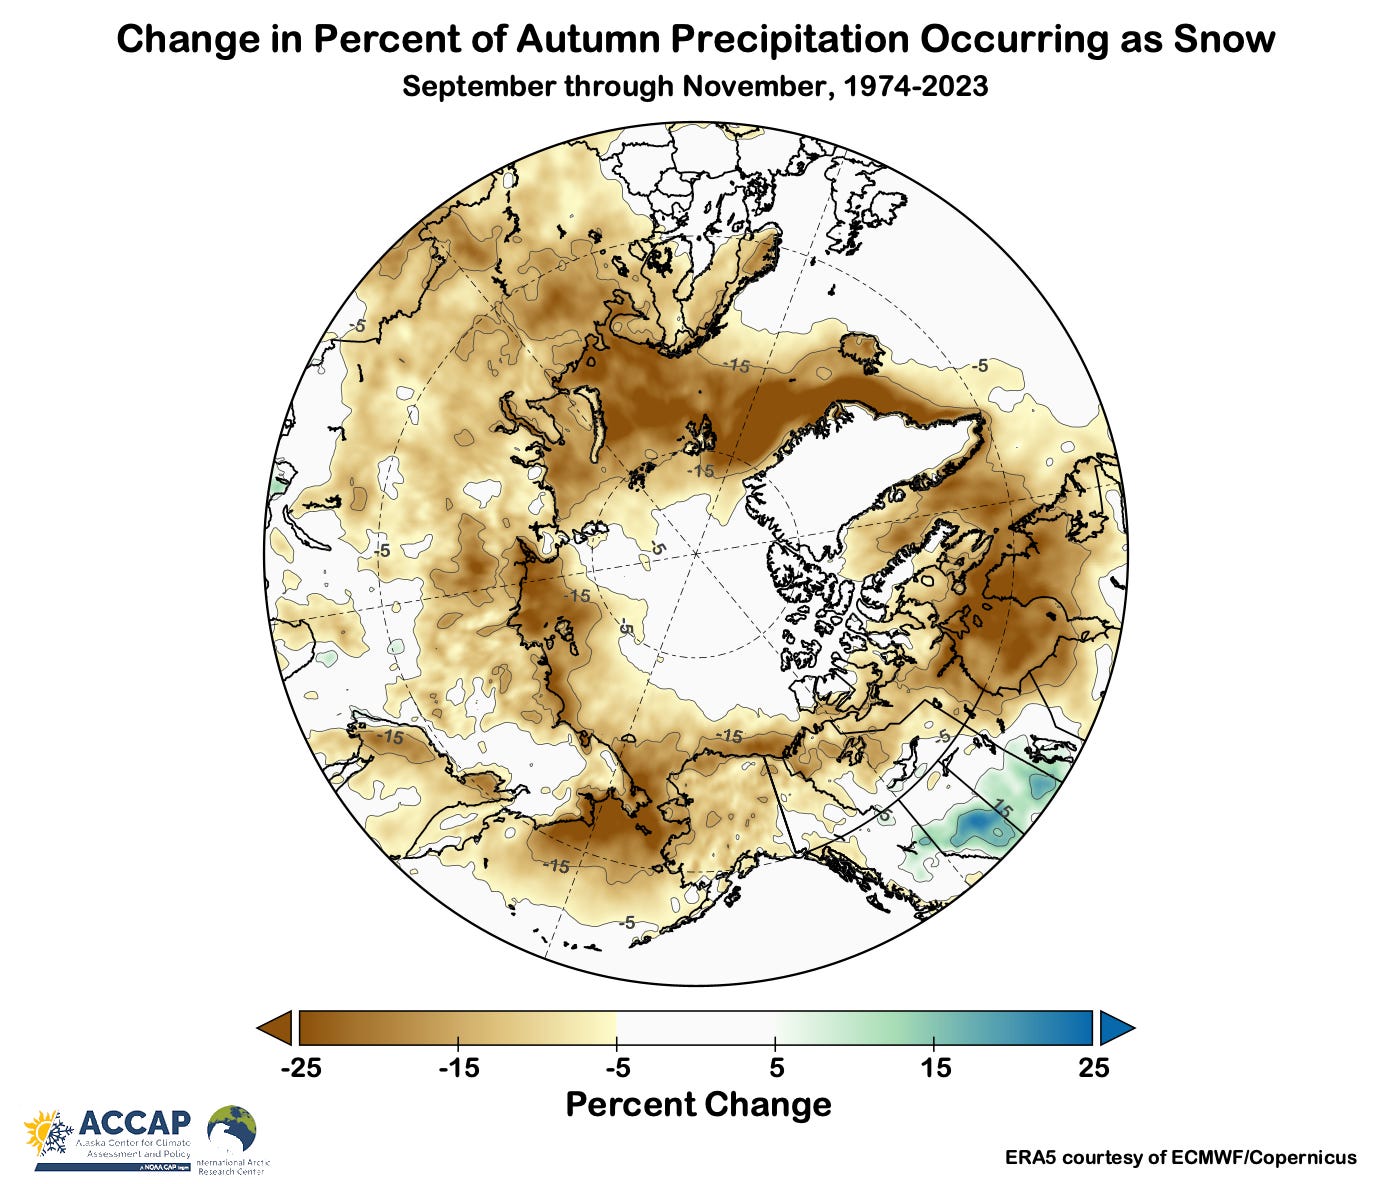
That big range is important to keep in mind when interpreting Fig. 3, which shows the percent change of autumn snowfall over the past 50 years. Areas with very low average snow can have a significant percentage increase or decrease even though in absolute terms the change is not large, and vice versa in high snow regions.
Figure 3 shows both latitudinal and regional coherence in what at first glance looks like a rather chaotic trend pattern. Nearly everywhere north of 80°N has seen an increase in autumn snowfall since the mid-1970s, and except for the North Atlantic sector, snowfall in most areas between 70 to 80°N has also increased. In contrast, most ocean areas south of 70°N have seen a decrease in autumn snow. The situation on land is more complex. Virtually all of the European Arctic has seen a decrease in snow, as have parts of Alaska and Canada, but much of the Greenland Ice Sheet and the central and eastern Russian Arctic have seen a trend toward more autumn snow.

When considering the absolute snowfall amounts, for the Arctic as a whole (land and sea poleward of 60°N), autumn snowfall has decreased about 4 percent in the past 50 years. That’s not a lot but the trend is robust. On the other hand, for Arctic land areas, the significant regional difference in the trend largely even out, so there is no significant change overall.
Changing Snow vs. Rain Precipitation Type in the Autumn
Here in Alaska, a significant issue is that more of the autumn precipitation is falling as rain instead of snow. This is a separate issue from whether snowfall is decreasing, which could be the result of simply less precipitation falling from the sky. One way to account for this possibility is to examine how (if at all) the fraction of autumn precipitation that falls as snow is changing, and I show this in Fig. 5.1
Over the high Arctic and the Greenland Ice Sheet, there’s no significant change because nearly all autumn precipitation was and still is falling as snow. Similarly over the North Atlantic and Gulf of Alaska, there’s no change because nearly all autumn precipitation was and still does fall as rain. In between, nearly all Arctic areas show a decrease in the fraction of autumn precipitation that is falling as snow nowadays compared to 50 years ago.
Technical Details
As usual in this newsletter, Arctic means “poleward of 60°N” unless otherwise specified.
ERA5 monthly snow data available here.
Code by B. Brettschneider/NWS Alaska Region allowing rapid ERA5 regional analysis is invaluable for my work.
Because this is a ratio (snowfall divided by total precipitation), the correct regression tool to use for the analysis shown in Fig. 5 is beta regression modified to allow for absolute 0 and 1 values. However, I don’t have that tool in my toolbox for gridded data, so what’s shown is the change via ordinary least squares (OLS) regression. I have spot checked this against beta regression for several different areas in the Arctic, and the OLS shows similar (not identical) changes compared to modified beta regression.
Well that is complex and I had to put on my analyst hat to get the big picture which is (I think) that despite regional disparities, the overall trend lines are toward slow warming. Of course 50 years is a geologically short timeline, but the amount of energy in joules to warm up that fraction of the planet to that degree for even a fraction of that time for that delta is simply enormous.