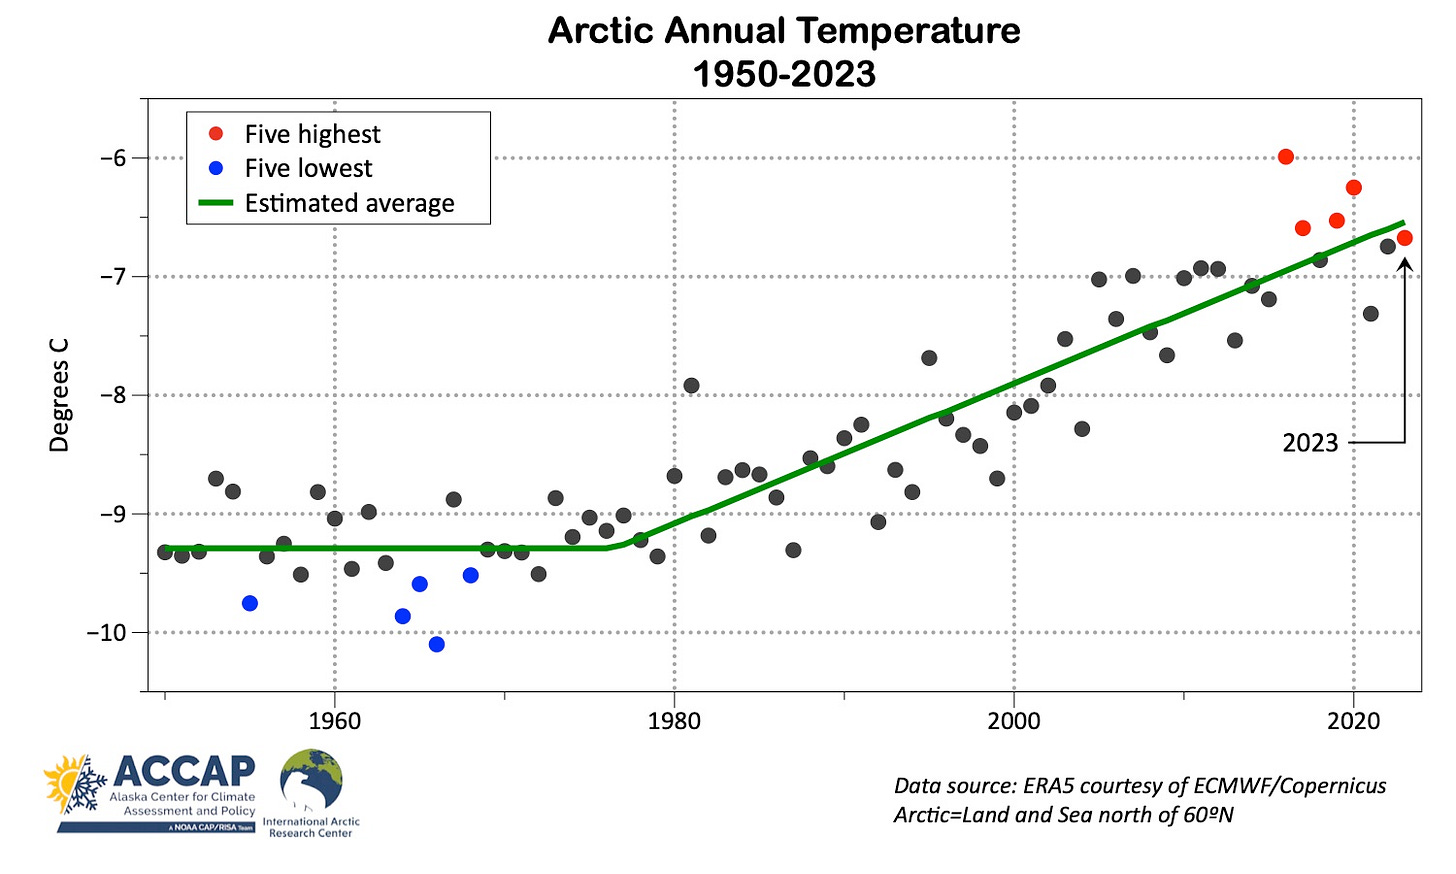
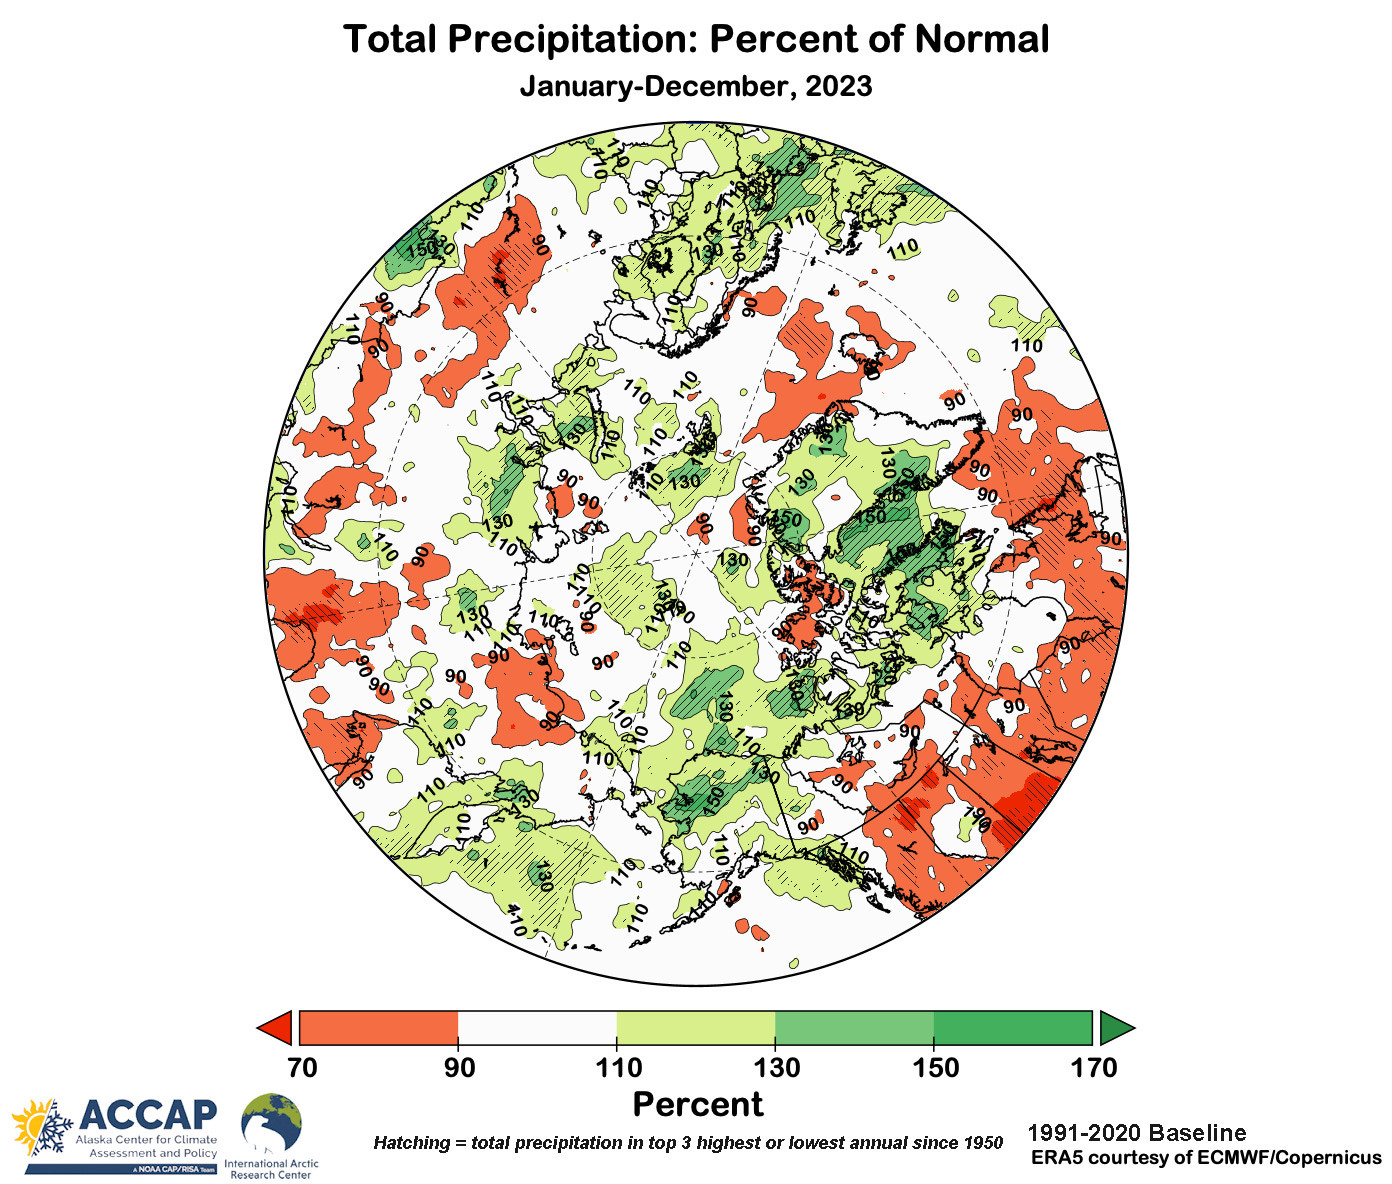
The Arctic in 2023 continued along the path to a warmer and wetter climate. The annual average temperature was 0.83C (1.5F) above the 1991-2020 baseline normal, while annual Arctic-wide total precipitation was about 4 percent above normal.
Temperatures
Nearly everywhere in the Arctic saw near to above normal temperatures for 2023. From a glance at Fig. 1, it’s clear the most outstanding warmth was in northern Canada and in far northwest Siberia. The Northwest Territories, Canada had by far the highest annual temperature on record, exceeding the previous warmest year of 2010 by more than 1°C. In contrast, only a few small areas in Iceland, Scandinavia and on Bering Sea coasts of Alaska and Russia were even as much as 0.5C cooler than the 1991-2020 average.

While I have no way to systematically monitor (near) Arctic in-situ daily temperature extremes, it’s worth noting here a few that I am aware of. As reported in the 2023 Arctic Report Card, Summit station on the Greenland Ice Sheet (3204 meters MSL) reported a temperature of +0.4C (33F) on June 26th, only the fifth time in past 34 years when the temperature has risen above freezing. On July 8th the temperature peaked at 37.9C (100F) at Norman Wells, NWT (65.3°N) and 37.4C (99F) at Fort Good Hope, NWT (66.2°N). These are the highest temperatures ever recorded so far north in Canada (more details on this event in my post here). On the flip side, Tongulah, in the Sakha Republic, Russia, about 275km west of Yakutsk, appears to take honors as reporting the lowest Arctic temperature in 2023, with a daily minimum of -62.7C (-80.9F) on January 18th.

The Arctic annual average temperature time series since 1950 (Fig. 2) is a familiar one: the long-term warming trend started in the late 1970s even as the usual year-to-year variability continues. 2023 had the fifth highest average temperature for the Arctic as a whole, with all the mildest years since 2016.
Precipitation
Total Arctic-wide precipitation (melted snow plus rain) in 2023 was above the 1991-2020 baseline average, ranking as the fifth highest of since 1950. For Alaska (including the 17 percent of the state that is south of 60°N), this was the wettest year, and Nunavut, Canada saw the second wettest year.

Snow
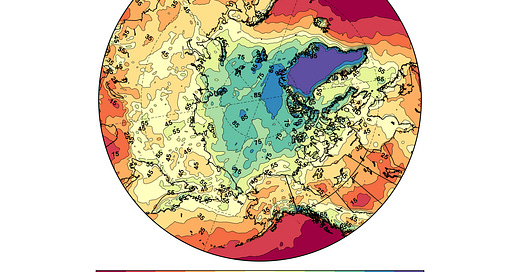
Fig. 4 shows the percentage of the 2023 total precipitation that fell as snow (at least in the ERA5 reanalysis). For areas north of 60°N, this varied from less than 5 percent near the southern edge of the Atlantic sector, e.g. Shetland, to more than 95 percent over most of the Greenland Ice Sheet.

The implications of an Arctic with more rain and less snow have been discussed in a number of papers, with a “rain-dominated Arctic” now a regular part of the climate change discussion.1 Figure 5 shows the difference in the 2023 percent of precipitation falling as snow relative to the 1991-2020 average. Except for a small portion of the Canadian Arctic Islands, everywhere north of 70°N saw less of the 2023 precipitation fall as snow than usual. That is, rain accounted for more of the annual precipitation than average. This difference was substantial in a few areas, e.g. the Beaufort Sea just north of Alaska. South of 70°N it was much more of a mixed bag, with snow accounting for more of the annual precipitation than usual in parts of Alaska and especially in central Siberia, but much less than usual in portions of Canada west of Hudson Bay and northwest Siberia.

The discussion was jump started by Bintanja, R., & Andry, O. (2017). Towards a rain-dominated Arctic. Nature Climate Change, 7(4), 263-267.


