


Summer Sea Surface Temperature Trends
The Alaska and Arctic Perspective

Global sea surface temperatures (SSTs) have been at “off the charts” record high levels for more than a year now, e.g. here, and there’s been a lot of press, e.g. here, about extremely warm ocean temperatures in the sub-tropical north Atlantic basin that are primed to supercharge the 2024 hurricane season. However, sea surface temperatures in the Arctic (and Antarctic) don’t tend to get much attention, and are sometimes even excluded from “global” sea surface temperatures, e.g. the popular Climate Reanalyzer sea surface temperatures daily tracker. Seas poleward of 60°N/S account for just over ten percent of the global ocean surface area, so it’s not an insignificant area. Most of the ocean areas in the Arctic are subject to seasonal or permanent sea ice coverage, with the Norwegian Sea as the primary exception.
In this post I explore summer trends in SSTs in the Arctic and in the seas around Alaska using the high resolution NOAA Optimum Interpolation Sea Surface temperature data set. This is a blend of in situ observations and satellite imagery, though in most of the Arctic there are very few actual observations of sea surface temperature even in summer, so this is effectively satellite derived SSTs.
Sea surface temperature in a climate context almost always means the liquid water temperature, and handling SSTs when the sea surface is partly or completely ice covered varies across data sets. For climate purposes, the lower limit of sea surface temperatures is -1.8°C (28.8°F): salt water at normal atmospheric pressures as a lower freezing point than fresh water, but partially or even fully ice covered areas may or may not be assigned a temperature quite that low. It’s typically only a couple of tenths of a degree and is of little practical consequence except for multi-decade trend analysis.
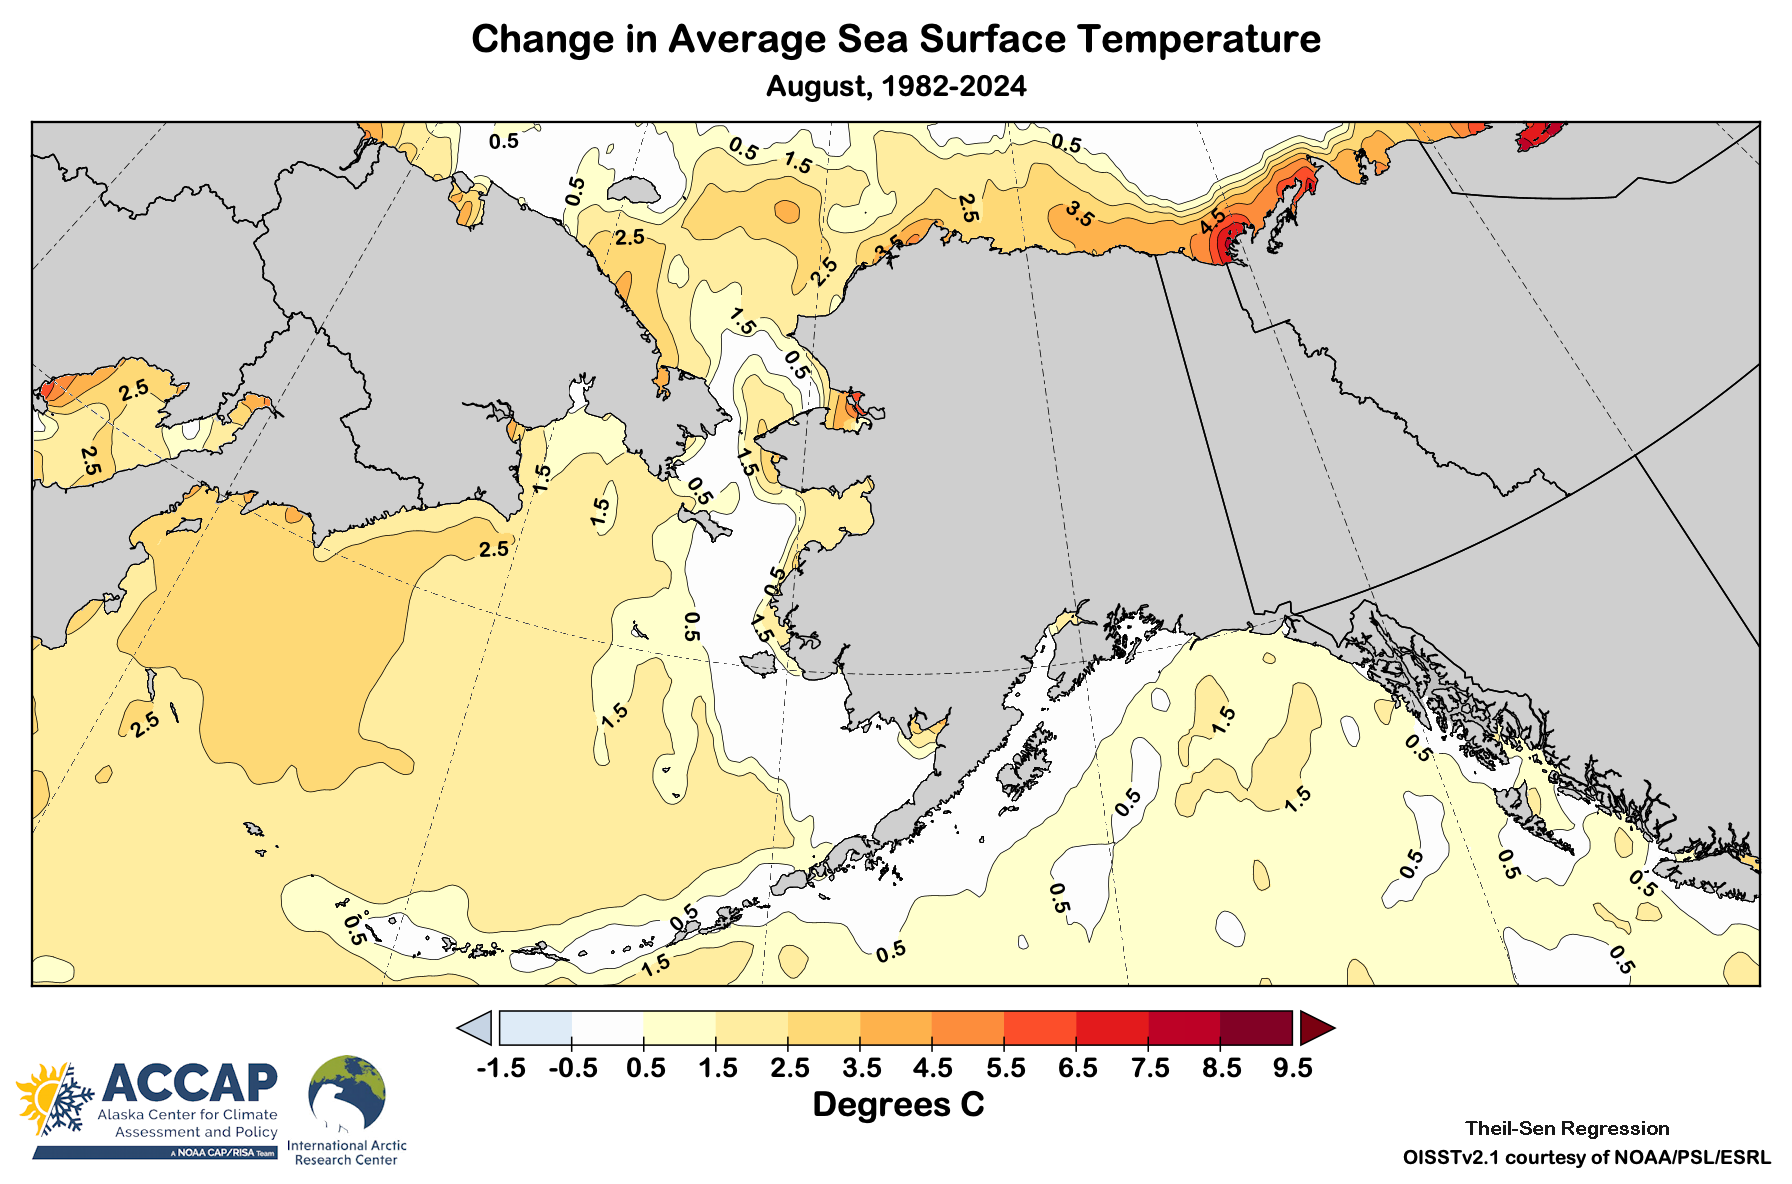
Arctic
Sea surface temperatures changes around the Arctic in August since the early 1980s are shown in Fig. 1. August is typically chosen as the best month to show Arctic summer SSTs as cooling from decreasing solar heating has not yet started and sea ice extent is most of the way to the annual minimum.1 North of 67°N, trends are upward virtually everywhere that isn’t still sea ice impacted in August in recent years. The most dramatic changes have occurred in Kara and Laptev Seas, but still quite substantial warming has occurred in Baffin Bay and near-coastal Beaufort Sea.

The few areas of apparent cooling (within Canadian Arctic Archipelago, northeast Greenland Seas) are very likely an artifact of this data set and how sea surface temperatures are handled in the presence of sea ice. In reality, SSTs in these areas very likely have no significant trend.
For another presentation of pan-Arctic summer sea surface trends see the 2023 Arctic Report Card Sea Surface temperature essay, here.
Alaska
The progression of warming through the summer is interesting because it highlights the local to regional-scale importance of sea ice, currents, river discharge and solar warming. During most of the cold season, the upper ocean waters around Alaska in non-ice covered tend to be well mixed due to frequent storminess and so there’s generally only limited year-to-year variability in sea surface temperatures. It’s a different story in summer, when storms are less frequent and solar heating peaks.
In June (Fig. 2), the largest changes have been along the Alaska coast south of the Bering Strait, where the ocean is shallow, ice now goes out in May and where there is significant discharge from big Yukon and Kuskokwim rivers. The western Bering Sea is different. While the maximum warming has been in protected bays in shallow water, there has been significant warming over the deep water as well, much more so than, say, the deep waters of the Gulf of Alaska.

In July (Fig. 3) more of the region shows warming SSTs. The extreme warming in Kotzebue Sound is mostly the result of the earlier loss of sea ice in recent years in this very shallow basin (in much of Kotzebue Sound the water is less than 10 meters deep). Warming north of the Bering Strait most reflects the earlier loss of seas ice but Mackenzie River influence shows up in the delta and westward to the northeast Alaska coast. The area with no significant change between Pt. Barrow and the Prudhoe Bay area reflects the later persistence of sea ice in this area. The slot in the eastern Bering Sea with no significant change roughly follows the path of the summer Alaska coastal current, and so likely reflects both additional mixing and some upwelling to the east of the continental shelf break.

In August (Fig. 4) the focus of the SST warming has shifted to north of the Bering Strait and with the Mackenzie river outflow maximum is still apparent. All of the Beaufort Sea coastal waters show warming, as does the western Chukchi coastal waters north of the Russian coast.
Technical Details
As usual in this newsletter, Arctic means “poleward of 60°N” unless otherwise specified.
Sea surface temperatures from the OISSTv2.1 data base available from NOAA here.
In the first 23 years of the 21st century, Arctic sea ice extent declined an average 7 percent between the end of August and the seasonal minimum in September.
Very interesting Rick. Thank You ! Would anyone at Fairbanks know what happened to the spreadsheet we maintained at the Barrow Office of SST's we measured ? I'm sure it went to someone at Fairbanks WFO, not sure who. Years of daily readings when nearshore waters were not ice covered. All the time & effort in obtaining that data, probably lost forever. What a shame. The NWS doesn't seem to care about much of the work done in Barrow out of the Office there. The work you do puts satellites in the best light, that's for sure. Sometimes, however, I wish satellites never existed, really !
Rick, what do you speculate would be the Arctic SST trend if we ran predictive models with the Eurasian and North American landmasses replaced by open water? Who is warming up faster- 60° N. or 60° S. waters?