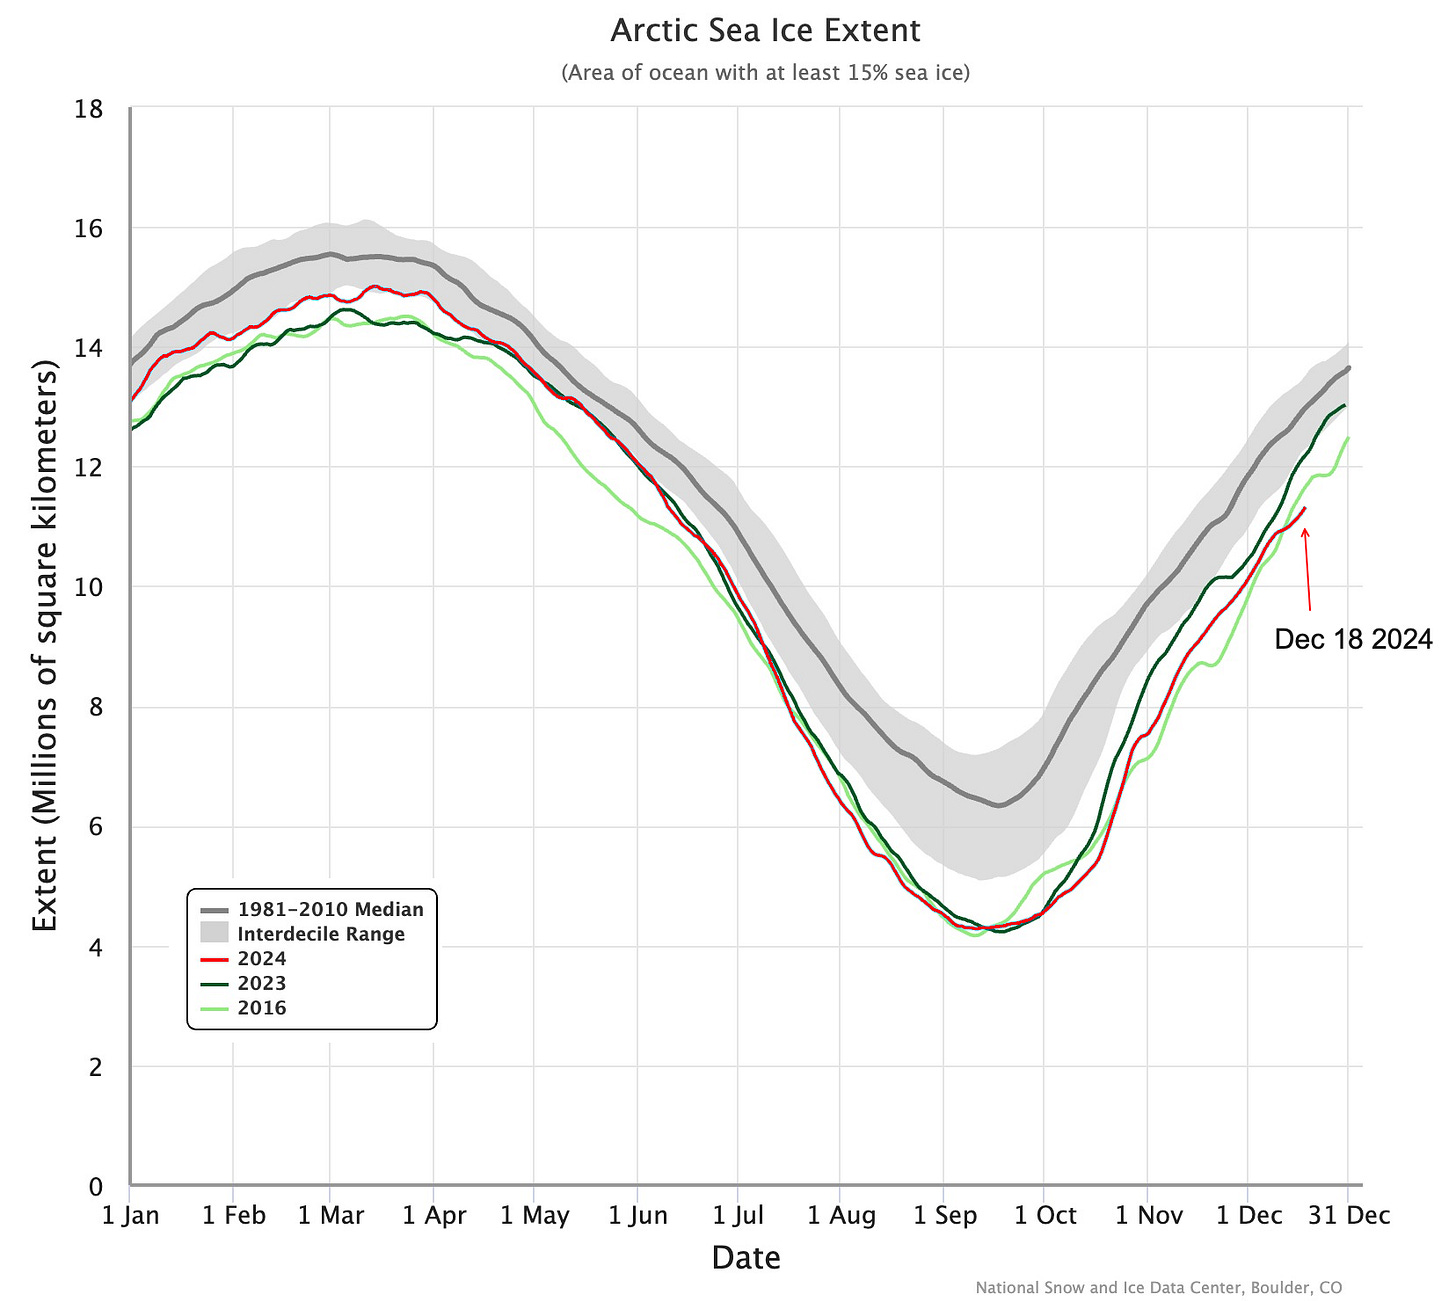
Sea ice extent for the Arctic overall as of mid-December is at the lowest for this point in the season in the entire satellite era record (since autumn 1978) in both the National Snow and Ice Data Center (NSIDC) and Japan Aerospace Exploration Agency (JAXA) analyses. Whether this is a transient low extent or not, expanded open water now, with the winter solstice upon us, means that there’s less time for ice, once it forms, to thicken up before the spring melt commences in a few months.
The NSIDC daily extent is shown in Fig. 1. I’ve plotted this year, last year (2023), and 2016, which for most of December is, or now was, the lowest daily pan-Arctic ice extent. This year is now the lowest extent since December 12th (though the 18th as of this writing). Another way to look at this: current extent would be typical about two weeks early in the season (relative to the 1991-2020 median).

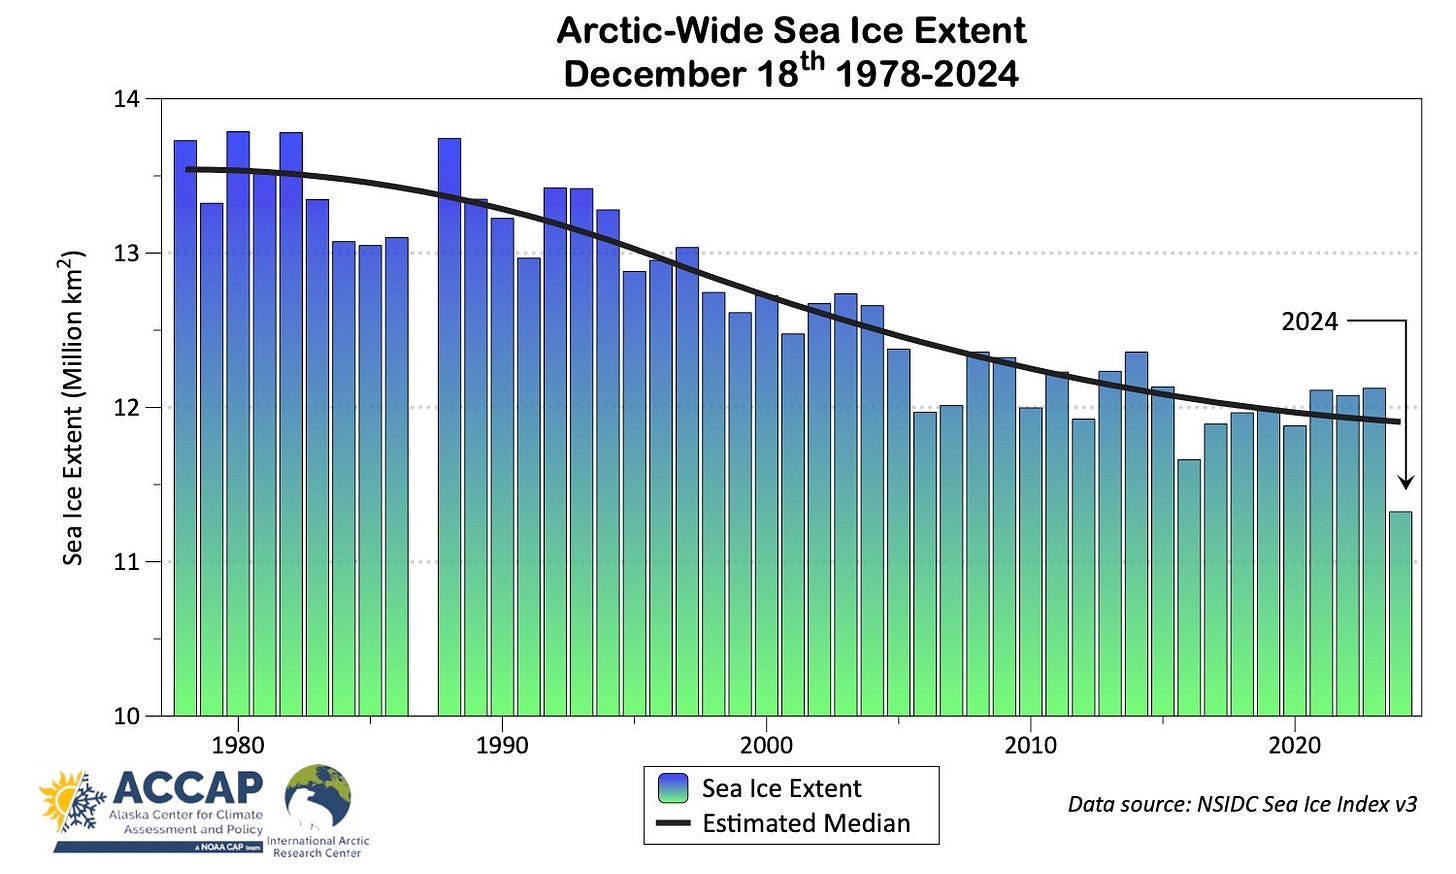
Figure 2 plots the December 18th sea ice extent each year since 1978.1 The modeled median shows about a 12 percent decrease in typical extent between the late 1970s and nowadays.

Arctic sea ice extent increase since early October has been slower than usual, fueled in part by more southerly winds than usual during the past month over Hudson Bay and especially the Barents Sea. Figure 3 shows the AMSR2 sea ice concentration for December 18. There is only a little ice in the northeast Barents Sea (7th lowest extent for the date), with open water surrounding Svalbard. The Sea of Okhotsk (2nd lowest) also has very little ice, and much of eastern Hudson Bay (lowest extent) remains open. Sea ice extent is also below normal in the Bering Sea (5th lowest), especially in Russian waters.
Modeled sea ice thickness for December 18th from the Danish Meteorological Institute (DMI) is shown in Fig. 4. As usual these days, the only remaining thick, multi-year ice is immediately to the north of Greenland and the northern Canadian Arctic Islands. An interesting regional detail in the ice thickness pattern is in the northeast Beaufort Sea, where some thicker ice has moved southwestward to the west side of Banks Island in the clockwise circulating Beaufort Gyre and is now starting to move westward, north of the Alaska coast. Having 2 meter or more thick ice at least a little south of 75°N this early in the winter is potentially a good sign for next summer holding on to ice longer in at least the northern Beaufort and Chukchi Seas.
Technical details and underlying data sources
The NSIDC Sea Ice Index is based on the comparatively low resolution passive microwave data (nominal 25km² by 25km² but in practice is not that good) and given as the 5-day trailing average, so slightly lags changes in sea ice. At regional to Arctic-wide spatial scales this is usually not significant. Details on the Sea Ice Index are here.
AMSR2 microwave data is from the Advanced Microwave Scanning Radiometer 2 on JAXA's Global Climate Observation Mission - Water 1 (GCOM-W1) satellite at 10km² by 10km² horizontal resolution. The University of Bremen AMSR2 landing page with links to near real-time data in a variety of formats is here.
Modeled sea ice thickness and volume from the Danish Meteorological Institute is available here.
Sea ice extent data was lost from early Dec 1987 to early Jan 1988 due to satellite problems. Based on the extent before and after the outage and the prevailing weather patterns around the Arctic, there’s no reason to think the extent on December 18, 1987 was outside of typical 1980s extent.


How long before one can paddle a canoe directly between Alaska and the western Siberian coast I wonder?