


Recent Arctic Temperature Variability
Driven by large variations in the greater Bering Strait region

2023 was the warmest calendar year in many centuries for planet Earth, and the 12 months ending April 2024 are the warmest consecutive 12 months. It’s a bit different in the Arctic, where the warmest year was 2016 and the warmest consecutive 12 months was (coincidentally) January through December 2016.
I recently posted the graphic in Fig. 1 on my Mastodon account (@AlaskaWx@alaskan.social). This shows the Arctic (land and sea poleward of 60°N) running 12-month average temperature as a departure from the 1951-80 average from ERA5 since 19401. In an attempt to show short term variability and long term trend, I’ve added the two and 20-year smoothed average.

In a reply to the Mastodon post, a person speculated about the dip in Arctic temperatures over the past few years, which I’ve added a box to highlight.
2016 to 2019 heat
Starting with the peak in the 2016-2019 period, Fig. 2 shows the difference in the annual average temperature 2016-2019 from the preceding four years. A couple of features stand out. Most obviously, far northeast Russia eastward across mainland Alaska and the Yukon Territory (roughly, Pleistocene “Beringia”, hereafter the “greater Bering Strait region”) was the epicenter of warming relative to the previous four years, with another maximum over the northeast Canadian Arctic and northern Greenland. Less obvious but also notable is that almost nowhere north of 60°N was cooler in the 2016-2019 period than in the preceding four years.
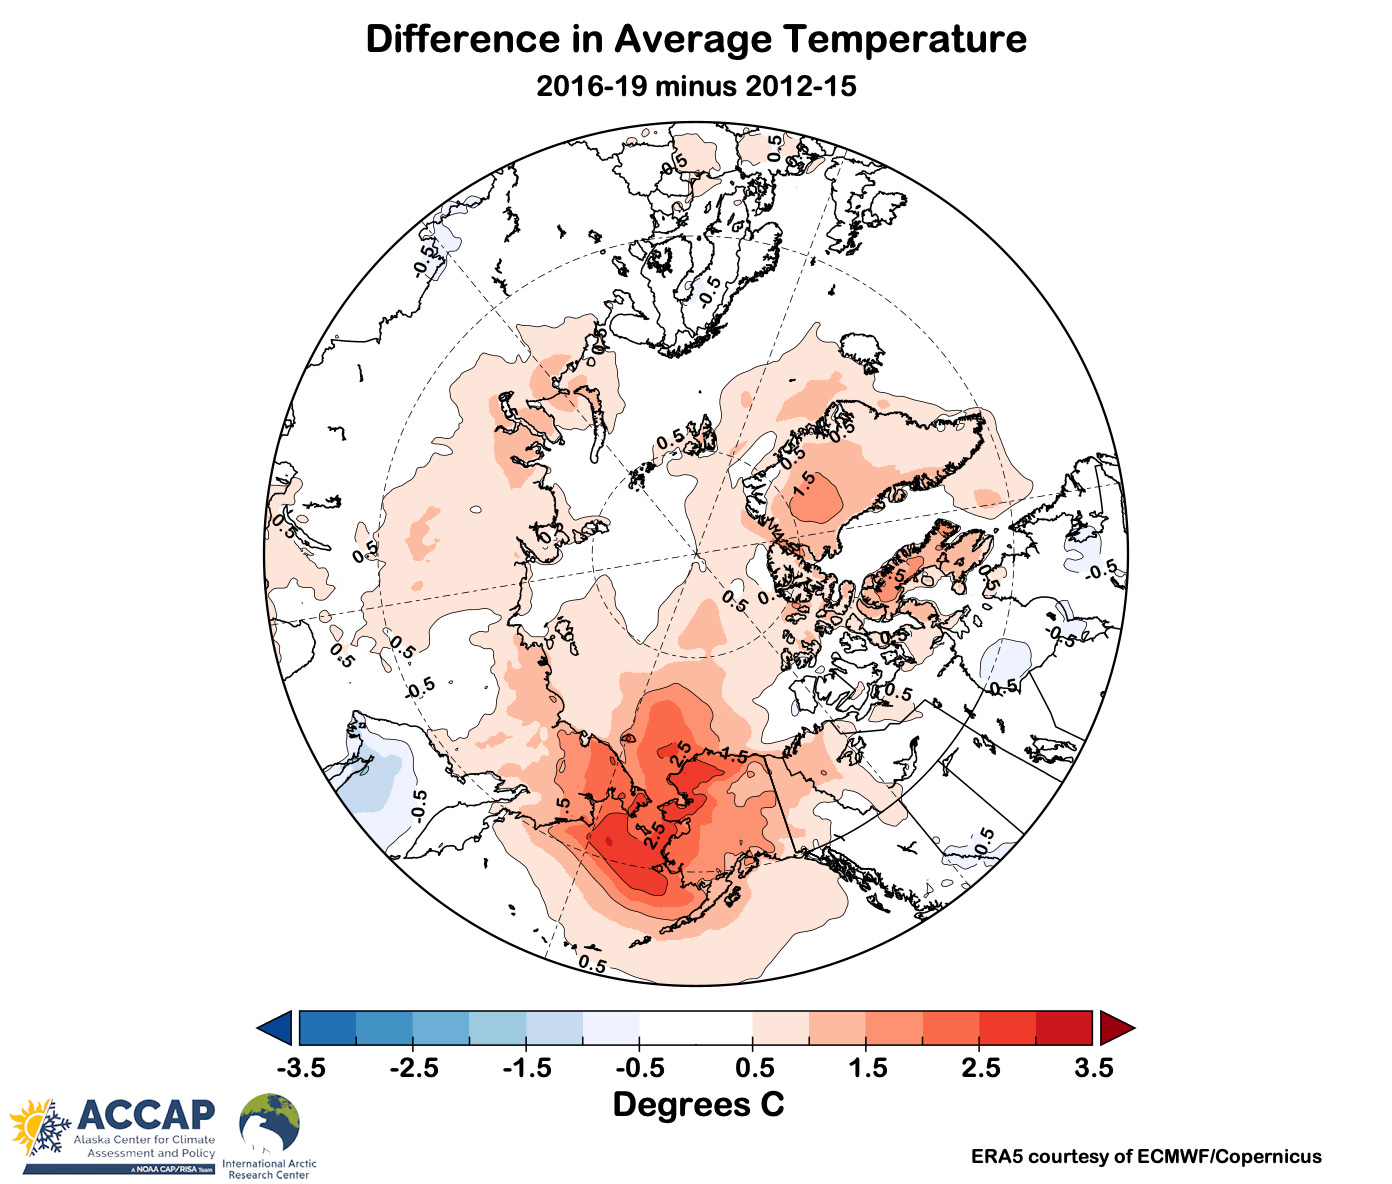
The obvious question is why? As always, there’s no one answer, but this warm period followed the northeast Pacific marine heatwave of 2013-15, which spread into the Bering Sea in 2016 (see Walsh et. al. 2018 for details and impacts around Alaska). The warm period included the Bering Sea “sea ice collapse” of 2018 and 2019 (see Thoman et. al 2020 for details and attribution of the 2018 sea ice collapse), which was both an effect and cause of elevated temperatures in this region.
What’s happened since 2019?
Figure 3 shows the change since the 2016-2019 warm period. The Svalbard and Greenland Sea region has been somewhat cooler, but nowhere near as much as in the greater Bering Strait region. However, not all of the 2016-2019 hot spots have cooled: both northeast Canada and the Greenland ice sheet average temperatures 2020-2023 are close to the 2016-2019 levels, and northwest Siberia warmed through both four year periods.

Late winter and spring sea ice in the Bering Sea has been more “normal” since 2020, and 2021 was the highest Chukchi Sea summer sea ice extent since 2006. However, major differences aloft are also evident. Figure 4 shows the difference in the average 500 hPa heights 2020-2023 from the 2016-2019 average (think of 500 hPa heights as showing middle atmosphere high and low pressure). By far the largest difference in the four year averages in the Arctic is again in the greater Bering Strait region.2

Of course, surface air temperatures and mid-atmospheric heights are correlated, with cause and effect going both directions. What this illustrates is that the lower temperatures 2020-2023 are not simply the result of changes in ocean characteristics but variability through the lower and middle atmosphere have contributed to the different timing of extreme warmth in the Arctic relative to the globe.
Technical details:
Unless otherwise specified, “Arctic” refers to land and oceans poleward of 60°N.
Temperature and precipitation analysis spatial maps and time series from ERA5 reanalysis data from ECMWF/Copernicus, available here.
Code by B. Brettschneider/NWS Alaska Region allowing rapid ERA5 regional analysis is invaluable for my work.
The NCEP/NCAR reanalysis is available here and remains a useful tool for large scale free atmosphere evaluation.
12-month running average is the average February through January, March through February, April through March, etc and so always removes the seasonal signal. The calendar year average is of course just January through December 12-month mean.
The difference in mean 500 hPa heights between these two periods in the greater Bering Strait region is more than two standard deviations from the mean difference between independent four-year periods since 1948, even accounting for trend.