


October 2024 Arctic Climate Summary
Warm and wet

The Arctic in October was overall, to no one’s surprise, much warmer than whatever definition of normal you care to use. Figure 1 shows the departures from the 1991-2020 baseline based on the ERA5 reanalysis. The mildest conditions were in northern and northeast Canada and in the Barents Sea area. For Nunavut, Canada, this was the second warmest October (only 2021 was milder). In contrast, Iceland had the coolest October since 2008 and the August through October early autumn season was the coolest there since 1983. Parts of the Greenland Ice Sheet and some areas in central Siberia were also notably colder than the 1991-2020 average in October.

The October average temperature time series is shown in Fig. 2. October 2024 was the third warmest since 1950, and eight of the nine mildest Octobers have occurred since 2016.1
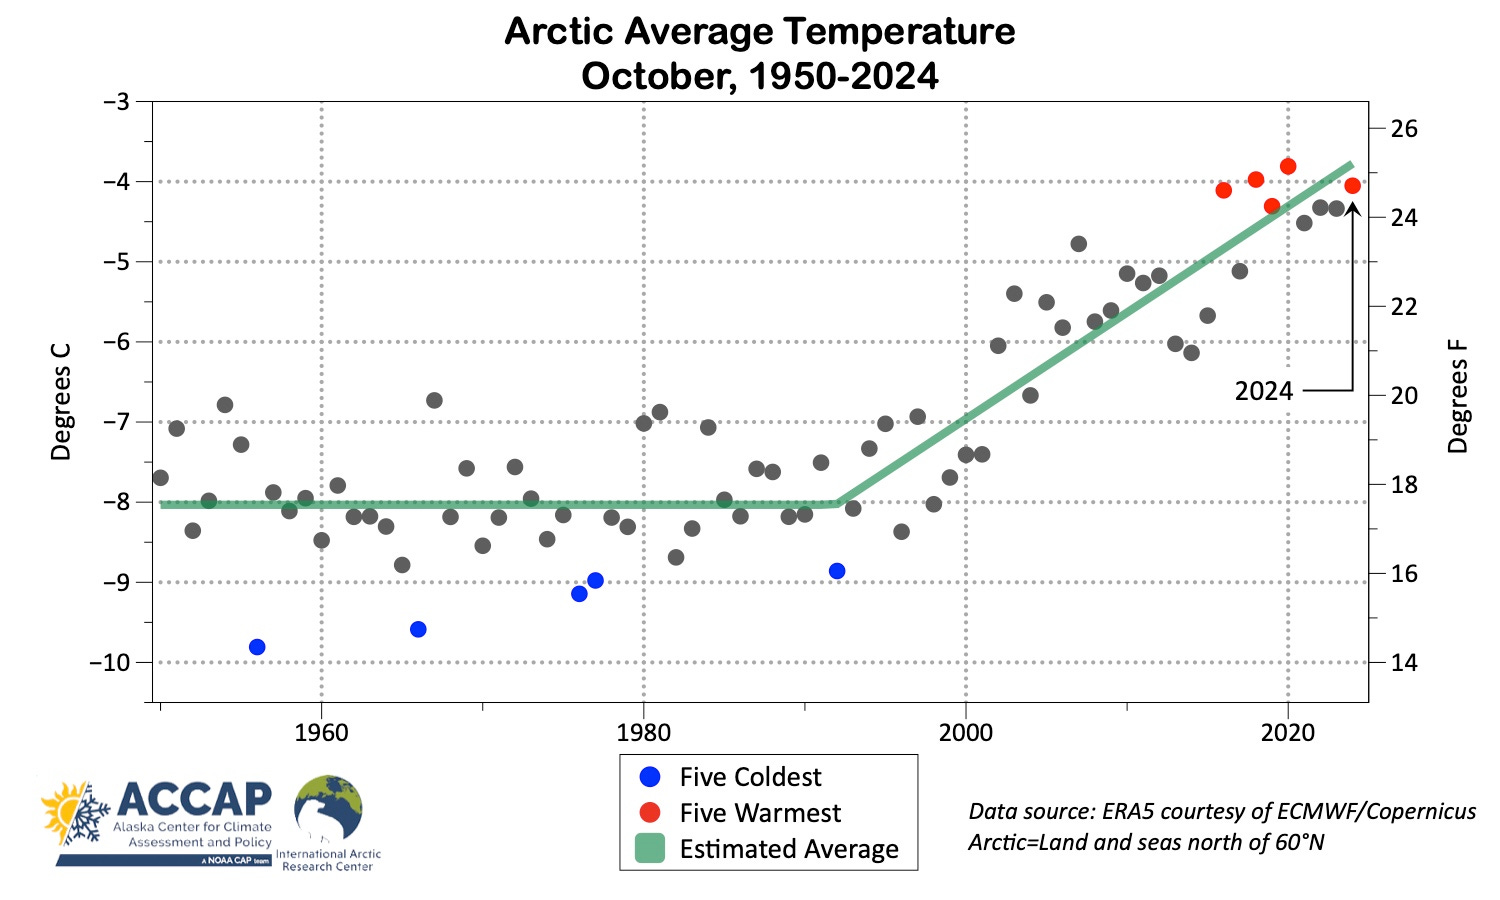
Restricting the analysis to land areas north of 60°N, this was “merely” the seventh warmest October, which doesn’t sound so extreme until I tell you that this October was warmer than any October prior to 2018. That is, the seven warmest Octobers since 1950 (and surely long before that) are the last seven years.2
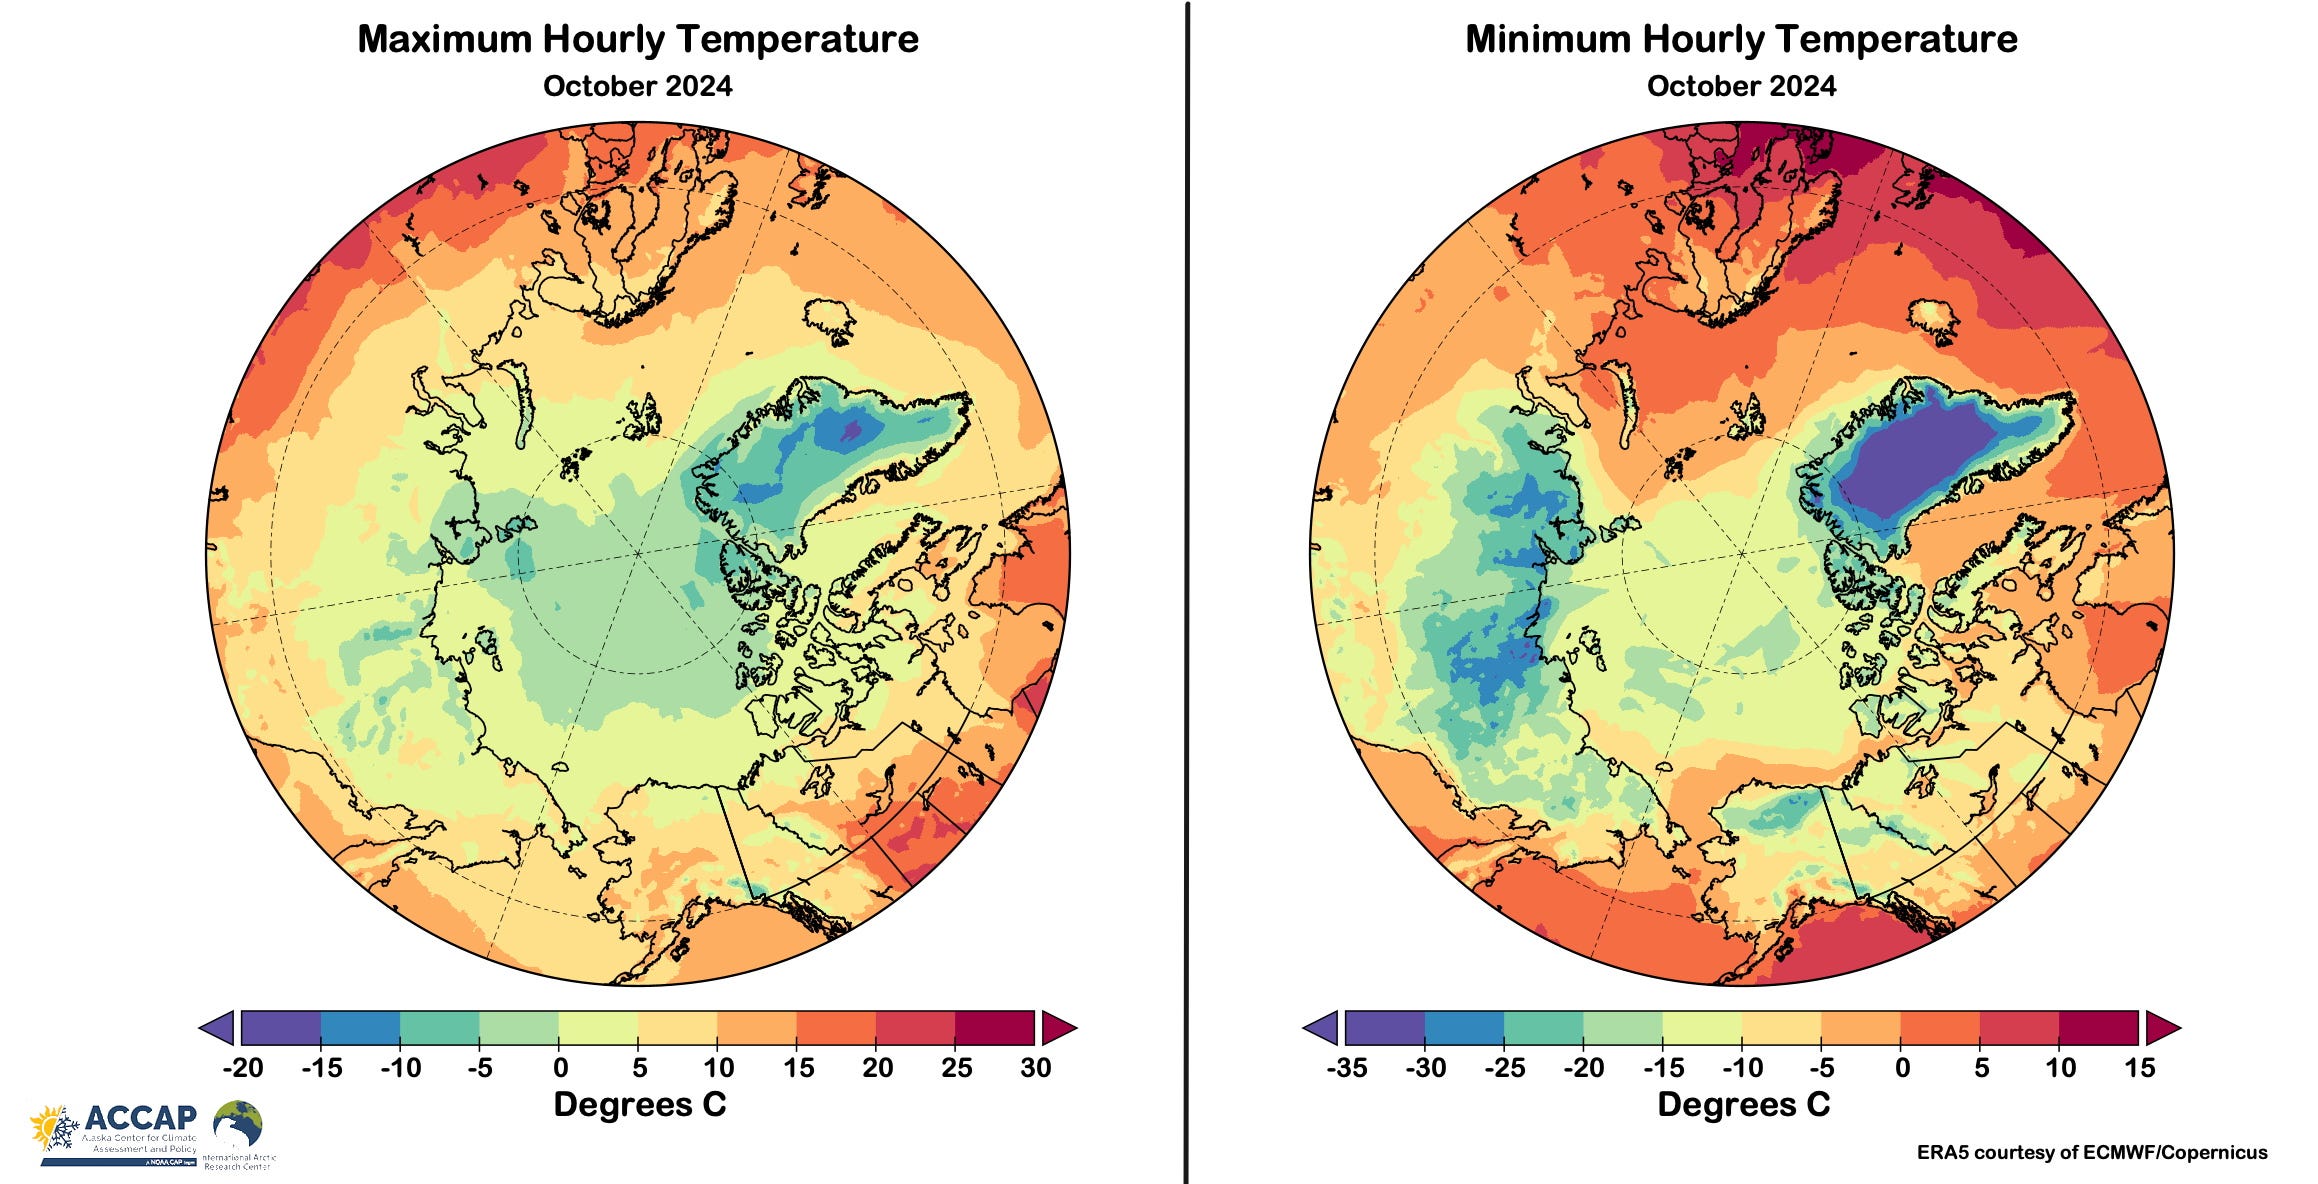
Figure 3 is an experiment this month and shows the highest and lowest hourly temperature from the ERA5 reanalysis in October. High elevation areas stand out clearly, as do the warm oceans. I’m not sure if this is useful at the pan-Arctic scale, so if you have an opinion let me know.
Precipitation
October precipitation (Fig. 4) was well above the 1991-2020 average across Nunavut, Canada (second highest October average, only 2022 higher), northeast Russia and Svalbard. Significantly drier than normal areas were found over the southern Greenland Ice Sheet and smaller areas in Siberia and Northwest Territories, Canada.
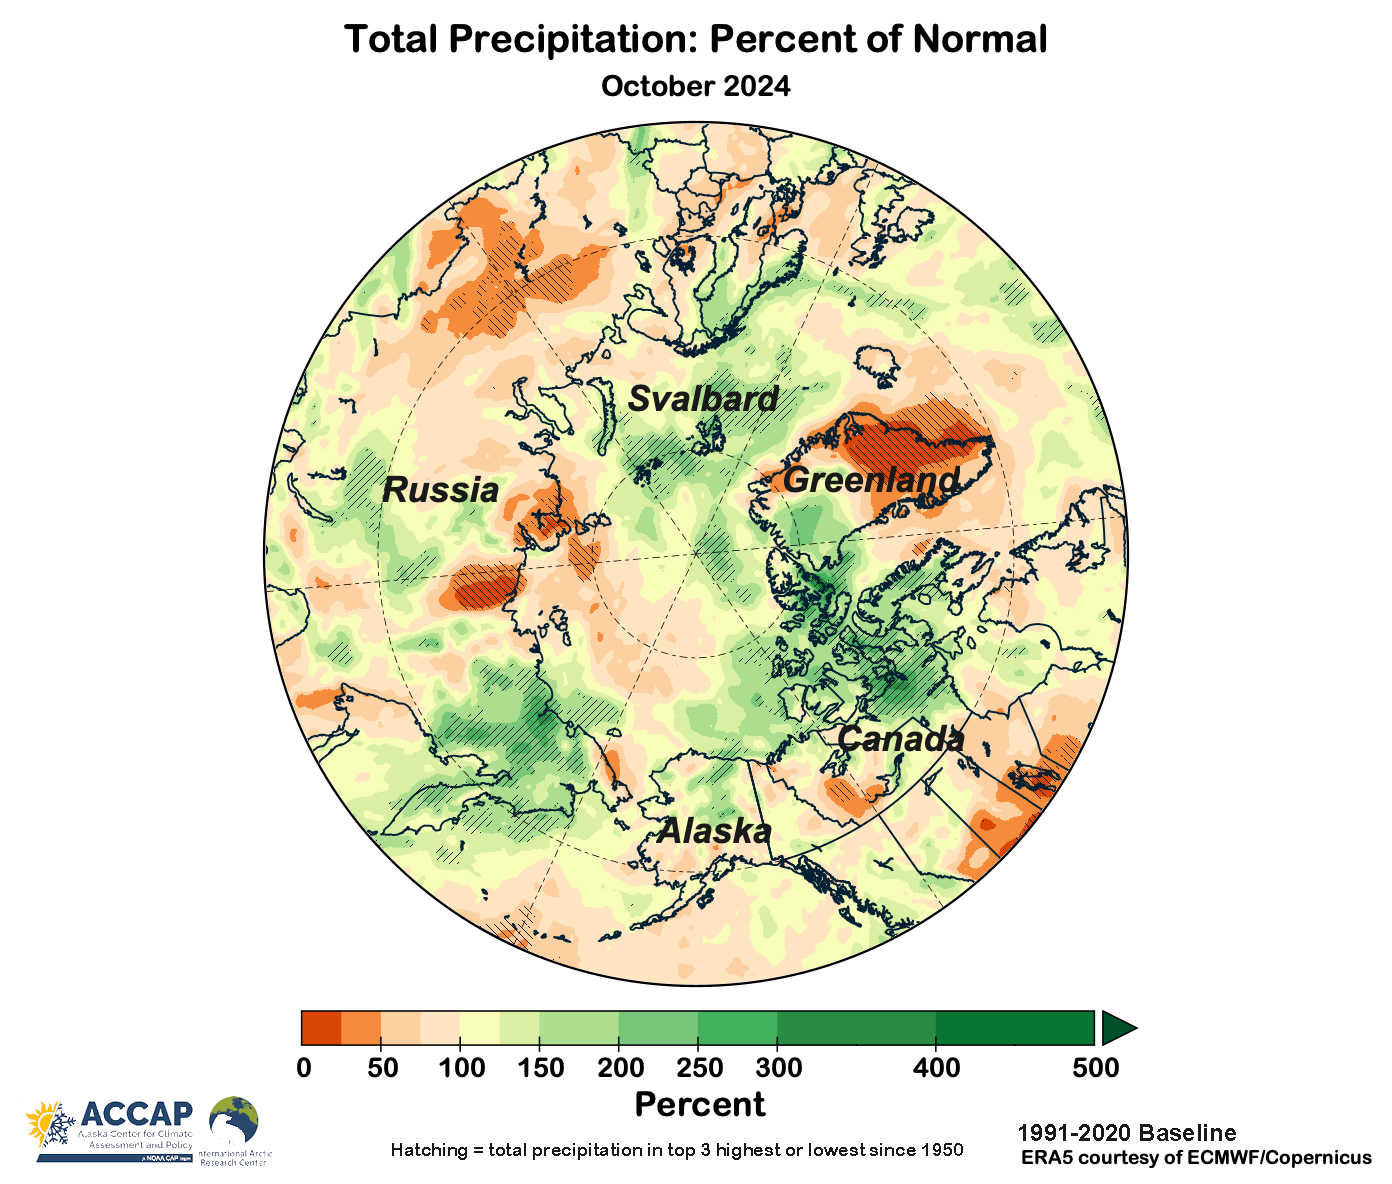
Overall, this was the sixth wettest October since 1950 in ERA5 reanalysis, but for Arctic lands this was the lowest October average precipitation since 2018.
Sea Ice
Sea ice was slow to expand early in October but the rate increased during the second half of the month. Figure 5 shows the sea ice concentration analysis from NSIDC at the start and end of month. Expansion was largest on the Asian side of the Arctic but very limited in the Atlantic sector.

Overall, the October average sea ice extent of 5.94 million km² was the lowest since 2020 and the fourth lowest since 1979. At the end of the month, ice extent in Baffin Bay (between Greenland and northeast Canada) was the second lowest on record and Beaufort Sea extent was the third lowest.
Technical Details
As usual in this newsletter, Arctic means “poleward of 60°N” unless otherwise specified.
ERA5 monthly temperatures and precipitation data available here.
Code by B. Brettschneider/NWS Alaska Region allowing rapid ERA5 and NASA GISS regional analysis is invaluable for my work.
NSIDC Arctic Sea Ice information, graphics and data available here.
I’ve modeled the Arctic October temperature trend via piecewise linear regression but this may well be an (ongoing) series of step changes, 1950-2001, 2002-2015, 2016 to now.
The NASA GISS temperature analysis starts in 1881 and there were no pre-1950 Octobers anywhere close to the post-2018 warmth for the Arctic lands.
That PIOMAS animation is downright alarming. We can see the Arctic covered in ice from a satellite view and feel reassured, but then we discover that the ice thickness is reaching historic lows.
Thanks very much and very helpful. I hope you don't mind, but I've been putting the word out about your newsletter including restacking to Notes. In the current era of polar rapid warming, you provide crucial data people need to be cognizant of.