


June 2025 Arctic & Alaska Climate Summary
Less extreme than recent months

This post focuses on temperatures and precipitation. Details on wildfire and sea ice in June are in my post here.
The Arctic
Temperatures
June 2025 for the Arctic overall was on the cool side by recent standards, though not of course in a longer historical content.
Figure 1 shows the monthly temperature departures from the 1991-2020 baseline. As happens in summer, temperature departures over ice-covered portions of the Arctic Ocean are small because heat is going into melting snow and sea ice instead of warming the air. About 55 percent of the Arctic (land and sea poleward of 60°N) had an average temperature above normal in June. Notable warmth at the monthly scale was confined to parts of Nunavut, Canada and far western Siberia. In contrast, a large portion of central and eastern Siberia had near to below normal temperature for June.

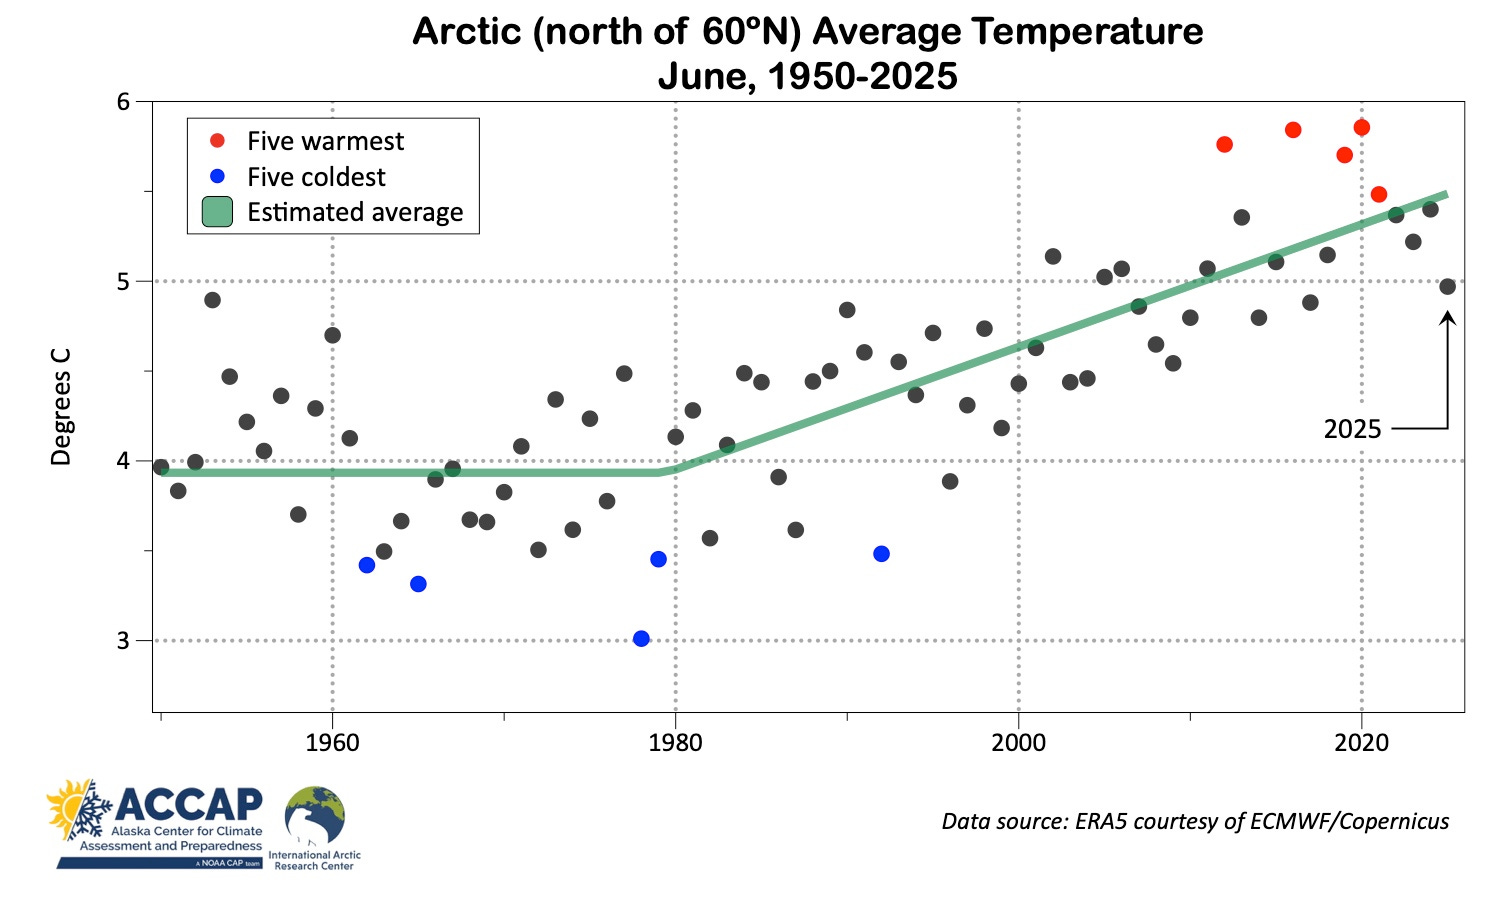
The Arctic-wide June average temperature time series is shown in Fig. 2. While this June was the coolest since 2017 and ranked as “only” the 16th highest since 1950, it was still milder than every June prior to 2002.
Precipitation
As always, precipitation was much more variable than temperatures. About 52 percent of the Arctic had above normal (1991-2020 baseline) precipitation in June, but the average was the third highest in any June (since 1950).

Regionally, Iceland had the second highest June precipitation since 1950 while across eastern Nunavut, Canada and southern Greenland precipitation was well below normal.
Alaska
At the monthly time scale, temperature departures were split between near to above normal north of about 63°N and near to below normal farther south. The ERA5 version of June temperature departures is shown in Fig. 4a and the site-specific version in Fig. 4b.


Early in the month there was some notably chilly weather. Anchorage’s high temperature of 48F (8.9C) on June 4 was the lowest June daily maximum temperature since 1973. The North Slope was also chilly in early June. Deadhorse's high temperature of 25F (-3.9C) on June 2 and 4 tied with June 4, 1974 for the lowest June high temperature on record (since 1969). Finally, McGrath's low temperature of 30F (-1.1C) on June 9 is the lowest temperature so late in the season (since 1941).
Precipitation
Precipitation was above normal on the northern Gulf of Alaska and Bering Sea coasts while the North Slope coast was decidedly on the dry side (though typically June precipitation is quite low). Precipitation over inland areas was decidely mixed, which is not uncommon in early summer due to the predominance of showers and thunderstorms as the source of most of the precipitation.

At Nome, total rainfall was 2.5 times normal and the highest June precipitation since 1980. In contrast, no long-term climate site had notably low precipitation.

While June snow is not uncommon in the Brooks Range or on the North Slope, low elevation snow in the Interior is much more unusual. Bettles reported 0.4 inches of snow on June 6, the latest accumulating snow on record there (since 1944).
Lightning
As I noted in my June 22 post (here) on the rapid onset of wildfire season in Alaska, a key factor in that was a stable weather pattern conducive to day-after-day thunderstorm development, which resulted in the most lightning strikes in Alaska in June since 2015. Figure 6, courtesy of Richard James (author of the excellent Deep Cold blog), shows the spatial distribution of lightning strikes detected by the BLM’s Alaska Lightning Detection Network. The graphic plots the number of strikes per 100km², so is sometimes referred to as a “lightning density” plot. Note that the color scale is not linear: the highest category shown (the dark purple colors, e.g. west of Eagle) is 50 times (or more) as many strikes per 100km² as the lowest category (the light blue).
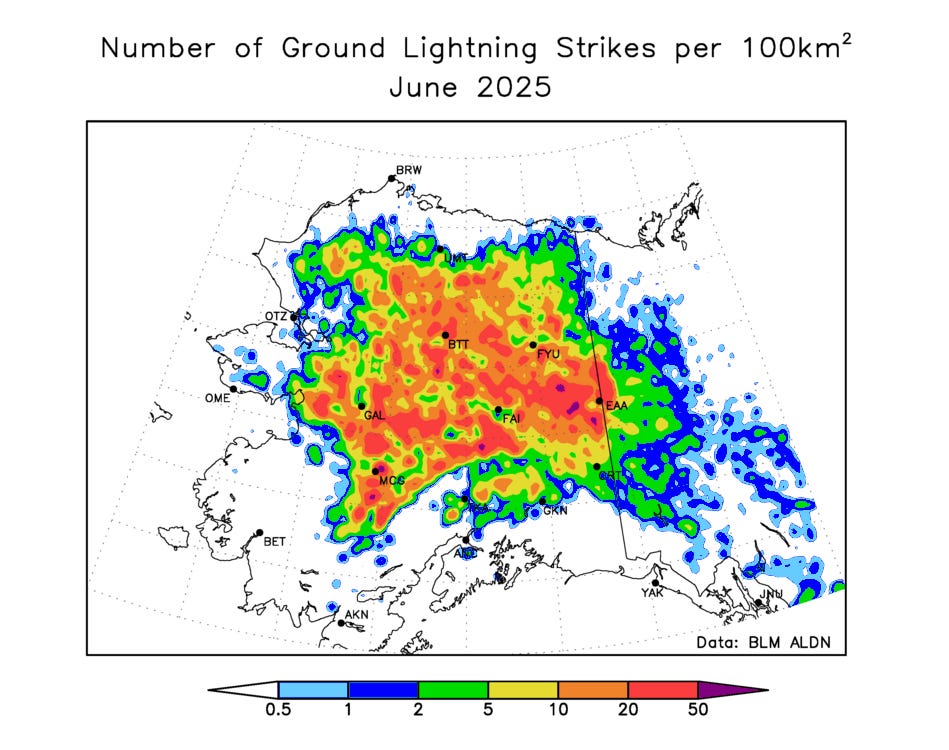
A couple of features on note jump out at me. First, notice there was no significant lightning detected in southwest Alaska or most of the Kenai Peninsula. Another clear feature is the “wall” that the Alaska Range formed. Even in the upper Susitna and Copper River basins, where there was some lightning, there’s a clear demarcation formed by the high mountains.
Thanks, Rick! Striking to me is the precipitous drop in Global Surface Air Temp easily seen on C3S "Climate Pulse". Do you know the cause?