


June 2025 Alaska/Yukon Wildfire Update
A near-record slow start escalated rapidly
A cool May and early June resulted in a sluggish start, but the 2025 wildfire season in northwest North America exploded the week of June 15. This is a rapidly changing situation and so this post is mostly to provide some explanation of how we got here.
Summary: low precipitation since snow melt and low humidity allowed the boreal forest to dry out, so when a hot but thundery weather pattern set up, fuels were prime to ignite. And they did.
What Happened?
The week June 15-21 brought:
Extended high temperatures in Interior and northwest Alaska, though only a few records were set
173 new wildfires in Alaska
54,800 lightning strikes in Alaska
Only localized heavy rain from thunderstorms
Significant fires:
Bear Creek between Healy and Anderson intermittently closed the Parks Highway, multiple structures reported lost
Central and Circle areas: Several fires, including the Turtle and Ikheenjik fires, threatened infrastructure along the Steese Highway
Fairbanks area: Himalaya Road, Bonanza Creek and Goldstream Creek fires all resulted in evacuation notices for some subdivisions
Bonnifield Creek fire sent smoke into urban Fairbanks Saturday and Sunday (June 20-21)
Dawson, YT area: Quebec and Mount Leotta fires intermittently closed both the Top of the World and North Klondike Highways
Both the number of lightning strikes and the number of new fires are extreme, but are not unprecedented. The week of Solstice in June 2015 saw about 60,000 lightning strikes in Alaska and nearly 300 new fires, which burned more than three million acres (1.2 million ha) in the following three weeks.
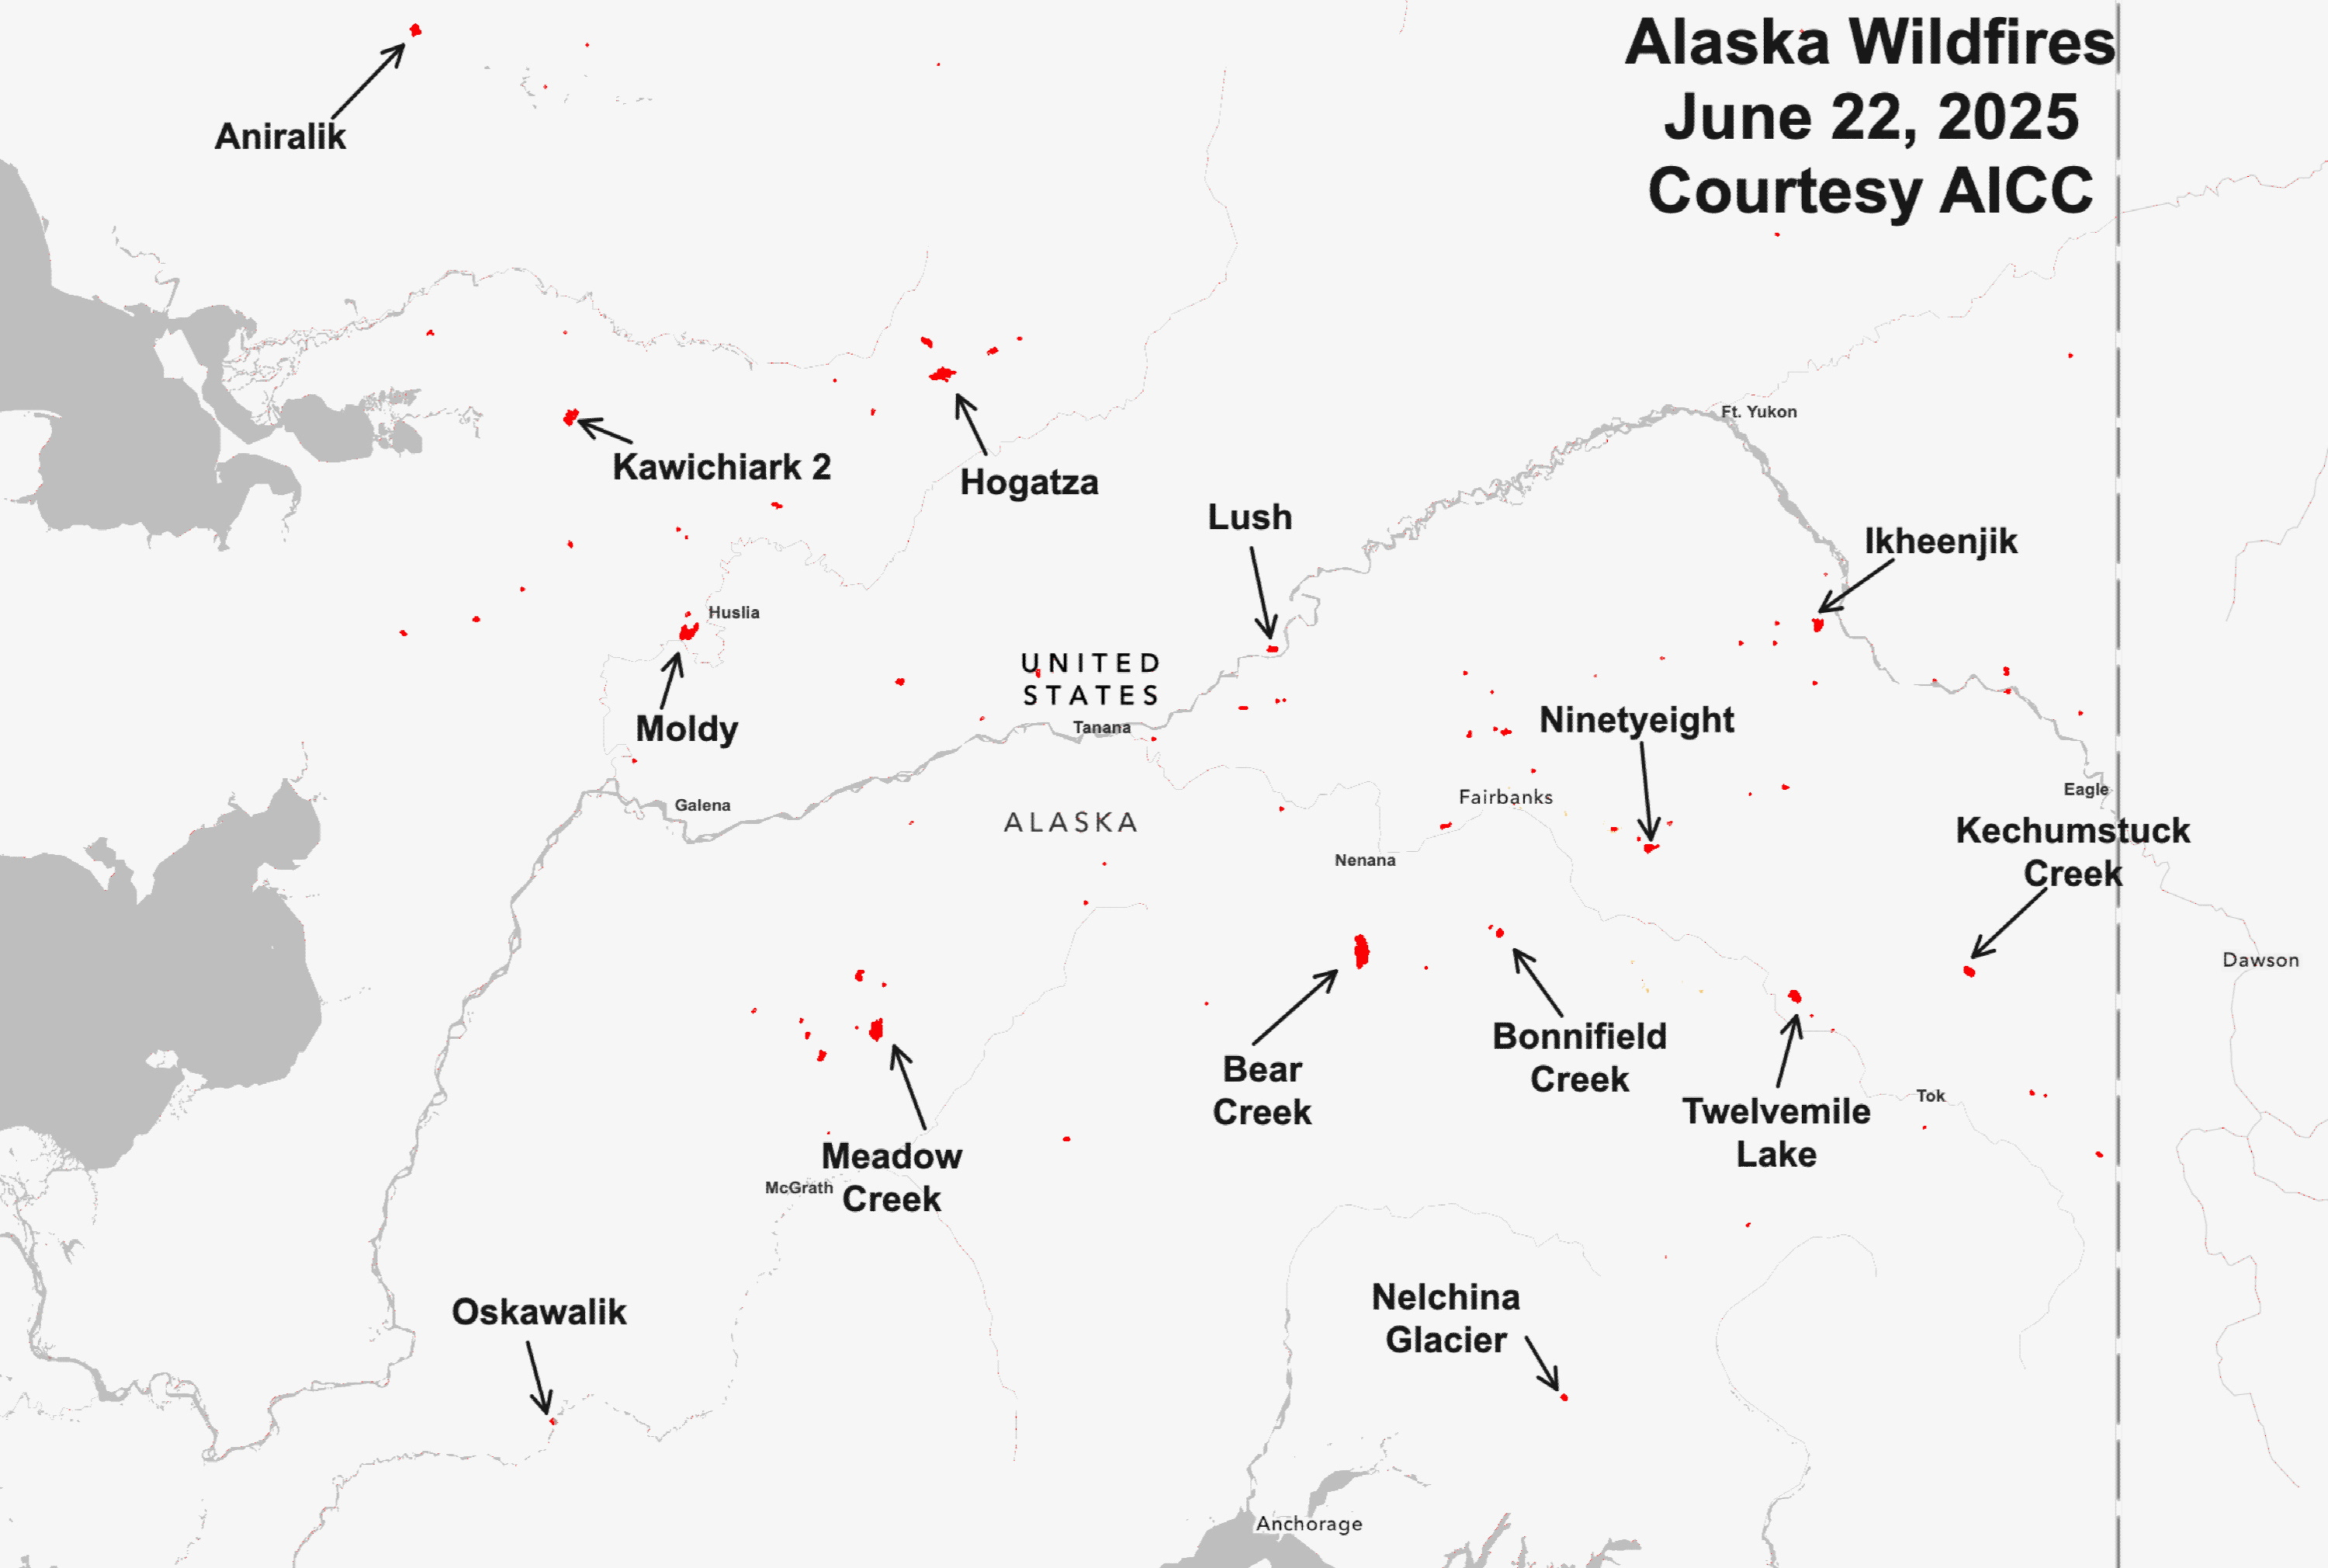
Sunday June 22 early morning wildfire area burned totals were 99,107 acres (40,100 ha) in Alaska and 26,000 acres (10,500 ha) in the Yukon Territory. These numbers will increase dramatically in the coming days. Figure 1 plots wildfire perimeters in Alaska as of Sunday morning, as mapped by Alaska Interagency Coordination Center (AICC), and I’ve annotated some of the larger fires.
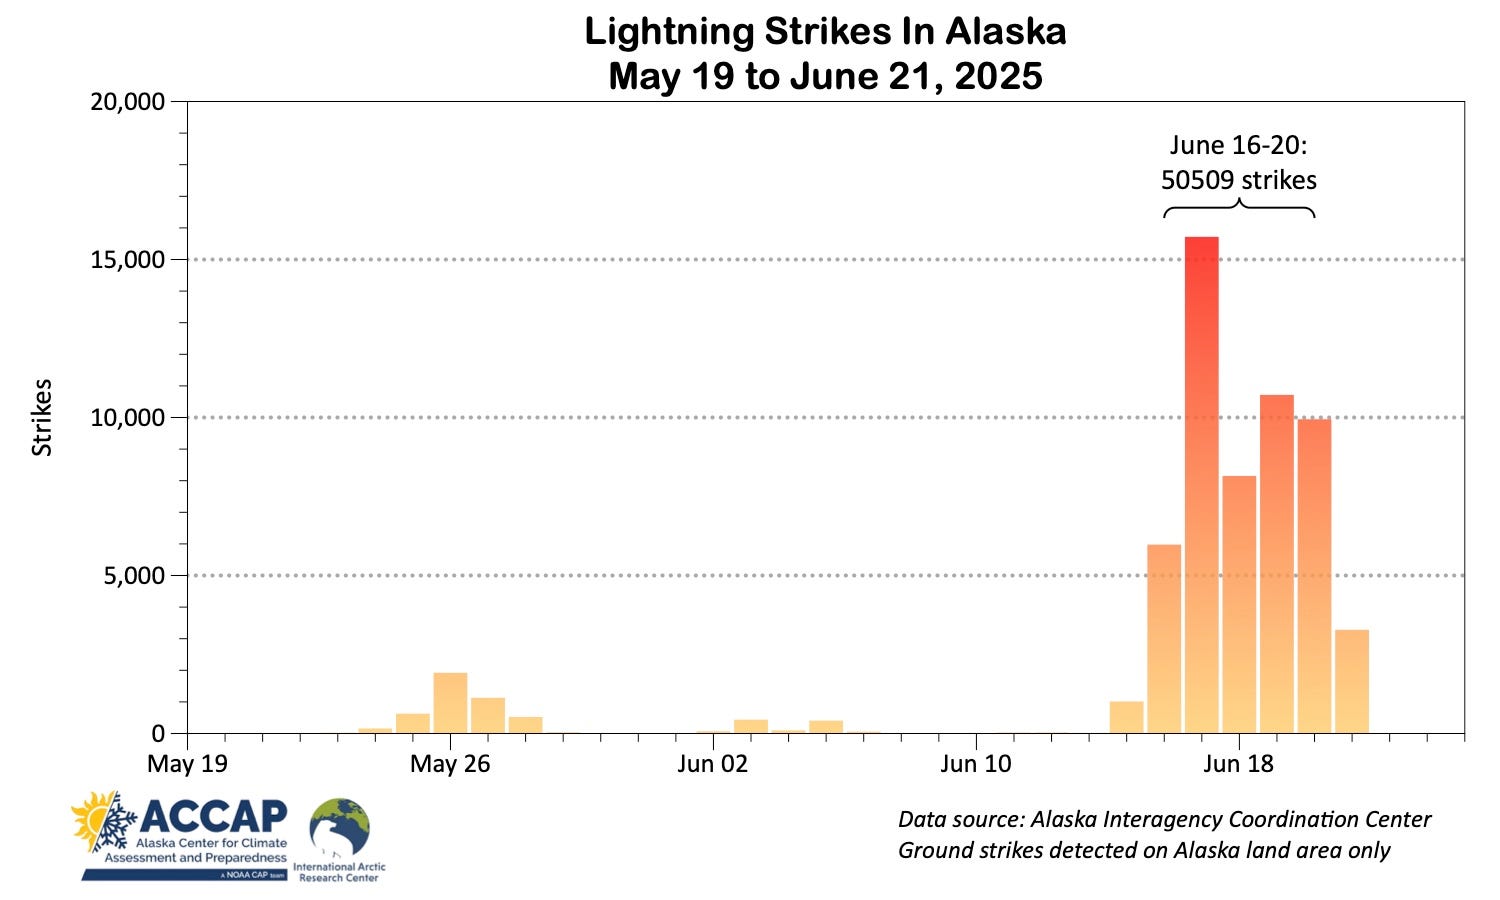
Daily lightning strikes counts from the BLM’s Alaska Fire Service network (only in Alaska and excluding cloud-to-cloud lightning) are shown in Fig. 2. The highest daily strike count of just over 15,000 on June 17 is high but has been exceeded quite a few times in the past decade. More notable is the June 16-20 total of over 50,000 strikes. This is the highest 5-day total since July 13-17, 2016, although July 10-14, 2019 was close.
Weather and climate set-up
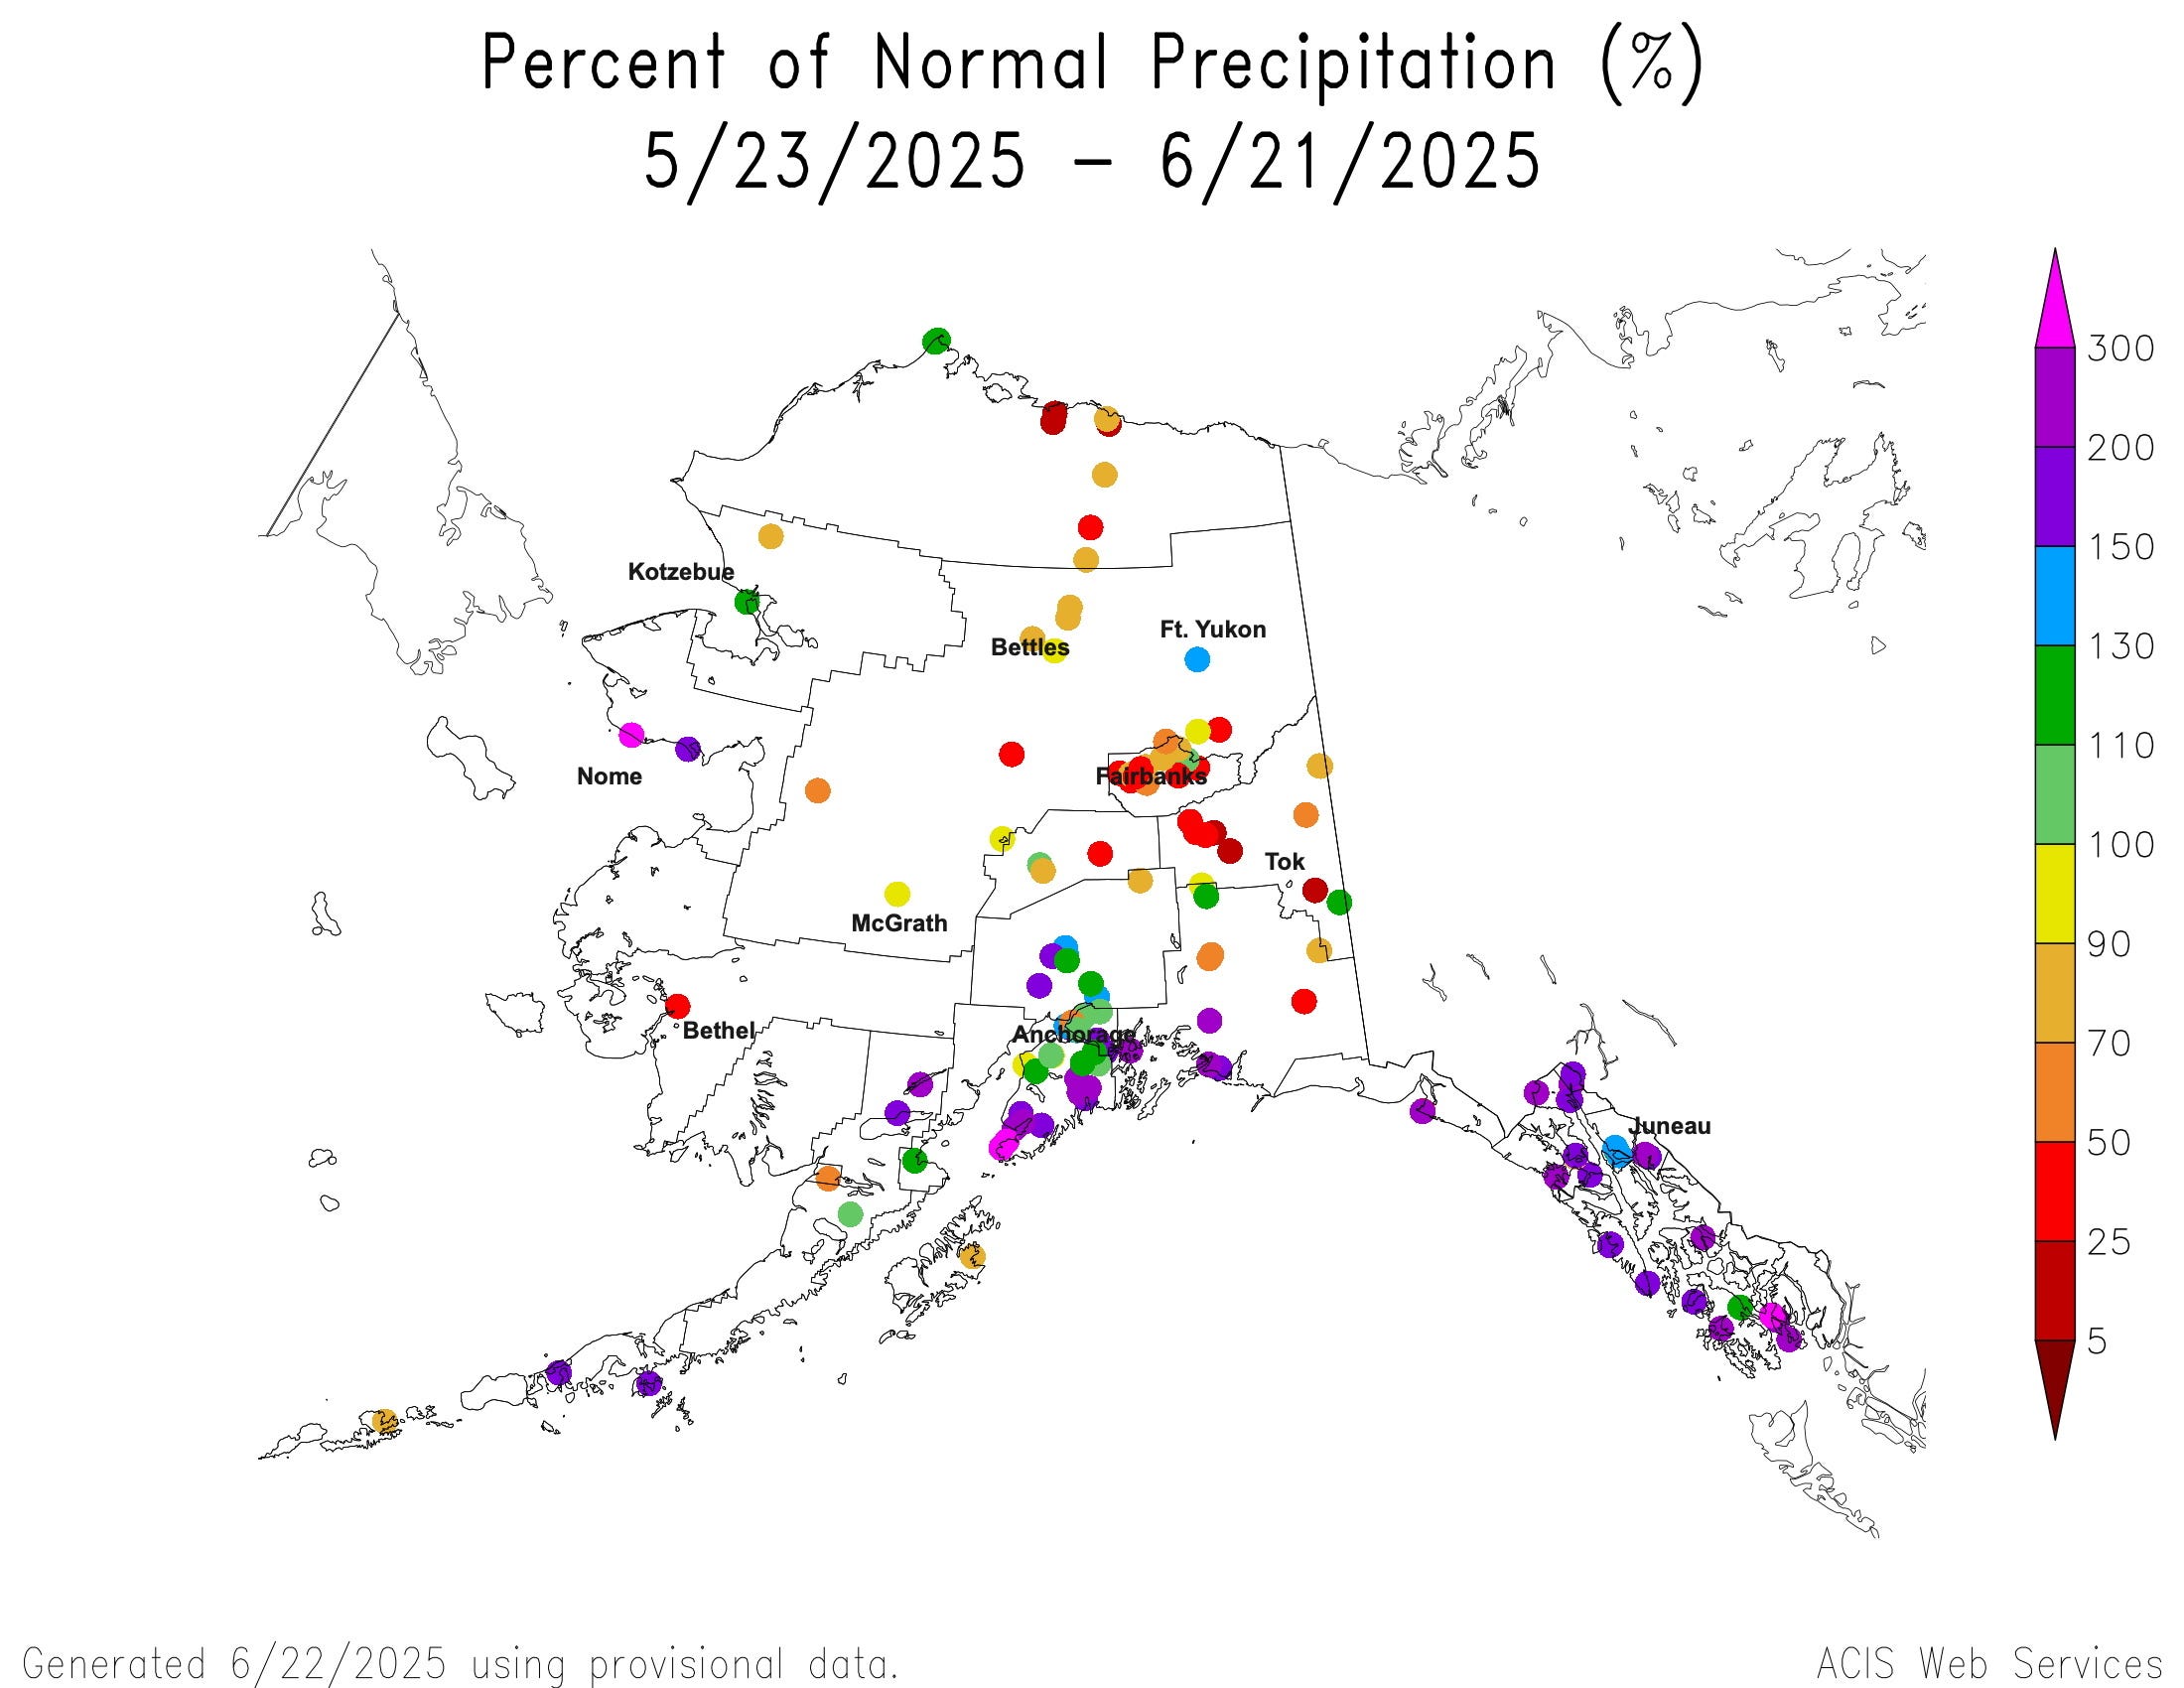
Much of Interior Alaska has had well below normal rainfall since the winter snowpack melted out in late April/early May. Station-specific percent for normal precipitation for the 30 days ending June 21 is shown in Fig. 3. Only a few sites north of Alaska Range reported above normal rainfall in the past month.
Figures 4a and 4b show the analyzed fire weather index (FWI) for Alaska and the Yukon Territory as of June 21. This index is used in Alaska and boreal Canada as an integrated measure of wildfire potential, taking into account how dry fuels of various sizes are, which in turn are dependent on prior air temperatures, humidity, wind and rainfall. Index values above 30 indicate there is significant potential for wildfire. Values above 40 are extreme. For Alaska, significant parts of the low elevation Interior (and Copper River Valley) show high FWIs, the net result of low precipitation, high temperatures and low humidity.
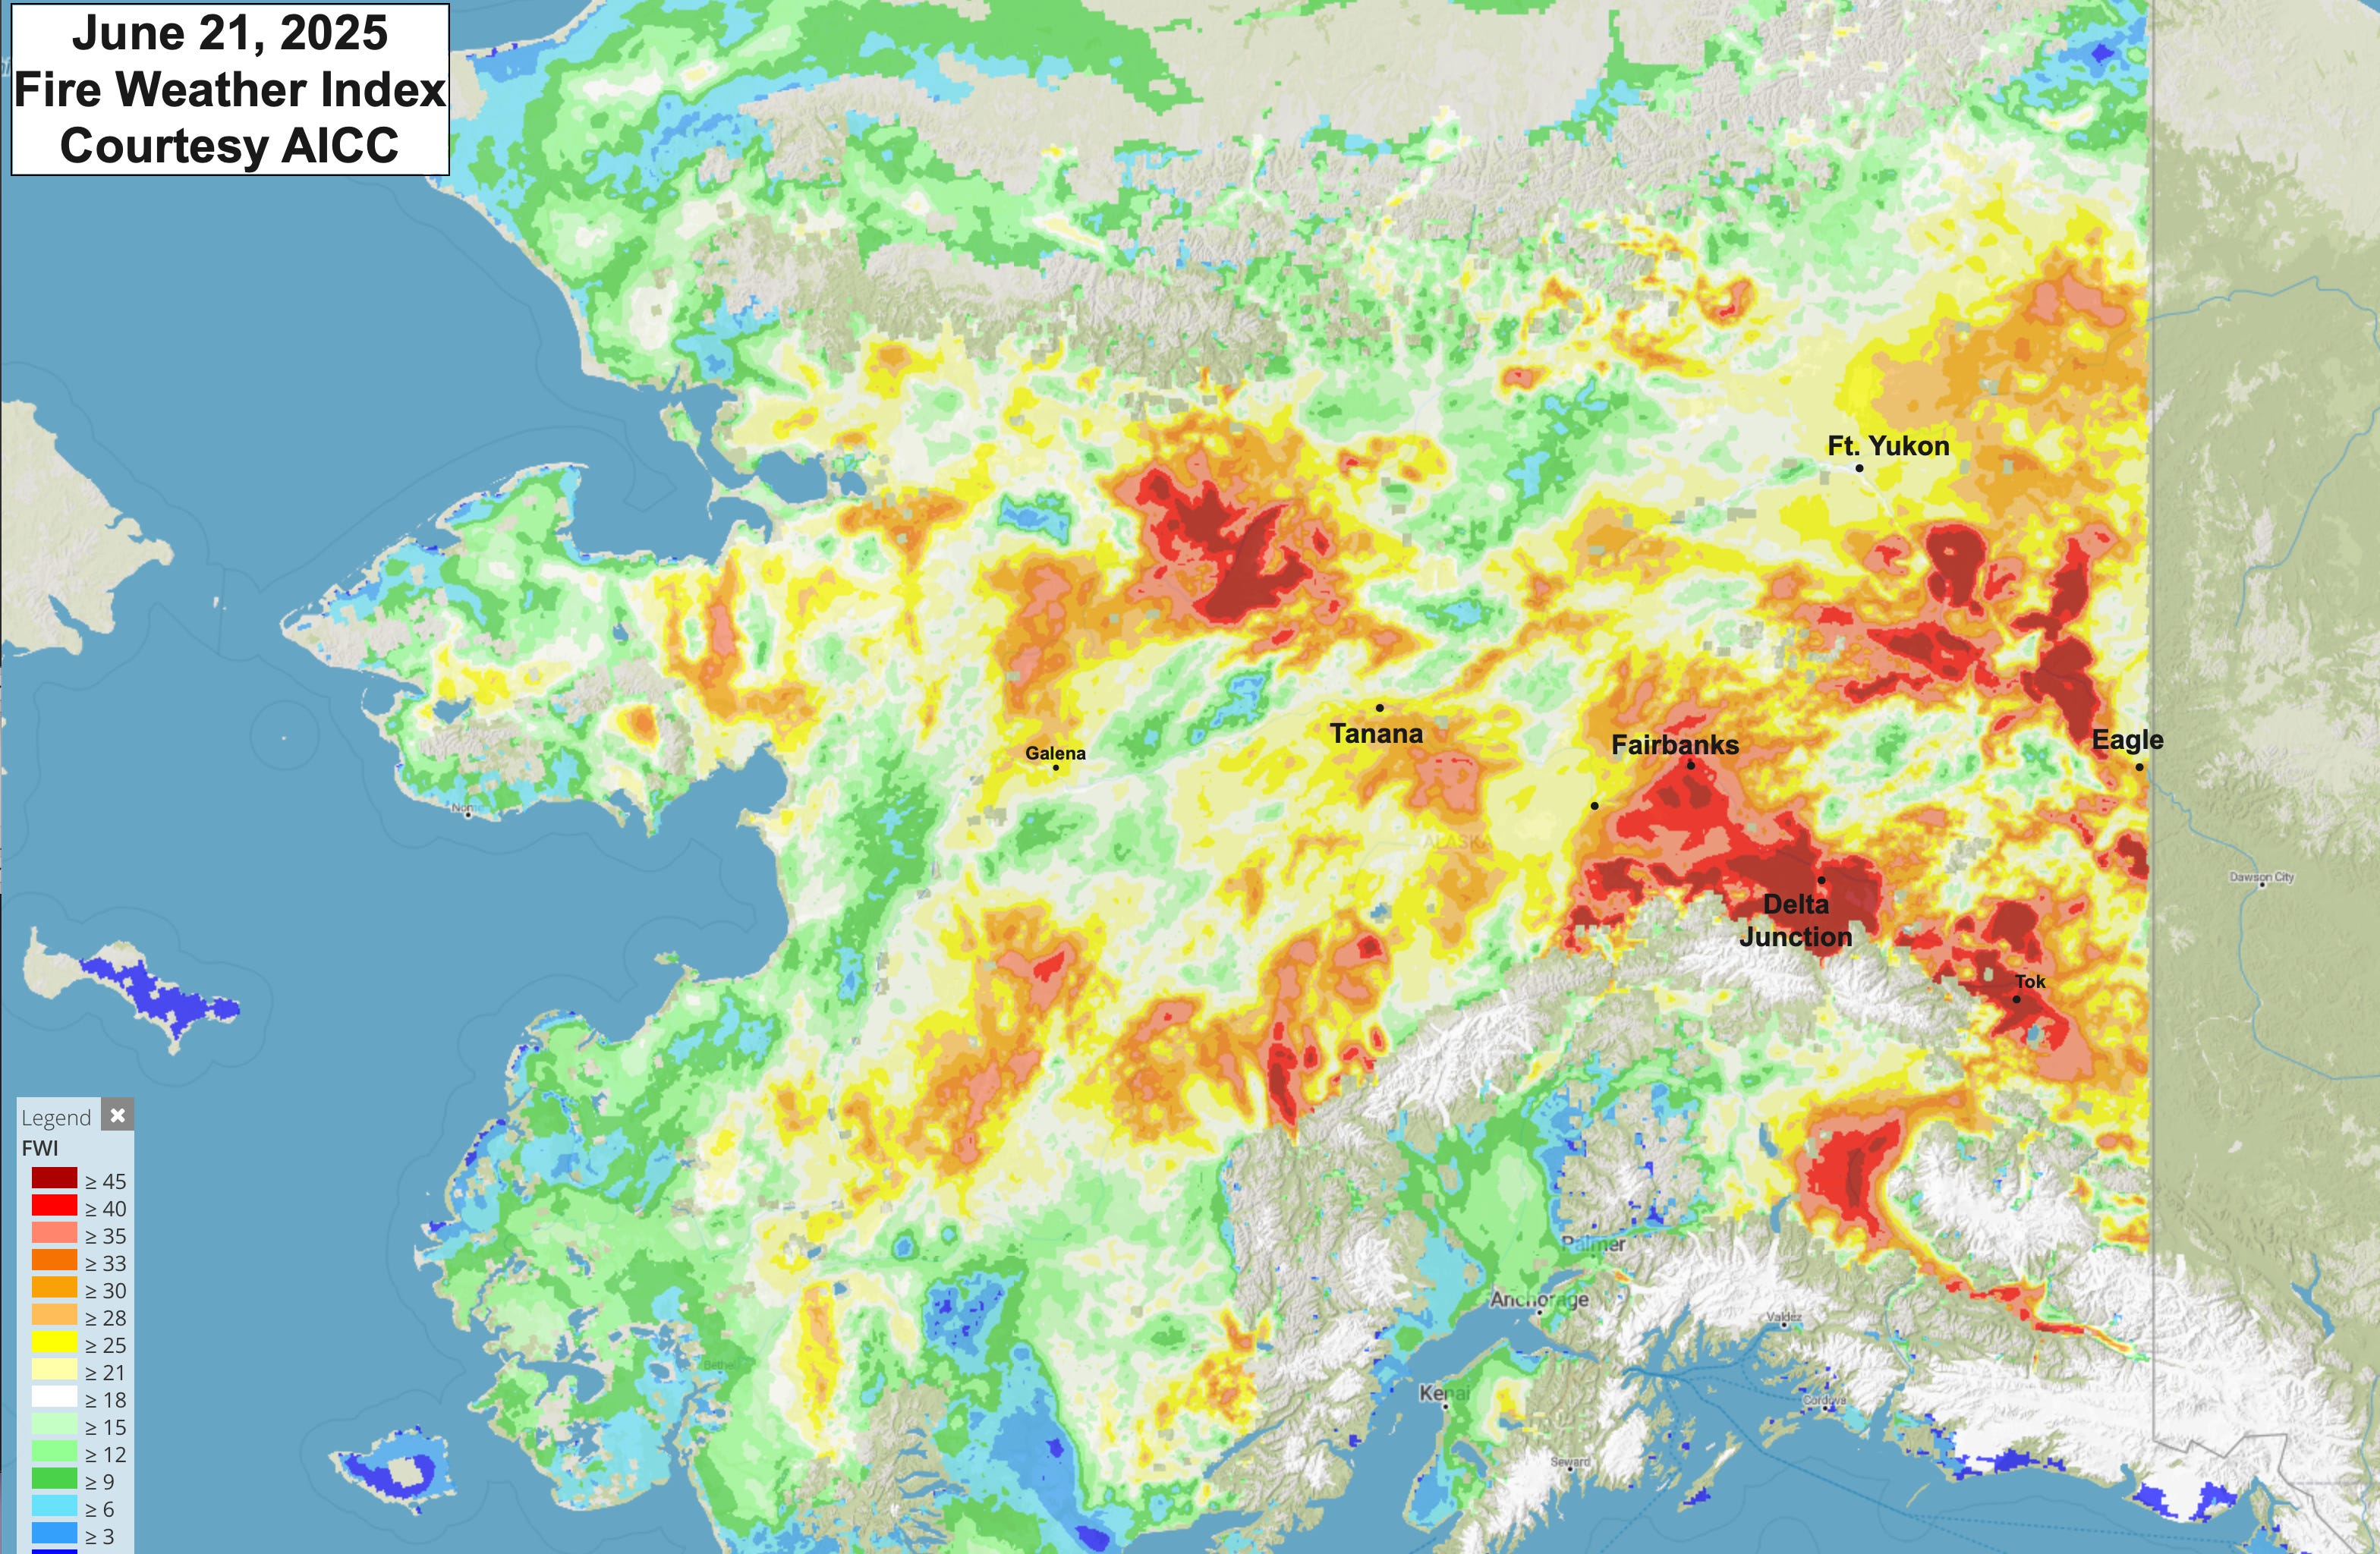
For the Yukon Territory, FWIs on June 21 were also elevated, though generally not quite as high in Alaska.
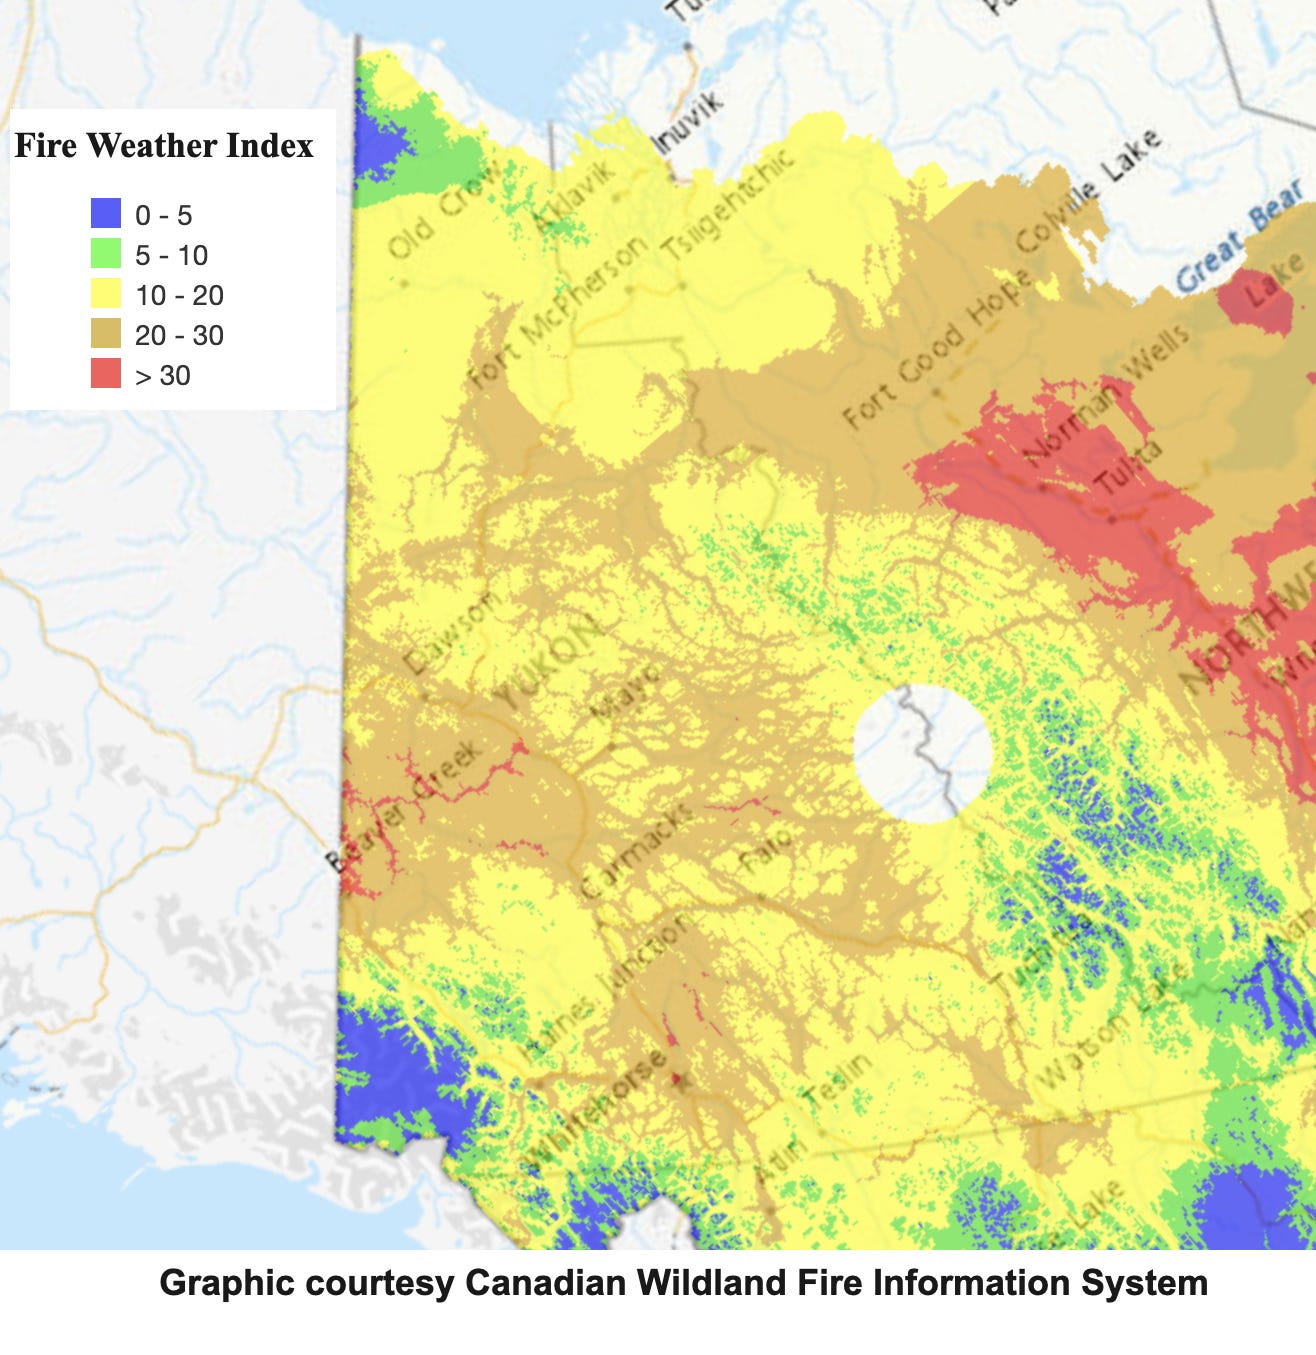
Figure 5 shows the average mid-atmosphere (500 hPa) set-up for June 15-20, 2025. This is a classic set-up for thunderstorms in Interior Alaska. Big, but not too big high pressure centered over the south slopes of the Brooks Range, resulting in easterly winds aloft to the south of the center. However, total water vapor available to fuel the thunderstorms was only about average for this time of year, so thunderstorms were not efficient producers of widespread rain, meaning that many lightning strikes occurred in areas that received little or no rain.

Because this pattern held in place for several days with little change, thunderstorms developed day after day.
Rick do you have access to the lightning strike data over the last few decades? When was such data first started being tracked by satellite? My hunch is that a chart would show a rise and it would be interesting to see the curve.
That's a terrible combination of factors, very upsetting. Thank you for your dedicated observations and reporting, Rick. Hoping it doesn't go sideways.