This post covers wildfire, sea ice and sea surface temperatures in July. We’ll tackle temperatures and precipitation this weekend when the ERA5 reanalysis data for July becomes available. For more on the early July extreme heat in northwest Canada and far eastern Alaska see my post here. The July highlights most for Alaska is here.
Wildfire
North American wildfire has been in the news since June, and already this is the largest wildfire season record in Canada. Wildfire is not uncommon in most non-tundra parts of Canada: what makes this summer so remarkable is wildfires have been widespread and large, from the Atlantic Provinces to British Columbia and to the northern boreal regions. Wildfire across theNorth as of the end of July is shown in Fig. 1. The Northwest Territories is already at the greatest area burned by wildfire since 2014. Moving westward, Yukon Territory wildfire started of slow but picked up in July thanks to sustained very warm weather. In Alaska, wildfire was at unprecedented low levels until a dramatic thunderstorm outbreak on July 24 that sparked dozens of fires, and several days thereafter also had significant thunderstorm activity. This is extremely unusual at this time of year: the end of July climatologically marks the start of the Interior Alaska “rainy season”, when increasing westerly winds aloft regularly bring weather fronts and moisture from the Bering Sea. But not this summer.

For Alaska, the total area burned during July was just over 40,000 acres (16,300 ha), nearly all of this burning the last week of the month. While a dramatic change from earlier in the summer, this was still only 17 percent of the 1993-2022 median July area burned, as seen in Fig 2. However, there were a couple of significant fires that were close enough to homes to prompt evacuation notices the last days of July in the Anderson area, along the Parks Highway between Nenana and Healy and along the Salcha River, southeast of Fairbanks.

Sea Ice
Around the Arctic in July, average daily sea ice extent was near to below the 1981-2010 normal in most areas (Fig. 3). The National Snow and Ice Data Center’s analysis ranked the Arctic-wide July ice extent as the 12th lowest for the month since 1979, but in a measure of how much things have changed, this month the average extent was lower than every July between 1979 to 2006. Regionally, July average ice extent was the lowest in the 45 years of record in the Canadian Archipelago, third lowest in Hudson Bay and sixth lowest in the Beaufort Sea.
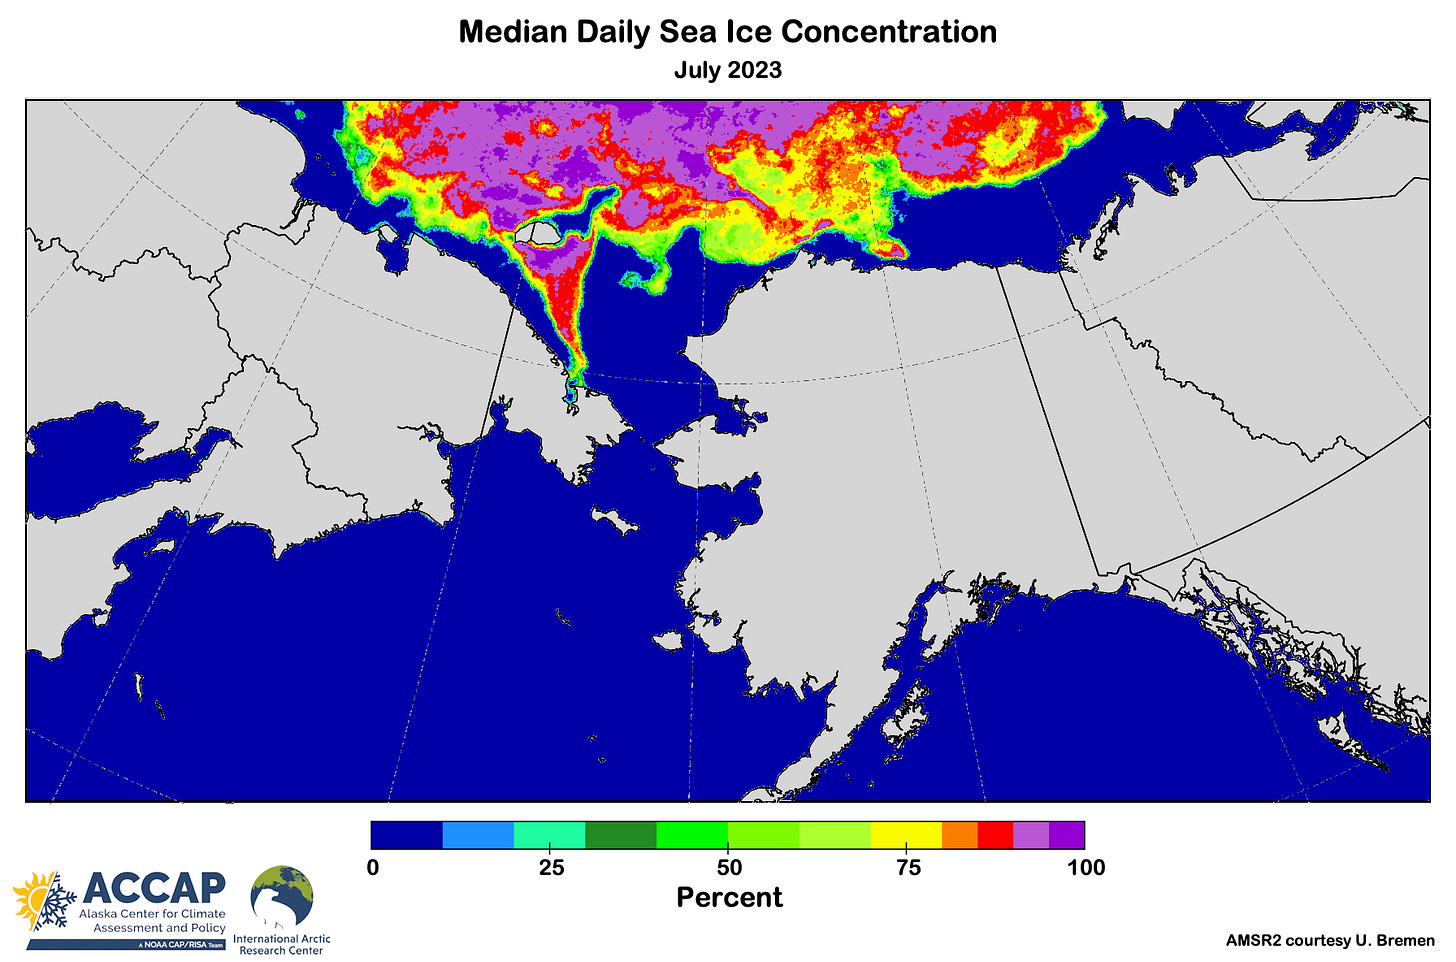
Figure 4 shows the July median daily sea ice concentration for the greater Alaska and vicinity area from the higher resolution AMSR2 data. There is of course usually significant decrease in ice concentration in this region during the course of July, but this level of detail shows some salient features, including the ice persistence northwest of Utqiaġvik and the small area of higher concentration ice northwest of Prudhoe Bay (the same area where the fiber optic cable cut occurred in early June, greatly disrupting internet communications for the North Slope and northwest Alaska).
Figure 5 shows the July average daily sea surface temperature departures. As is often the case in mid-summer, the largest departures are in the North.

Sea surface temperatures (SSTs) in July in the oceans around Alaska were generally near to slightly above normal in the Gulf of Alaska and western Bering Sea. The eastern Bering Sea with the exception of Norton Sound saw below normal SSTs continue from June. North of the Bering Strait, SSTs departures from normal were strongly modulated by the presence or absence of sea ice. Mackenzie Bay SSTs were exceptionally warm, the result of very warm MacKenzie River discharge. This warm inflow was partially responsible for early open water in the southeast Beaufort Sea and spread westward during the month. By the last week of July water more than 5°C above normal was found as far west as Camden Bay, Alaska, between Prudhoe Bay and Kaktovik.


