March and April 2024 total precipitation, as shown in Fig. 1, was far above normal in western Alaska and eastern Bering Sea, especially from the Yukon River delta north across the Seward Peninsula and into Northwest Arctic Borough, with a swath from the Yukon delta northward across the central Seward Peninsula having a “top three” precipitation total in the ERA5 reanalysis since 1950.

Recent Increase in Early Spring Precipitation
The really interesting bit is when we notice that early springs in western Alaska have had very high precipitation in most years since 2018. This is clear from Fig. 2, which shows the total March-April precipitation at Nome since 1908, along with the 7-year trailing average. The average March-April for 2018-2024 is 3.11 inches, which is far higher than any time in the past 117 years, when the highest 7-year average barely exceeded 2 inches in the 1930s and 1940s.

The high precipitation totals are not confined to Nome. Back to ERA5, Fig. 3 shows the 2018 to 2024 March-April average precipitation as a percentage of the average over the preceding 40 years. Most of mainland Alaska except for the Gulf of Alaska coast has had notably more precipitation over the past seven years, with virtually all of western Alaska seeing dramatically more precipitation (while the big increases in the Interior are more like “bullseyes”).

Now seven years is a short time period for assessing climate variability, but especially for precipitation (and snow) averages, which can be greatly influenced by even one extreme year. To reduce the outlier impact, Fig 3. shows the 2018-2024 median total precipitation as a percent of the 1978-2017 average.

There are clear differences from Fig. 2, indicating some “oversized” influences of individual years, but the story does not change: most of mainland Alaska except the Gulf coast has seen higher precipitation totals in the past seven relative to the previous 40 years.
Statistical Analysis
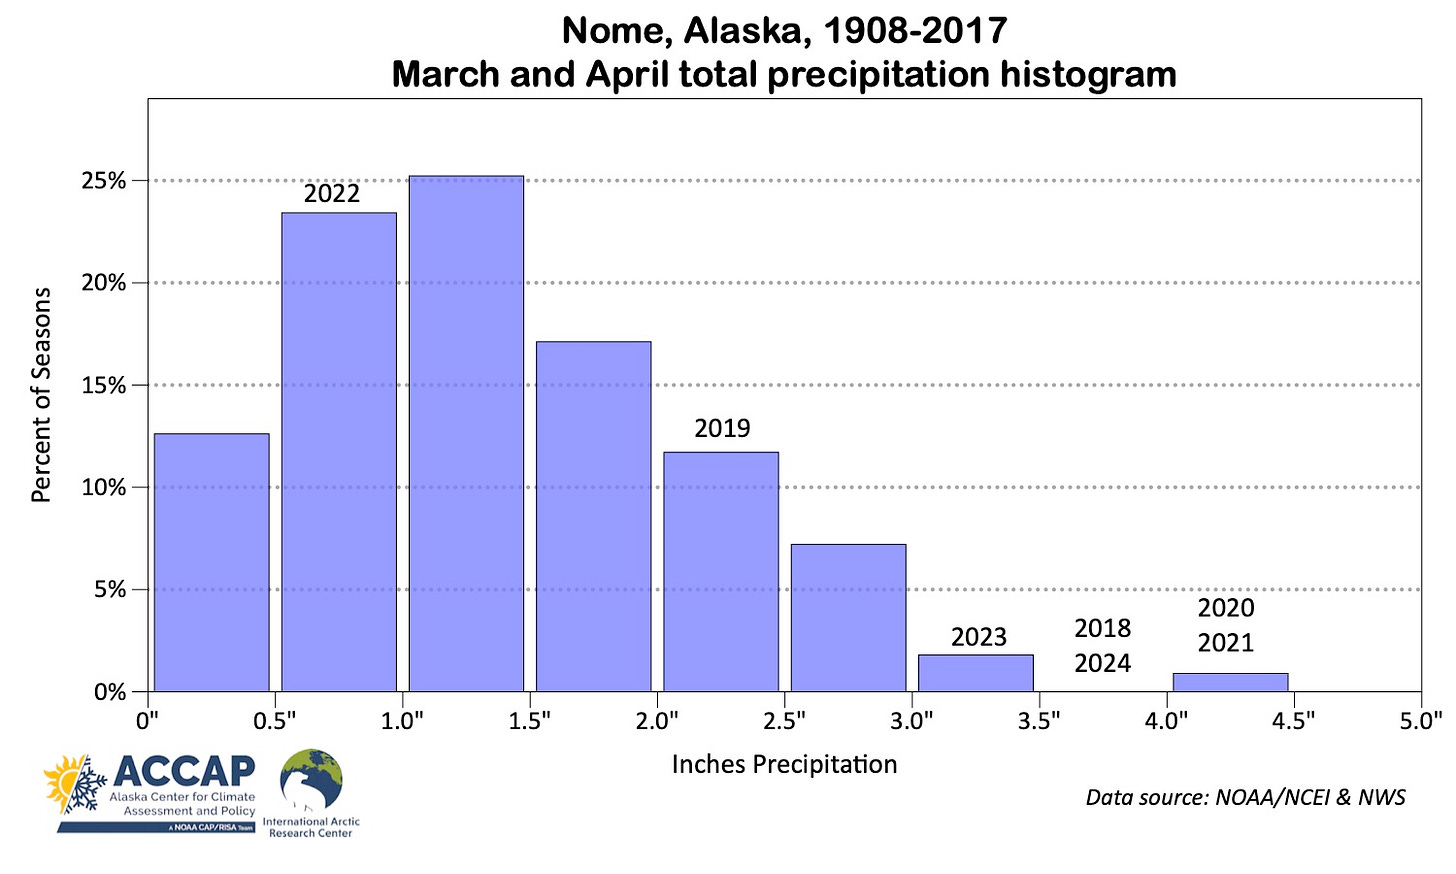
Unsurprisingly, I’ve been asked repeatedly: “is something changing, or is this just luck of the draw”? It’s not going to be a matter of long term trend, nor is it a function of one or two extreme years. As the long time series from Nome (Fig. 2) shows, it’s the run of high precipitation early springs in recent years that is so unusual compared to the previous 110 years. Digging into the Nome data further, Fig. 4 is a simple histogram of the March-April precipitation totals plotted in Fig. 2 through 2017. I’ve annotated the totals since 2018.

This has a classic shape of a precipitation distribution, with most totals bunched up on the low (left) side but with a long “right” tail, which is where six of the past seven years come in. There are a couple of statistical methods we can use to assess how unusual the current run of high precipitation springs is. Both make use of the 110 years of Nome precipitation observations 1908 to 2017 to construct extremely long artificial time series and see how frequently the “7- year” averages are as high or higher than that for 2018-2024. An important assumption that each observed March-April total is independent, and in this case this appears to be reasonable.1
First, we can randomly select seven observations from the list of 110 years total observations and find the average.2 We can then repeat this many times. A possible downside to this method is that while we can readily create many 7-year averages, the individual inputs are constrained to what has been observed in the 110 years. Obviously, it’s physically possible that higher or lower values could occur. To test that possibility, we can fit the 110 years of observations to a gamma distribution, which is often a good statistical model for precipitation because it is limited to positive numbers and typically has a long right tail, like seen in Fig. 5. We can then use the fitted distribution to generate many individual seasons and then calculate the “7- year” averages. Figure 6 shows the results of 20,000 iterations of both methods. Using the “sampling observed” method (top), not a single “7-year” period came close to the observed 2018-2024 level. Using the fitted gamma distribution method, there is exactly one out of 20,000 iterations with the “7-year” average as high as the actual 2018-2024 average.
Both these statistical exercises tell us that what’s happened at Nome the past seven years with early Spring precipitation is almost certainly not random chance but rather point to “something’s different”. Physically, it’s unlikely that it’s just one “something”, but more likely a combination of differences in storm tracks, reduced sea ice extent and higher ocean surface temperatures are all playing a role.
Technical details:
Temperature and precipitation analysis spatial maps and time series from ERA5 reanalysis data from ECMWF/Copernicus, available here.
Code by B. Brettschneider/NWS Alaska Region allowing rapid ERA5 regional analysis is invaluable for my work.
The autocorrelation of the March-April precipitation 1908-2017 is not statistically significant at any lag.
Statistics fans will recognize this as bootstrapping: sampling with replacement


"Something different". Those are ominous words. I read an atmospheric physicist saying he was verging on being terrified by what the models are forecasting and that the public hadn't been fully apprised yet. Some forecasts are showing very large sea level rises in the next 140 years. The Arctic is a planetary bellwether. We should all have our eyes on it.
Is this not from more moisture in the atmosphere due to global warming?