


Greenland Ice Sheet Update
Slow Start then Rapid Ramp-up to the Melt Season

The Greenland Ice Sheet is the last large holdout of the Pleistocene ice ages in the northern hemisphere, but like elsewhere in the Arctic changes are happening rapidly. The ice sheet holds enough water to raise global sea level by more than 7 meters (24 feet) were it all to melt, and already there’s enough fresh water flowing into the North Atlantic to potentially effect the Atlantic Meridional Overturning Circulation, an important feature of Earth’s climate system.
I’m in no way an expert on Greenland weather or climate or ice sheet physics. Most of what I know I’ve learned through my work with NOAA’s Arctic Report Card, which every year includes an update on what’s happening with the ice sheet. This post was inspired by a well meaning but misinformed soical media post on ice sheet melt late in June (see the Postscript below for details).
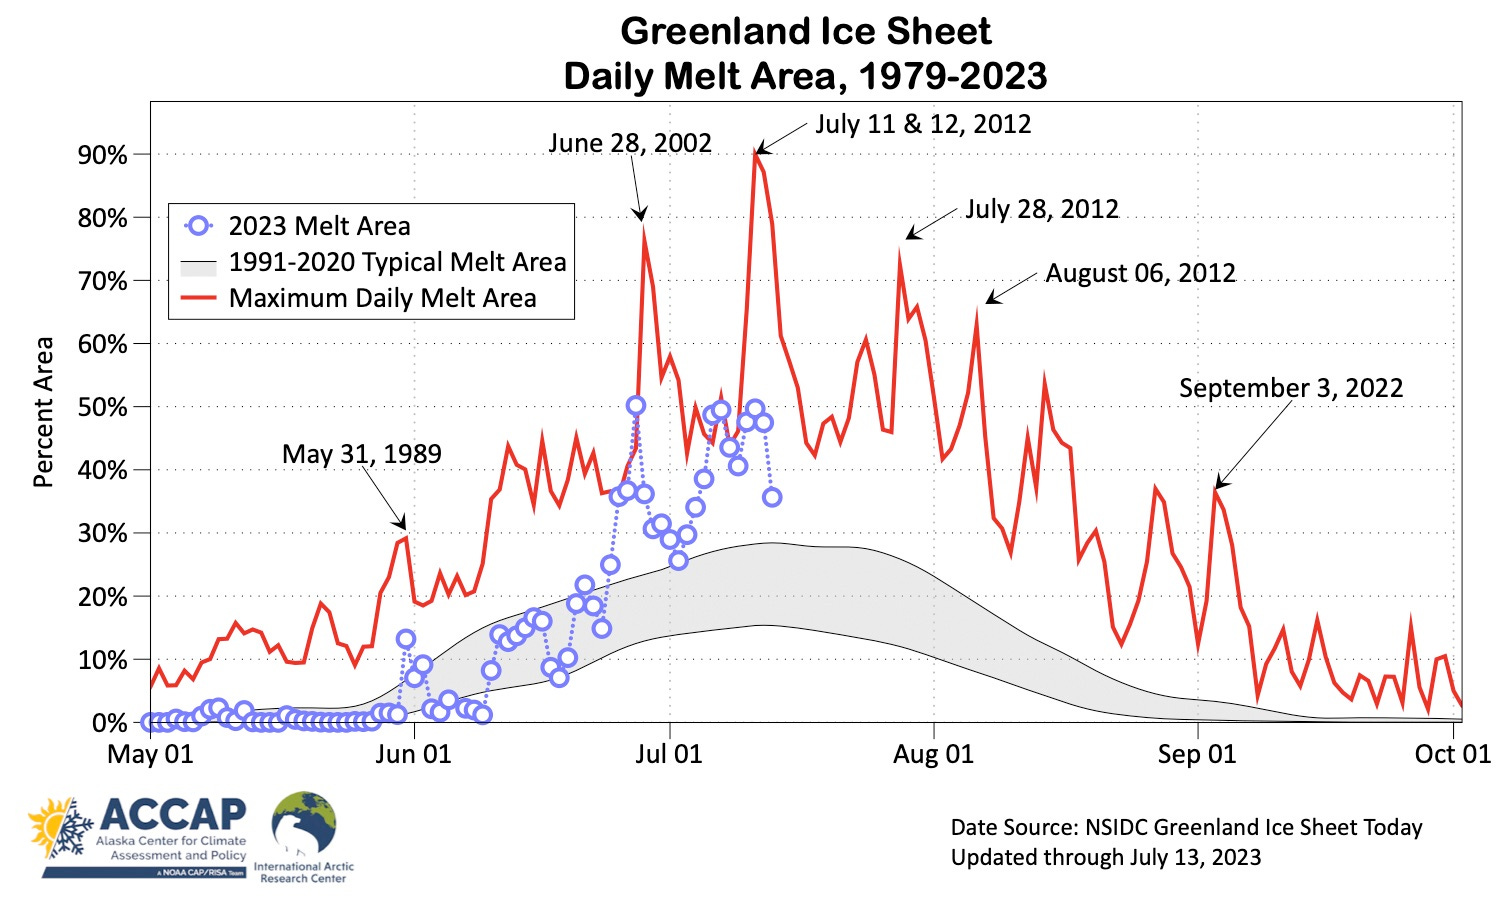
A common satellite-based measure of daily summer conditions on the Greeland Ice Sheet is the area that experiences melting conditions each day. In Fig. 1 I’ve ploted the 2023 daily melt, the 1991-2020 “typical” melt area and the highest daily values 1979-2022, all as a percentage of the total ice sheet area. For reference I’ve also annotated the monthly maximums. This year had a somewhat slow start to the melt season in late May and early June, but melt then area increased to “near normal” and just after Solstice melt area increased dramatically had has remained way above average since then.
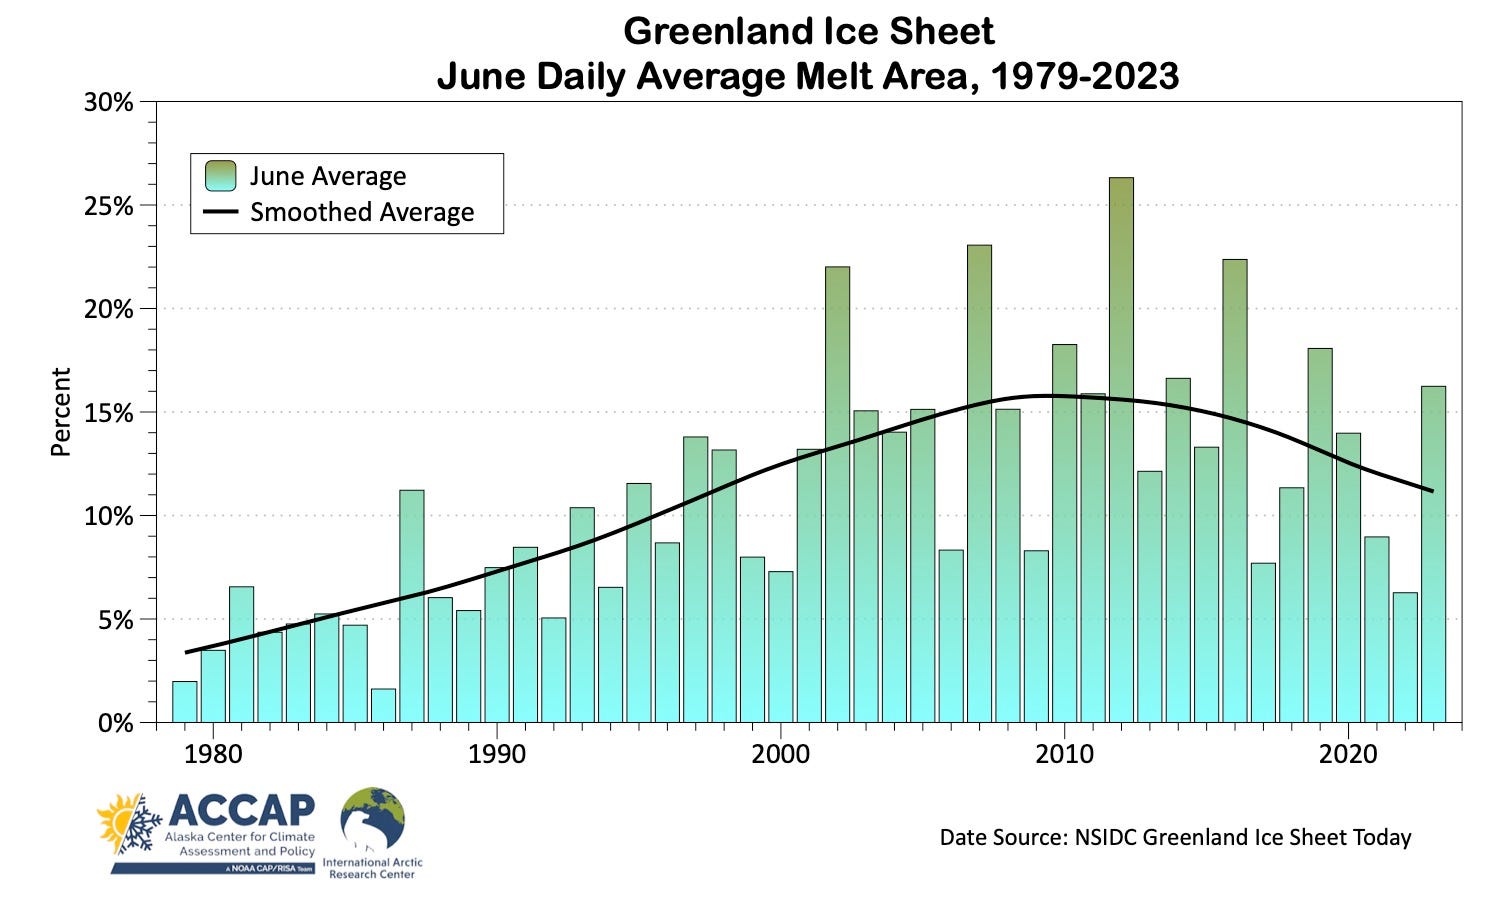
The average daily June melt area each year 1979 through 2023 is shown in Fig. 2. This year, the average daily June melt area was just over 16 percent of the ice sheet, the highest since 2019 and more than double the pre-2000 average of around 7 percent.
Another commonly used metric to assess summer melting is the number of days per season with melting conditions. Figure 3 shows the number of days in 2023 (through July 13th) with melting conditions. While melt area is way above normal, there is a still a significant part of the ice sheet that has had either zero or one day with melting conditions. When interpreting any spatial graphic for Greenland it’s important to remember than much of the Greenland Ice Sheet is at elevations above 2km (6500 ft) MSL with smaller area near the center of the ice sheet above 3k (9800 ft) MSL.

Melting is one way that the Greenland Ice Sheet changes. The difference between snowfall and runoff is tracked through the Surface Mass Balance, which can be estimated on a daily basis and Fig 4. shows this for the current season.1 The blue spikes during the cold season represent significant snowstorms. Late May and early June were unusually snowy, with the ice sheet continuing to add mass several weeks later than usual. But since the end of June mass loss has been mostly well above normal. The surface mass balance is just one way the Greenland Ice Sheet changes. Another is through the calving of ice bergs and the melting of glacier fronts directly by contact with ocean water.

Postscript
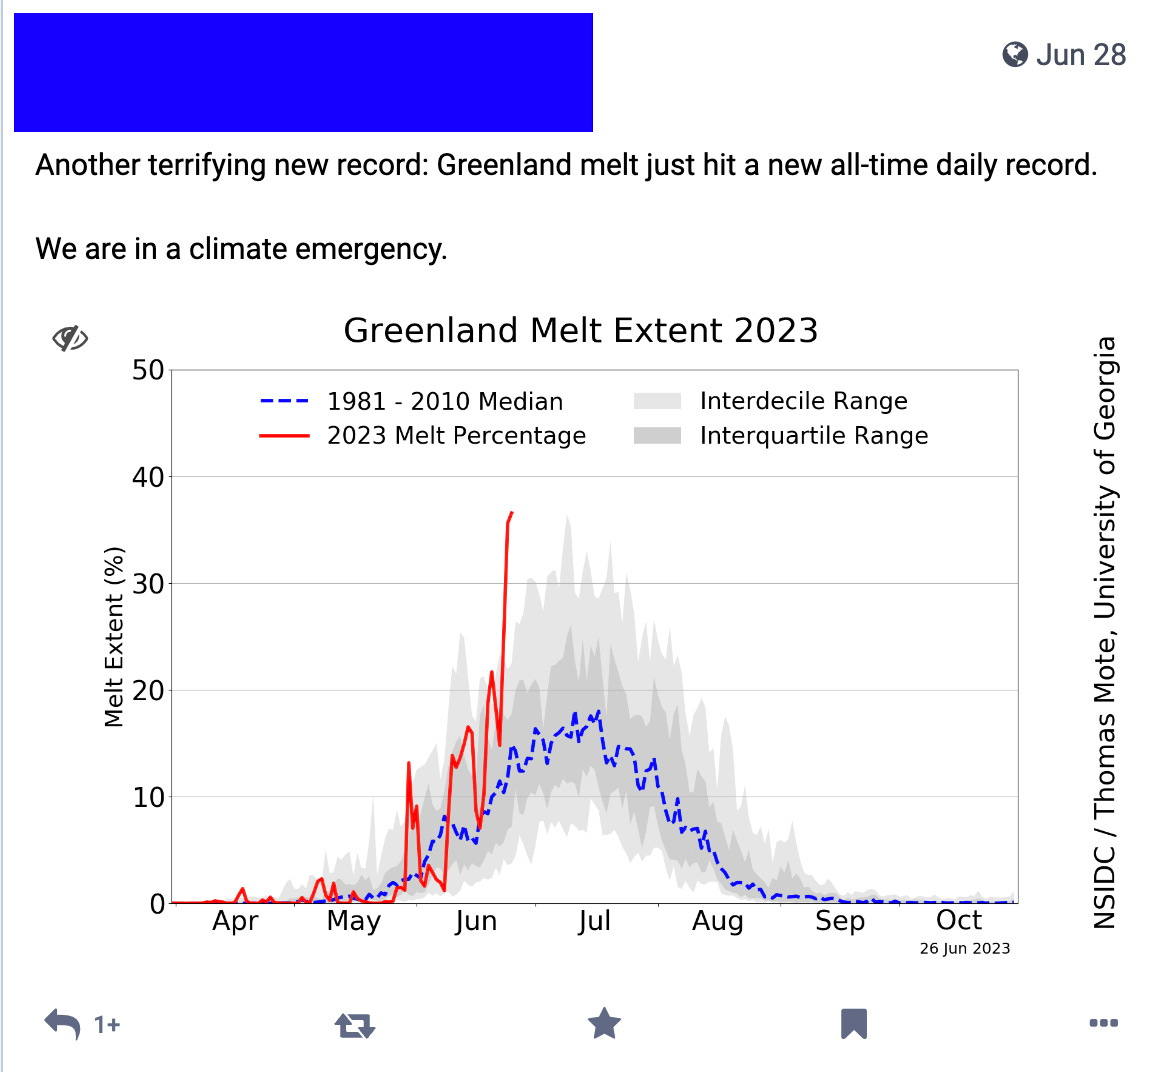
The social media post in Fig.5 got me looking into the Greenland Ice Sheet monitoring. The graphic in the post is from the NSIDC “Greenland Today” webpage and is updated daily. You’ll immediately see the mismatch between the statement “Greenland melt just hit a new all-time daily record” and the information in the graphic: the graphic does not contain any information about daily records.
There are three statistics plotted plus the current year’s daily values (red solid line): the 1981-2010 median (blue dashed line) and in two gray shades with the interquartile (25-75 percentile) range and interdecile (10-90 percentile) range. The daily extremes (max or min) are not plotted. With 44 years of data, that means that by construction there are four days per date that are higher than the top of the interdecile range and four lower than bottom of the interdecile range (constrained by zero). This was the impetus for me to construct the graphic in figure 1, which does show the daily maximum.
Technical:
I use two main sources for near-real time Greenland Ice Sheet monitoring:
National Snow and Ice Data Center’s “Greenland Ice Sheet Today” page is here and this includes images and data access as well as monthly text summaries for conditions.
The Danish Meteorological Institute’s Polar Portal has a Greenland page here, also with images and data.
For annual overviews of Greenland Ice Sheet conditions and the larger climate change context, both the NOAA Arctic Report Card, published in December each year, and the State of the Climate published in late summer each year by the American Meteorological Society are readily available and not too technical.
By convention the Greenland Ice Sheet “Water Year” runs from September 1 to August 31.
Very good review and reinterpretation. Thank you.
Great overview!