


February 2025 Alaska Climate Summary
Mostly Mild and Dry for late Winter

This is the Alaska summary for February. I’ll have the Arctic and Alaska climate summary for winter 2024-25 once the ERA5 reanalysis for February becomes available.
***ERA5 graphics for temperature and precipitation added March 4, 2025***
Temperature
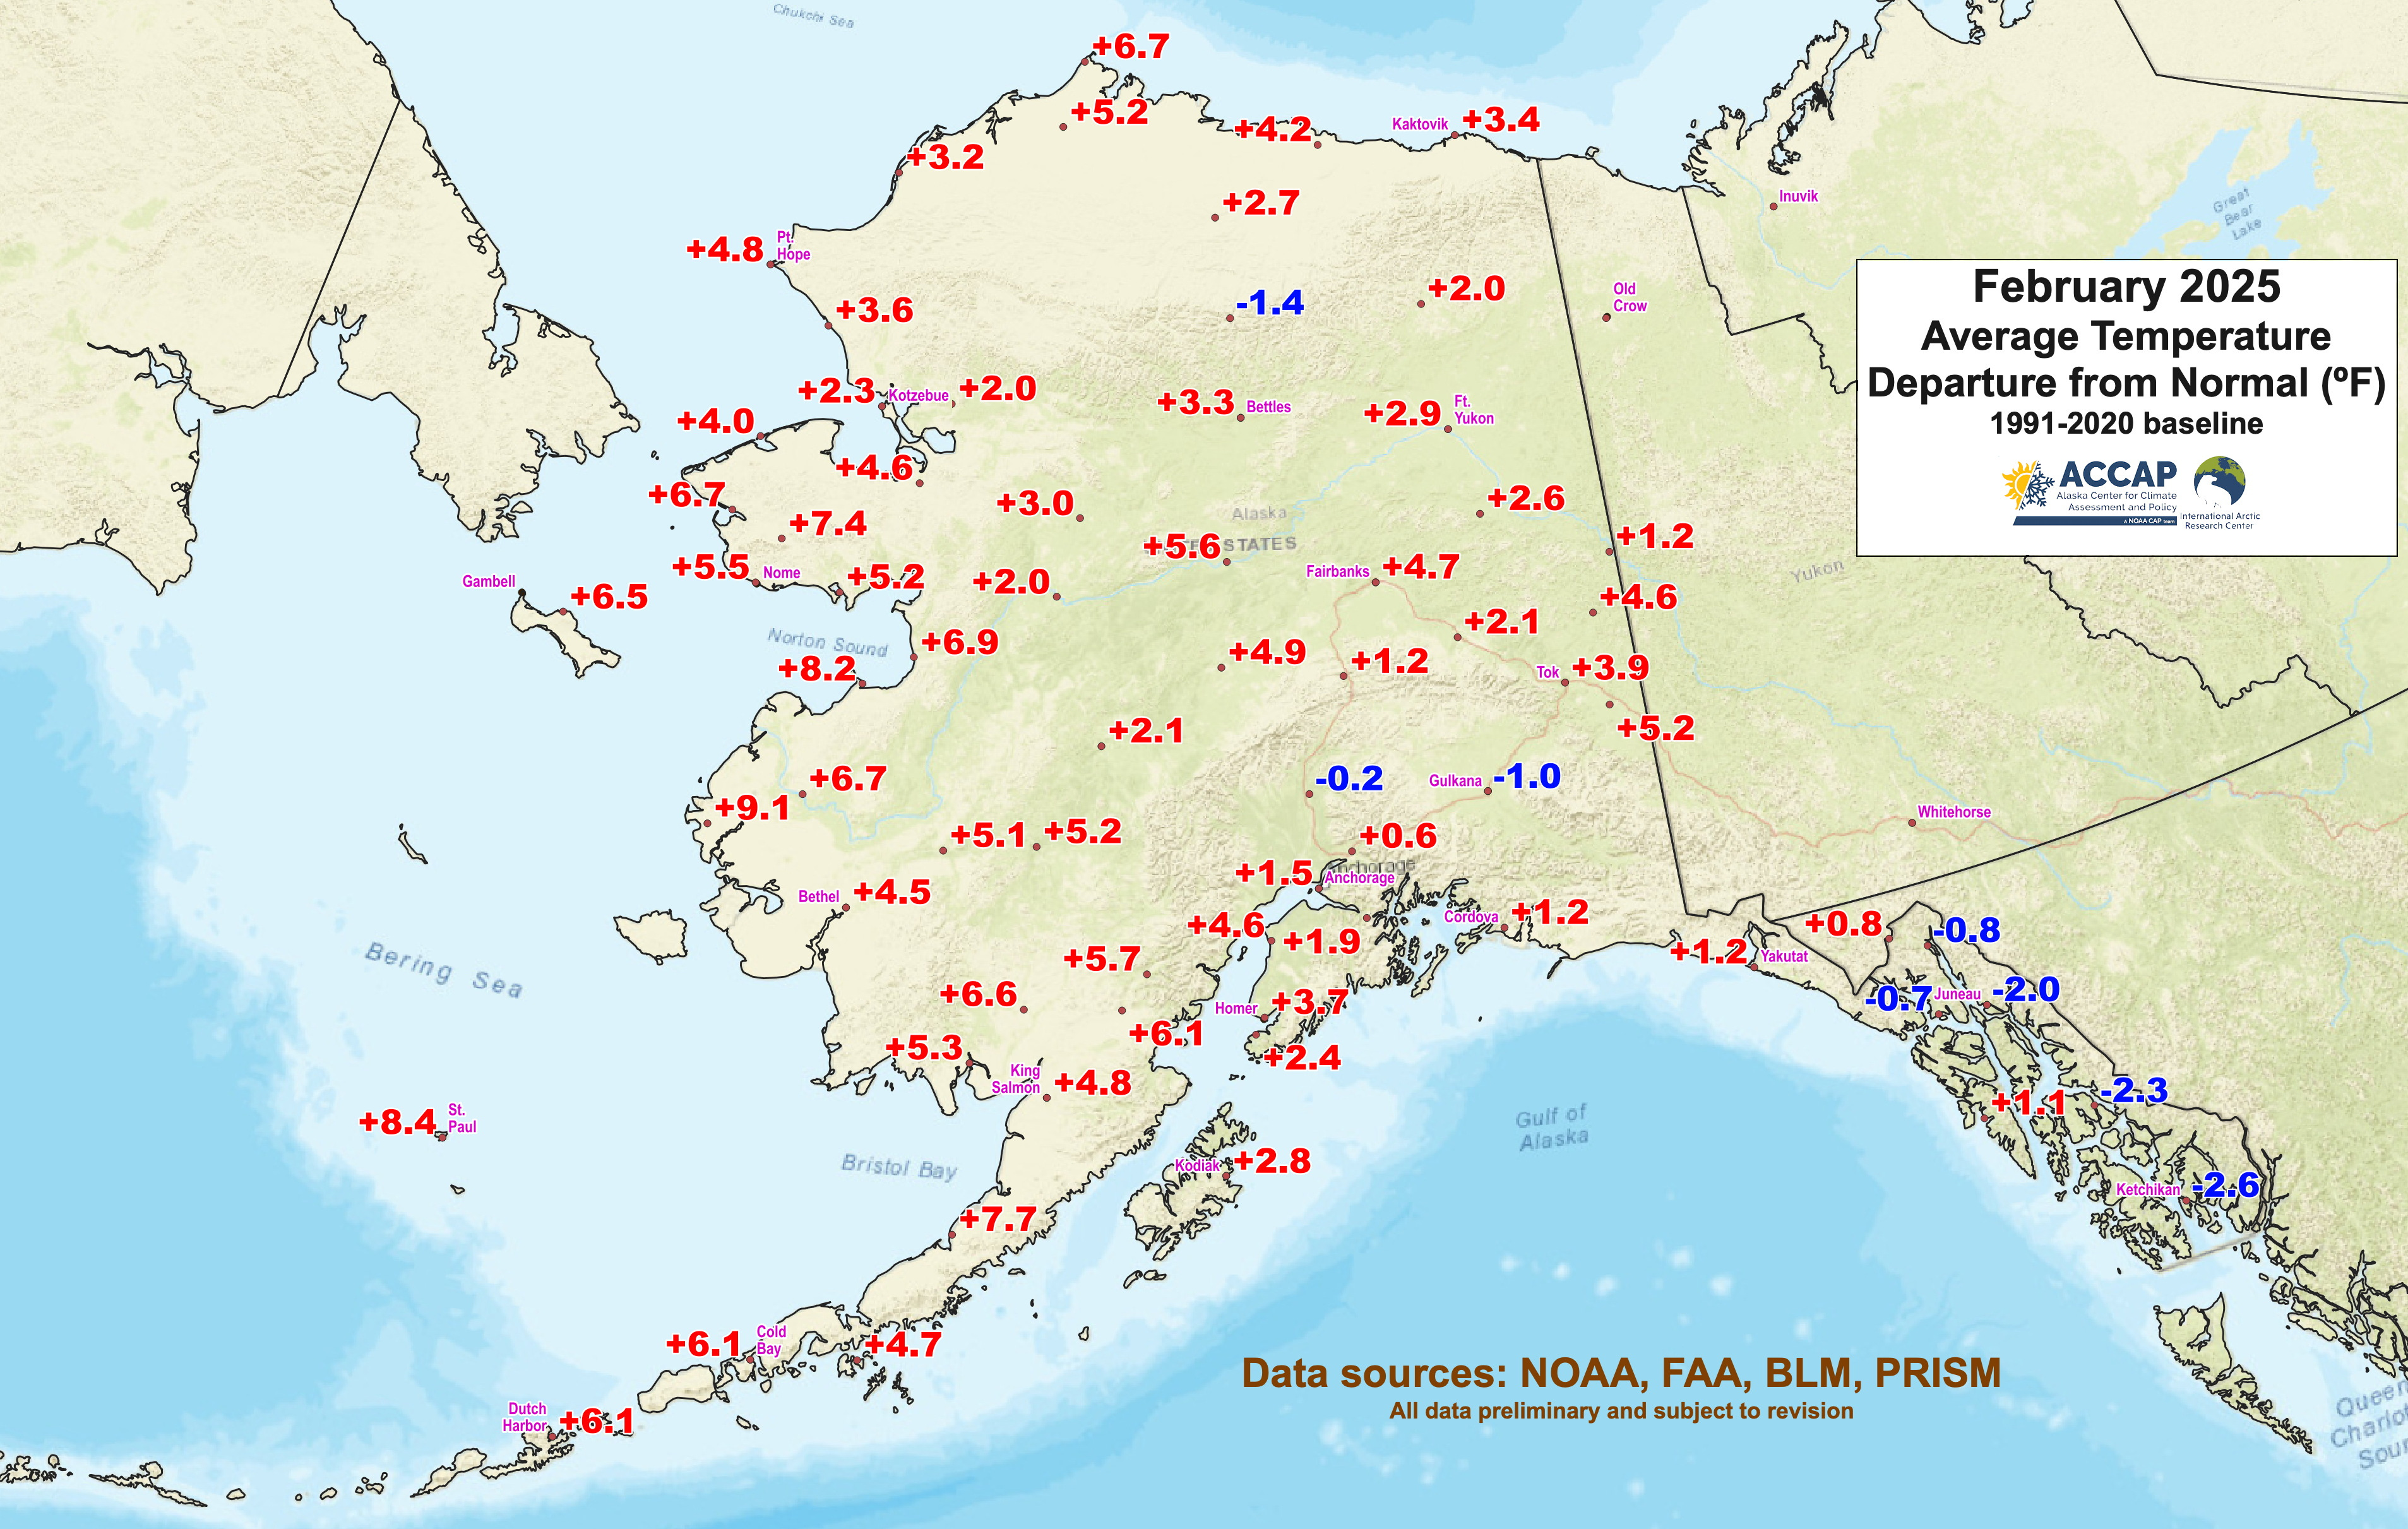
Temperatures for February were overall generally above the 1991-2020 baseline normal, though not as dramatically so as in January (Fig. 1). Additionally, February saw the return of a common dichotomy, with a significant west-to-east difference in departures. In February, temperatures in western Alaska averaged well above normal, while much of Southeast was near to a bit below normal for the month as a whole.
At Cold Bay, the average temperature of 36.3F (+2.4C) this was the third highest for February on record, and at St. Paul the average temperature of 33.7F (+0.9C) was the fifth highest, and this was only the sixth February in the past 110 years with an average temperature above freezing. In contrast, the coolest places (relative to normal) in Southeast Alaska had the coolest February only since 2021.

The Alaska Statewide Temperature Index was above zero, indicating above normal temperatures for the state overall, on 22 of the 28 days during the month. There were nine new record high temperatures set at long term climate sites around the state, which is significant, but far short of the more than 40 daily records set in January. Unsurprisingly, there were no new daily record lows set in February.
Reported temperatures extremes during the month were, by February standards, fairly tame. The highest reliable temperatures appears to be 51F (10.6C) at the Port Alsworth Climate Reference Network Station on the 18th and the lowest -45F (-42.8C) at Arctic Village on the 1st.1
Precipitation and Snow
February was quite dry in many areas (Fig. 2), but especially in Southcentral and southwest Alaska. Anchorage airport’s total of 0.05 inches (1.3mm) is the lowest on record for February. Homer reported just 0.20 inches, the lowest February total since 1979. King Salmon’s total of 0.14 inches was the third lowest February total of record. There were a few areas that had near to even a little above normal precipitation for the month, including the Fairbanks and Nome areas. In both regions, one event was responsible for the bulk of the monthly total.


As you would expect with low precipitation in February, snowfall totals over most of the state were also quite low. The comparatively few locations with reasonably complete observations are plotted in Fig. 3, and there are data quality problems with a few of the reports.

In the central and southeast Interior, snow totals were not too different from normal, but in Southcentral it really was a low snow month. Several locations in the Palmer area reported no measurable snow at all. Anchorage Airport reported only 0.3 inches (0.8cm) of snow during the month, which ties with February 2003 for the lowest snowfall of any winter month in the past 75 years. The Alyeska cooperative climate station in Girdwood reported only 2.1 inches (5.3cm) for the month, compared to the February normal of nearly 37 inches (92.7cm). This is the lowest February snow total since climate observations began there in the 1960s. Low snowfall in Southeast Alaska near sea level during a winter month is not unusual, but particularly in the Juneau area it was especially low. The Juneau airport reported only 0.1 inches (0.3cm) of snow for the month, the lowest February total since 1977, and the NWS Forecast Office in the Mendenhall Valley saw only a trace total. The Haines total snowfall of just 1.1 inches was the lowest February snowfall since the precipitation-free February of 1989.
Sea ice and sea surface temperature
Sea ice in the Bering Sea during February was quite variable, with a dramatic drop in extent the middle month and an equally dramatic rebound at the end of the month. The pack ice edge finally reached the north side of St. Matthew Island at the end of February, more than five weeks later than last year and seven weeks later than in 2022. The daily average extent for the month (Fig. 4) was the fourth lowest in the past 47 years.

February average sea surface temperature (SST) departures from the 1991-2020 normal are shown in Fig. 5. Unsurprisingly, SSTs south of the retracted sea ice edge were substantially above normal. In Bristol Bay and the southeast Bering Sea, average SSTs in February were the highest since 2016, which was the peak year of the “Blob-inspired” marine heatwave in the Bering Sea (see Walsh et. al. 2018, here, for Alaska details). The Gulf of Alaska sea surface temperatures were near to a bit above normal and not as warm as February 2016.

Technical details:
Site-specific climate statistics and factoids and the snowfall graphic from NOAA Regional Climate Center’s ACIS website here. Monthly temperature departures from normal use the published NOAA/NCEI 1991-2020 values whenever available. For most of the FAA airport stations there are no published normals, so derived 1991-2020 normals were constructed from the 1981-2010 PRISM data (Oregon State University) by B. Brettschneider.
The High Plains Regional Climate Center mapping tool is available here.
AMSR2 microwave data is from the Advanced Microwave Scanning Radiometer 2 on JAXA's Global Climate Observation Mission - Water 1 (GCOM-W1) satellite at 10km² by 10km² horizontal resolution. The University of Bremen AMSR2 landing page with links to near real-time data in a variety of formats is here.
Sea surface temperatures from the OISSTv2.1 database available from NOAA here.
Lower temperatures were reported on February 1 from both Wiseman and Chicken. However, both of these sites are cooperative stations that make their once-a-day climate observation at or before 9am local time. In this case, the lowest temperatures reported on the February 1 observations occurred on January 31 after the time of the daily observation.
A reassuringly "normal" February
If that word has much meaning anymore. It will be interesting to see what the February wrap up will look like 10 years from now.