


Arctic Seasonal Sea Ice Trends
Significant regional differences

Sea ice extent in the Arctic continues its seasonal decline, with the minimum extent typically occurring in the second or third week in September. As of August 20 the pan-Arctic extent was the 4th lowest for the date since 1979 in both the Japan Aerospace Exploration Agency (JAXA) and National Snow and Ice Data Center (NSIDC) data.
For much, but not all of the Arctic, late summer and early autumn have shown the greatest decreases in sea ice extent. This post looks at trends in sea ice extent since autumn 1978, when we have (near) daily satellite based estimates of extent.
Pan-Arctic trends
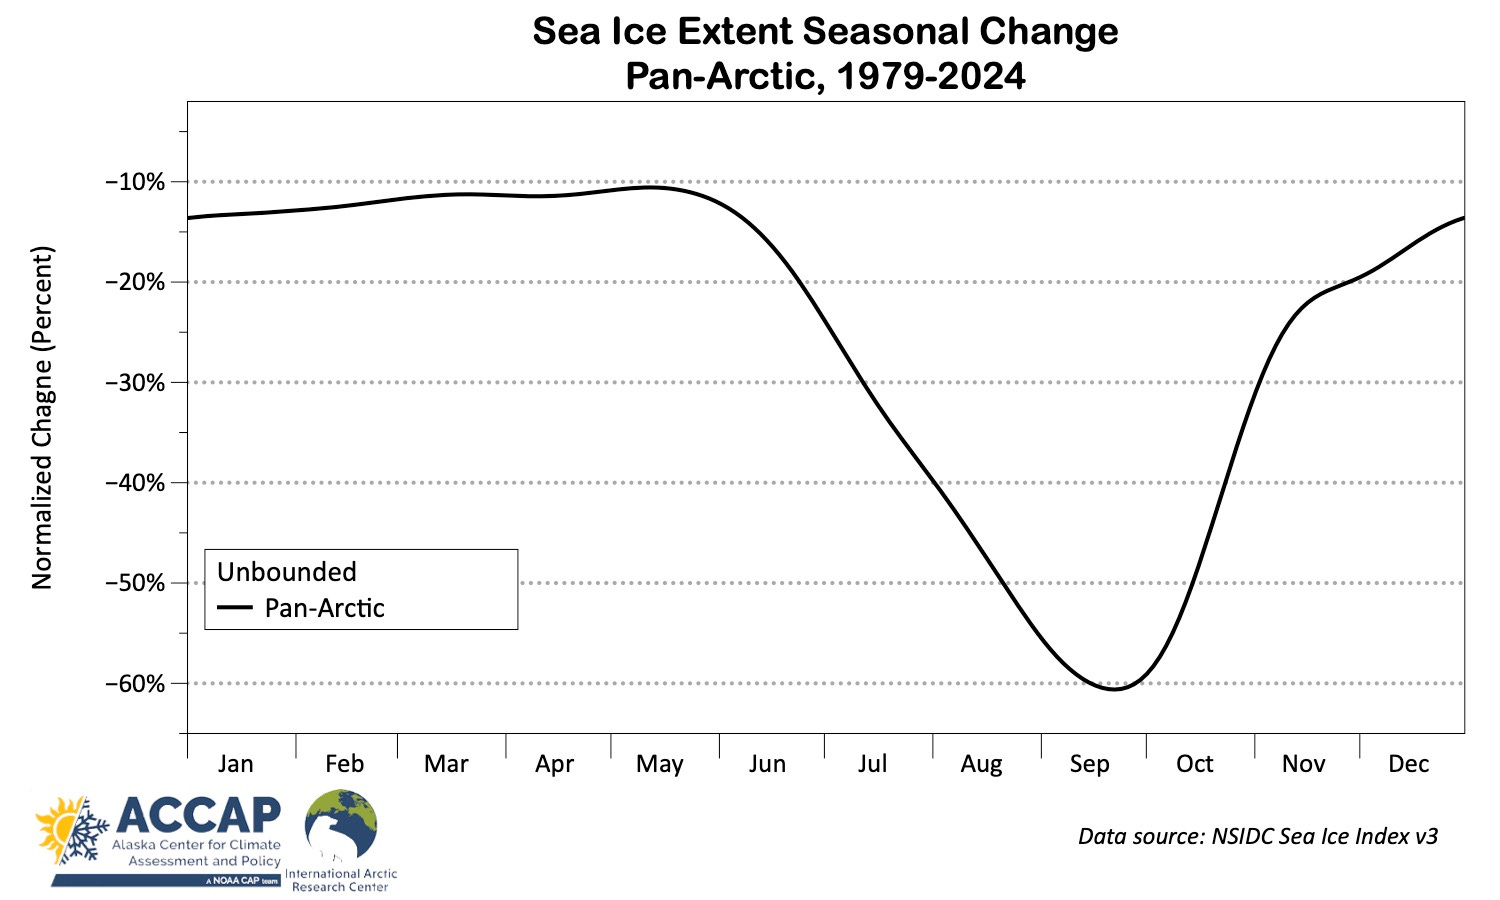
Sea ice extent in the northern hemisphere contracts in the spring and summer and expands in the fall and winter. In the 1980s, the typical end-of-summer (September) extent was a little less than half of the typical end-of-winter (March) extent. In the past decade, the average September extent is typically only about one third of the average March extent, because ice extent declines have been much greater in the summer than in the winter. Figure 1 illustrates the seasonally of the change in extent using the daily sea ice extent data from NSIDC. In order to make this a fair comparison across the year, I plot the percent change relative to typical ice extent (see the technical details below for an in-depth explanation). This adjustment is important because of the large change in extent in the course of the year.1
Per Fig. 1, during the winter and spring sea ice extent has decreased an (adjusted) 10 to 15 percent since 1979. But starting in early June the loss accelerates, reaching a maximum level in late September before starting the climb back to the more modest loss levels of winter.
Arctic Ocean regions
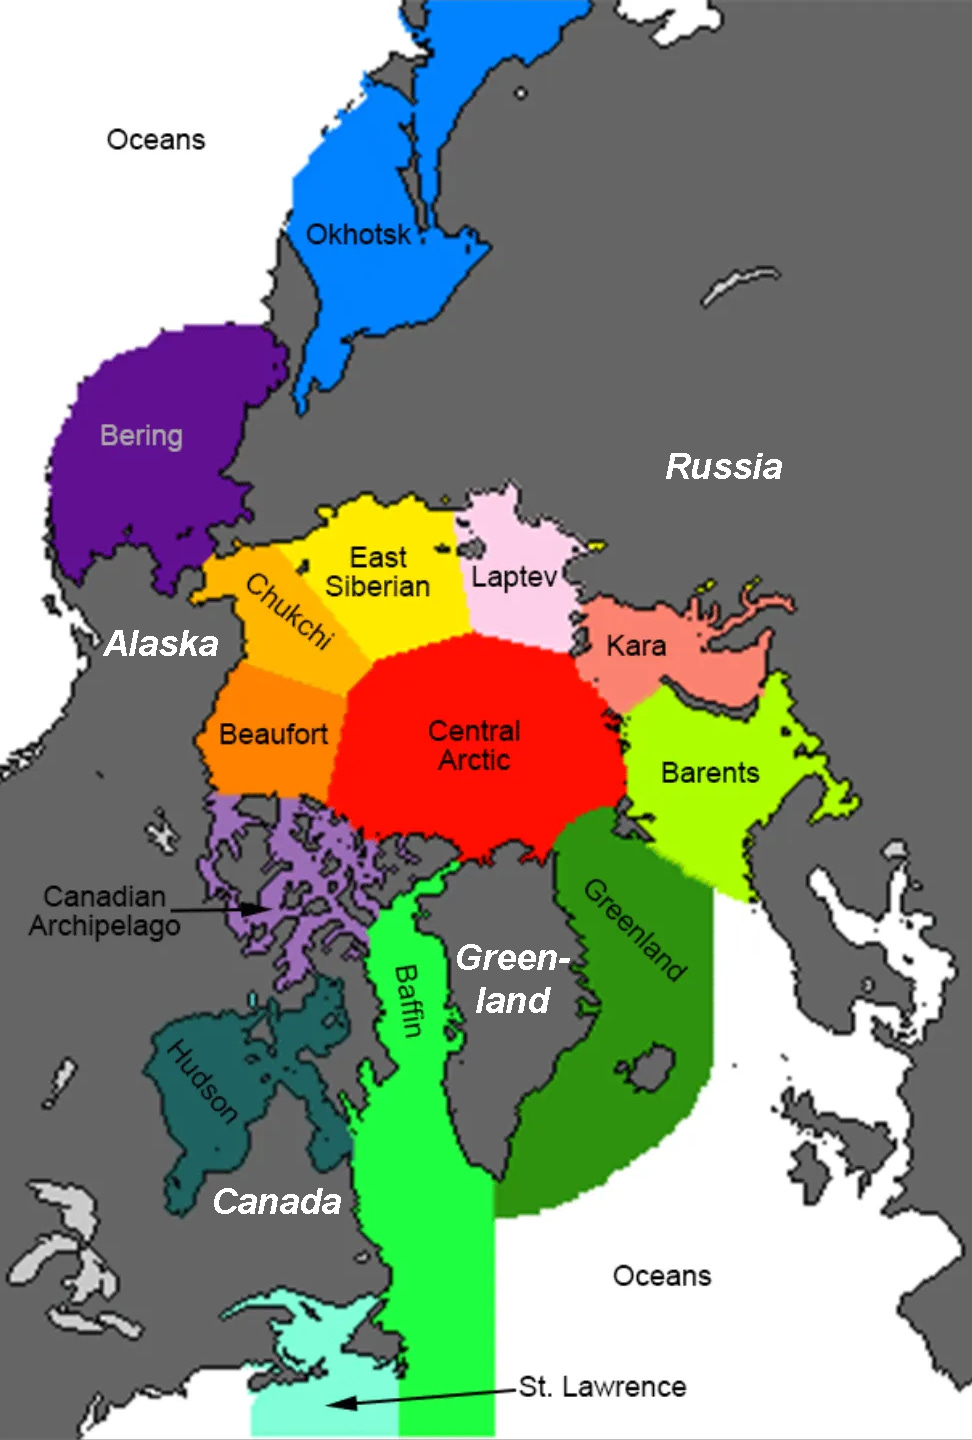
We can readily do the same analysis for Arctic subregions as NSIDC usefully provides a breakout of the daily ice extent in the Arctic basin regions shown in Fig. 2. These regions do not generally correspond to the widely used International Hydrographic Organization’s “Limits of Oceans and Seas”. Of particular importance here is that the “Central Arctic” region, for sea ice analysis purposes, is only a fraction of the IHO definition of the Arctic Ocean and the Laptev, East Siberian, Chukchi and Beaufort Seas all extend considerably farther north than the IHO definitions.
When we do this, we find some interesting regional differences, but when interpreting these changes it is important to note that some basins are bounded in the sense that in the current (and recent past) climate, sea ice of 15 percent or higher concentration typically (or, so far, always) covers the the entire basin for part of the year.
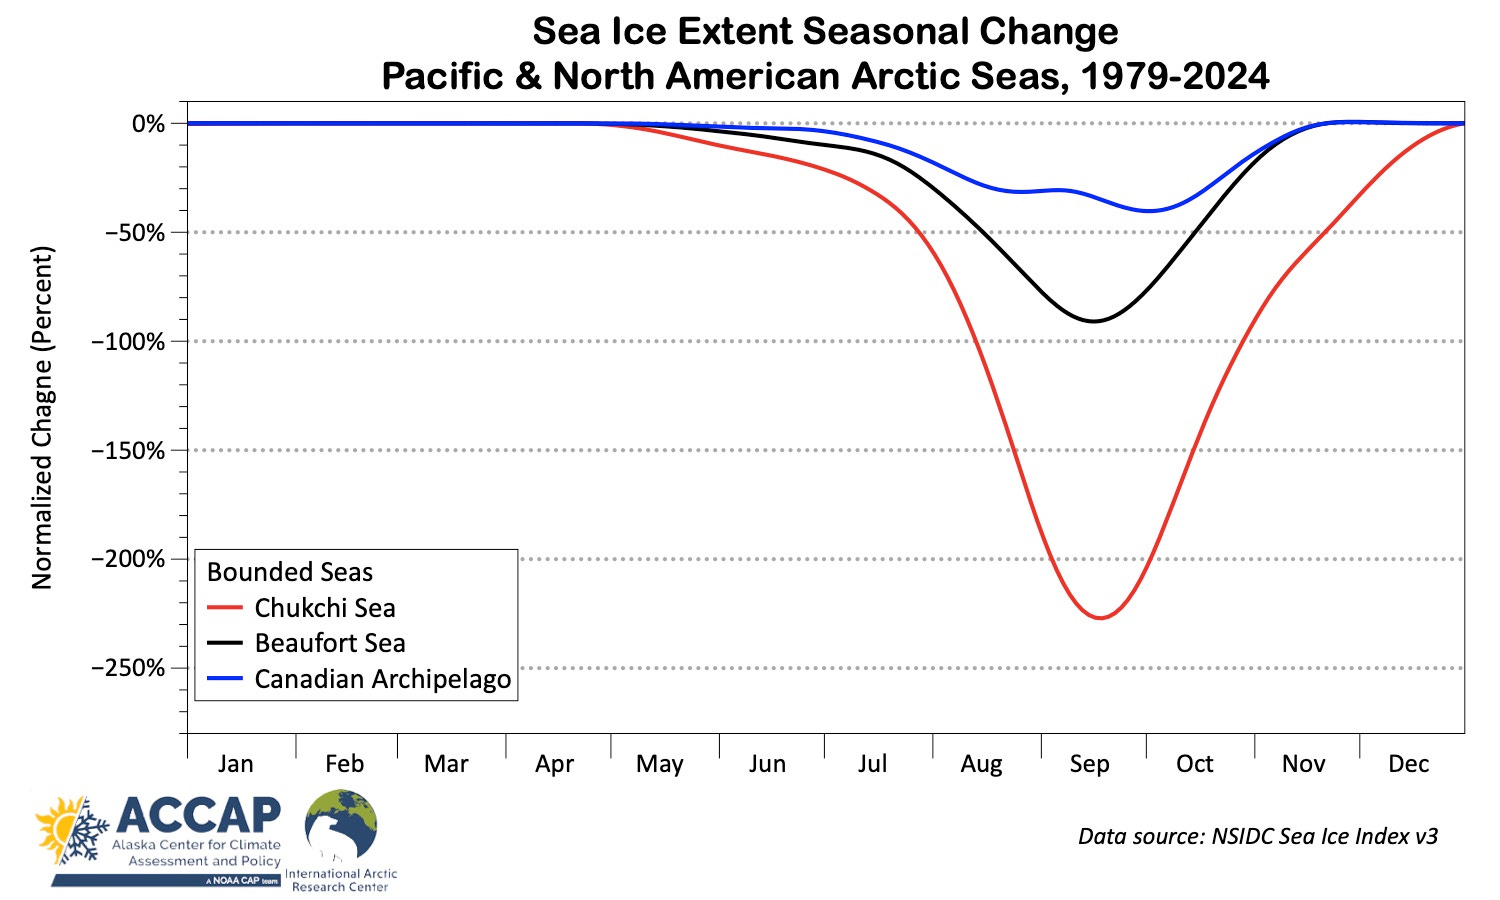
Starting on the Pacific/North American sector, Fig. 3 plots the 46-year changes in the Chukchi and Beaufort Seas and the Canadian Arctic Archipelago. Here the big standout is the much discussed collapse of late summer and autumn sea ice in the Chukchi Sea. Large decreases have also occurred in the Beaufort Sea but are confined to a shorter window in the autumn.
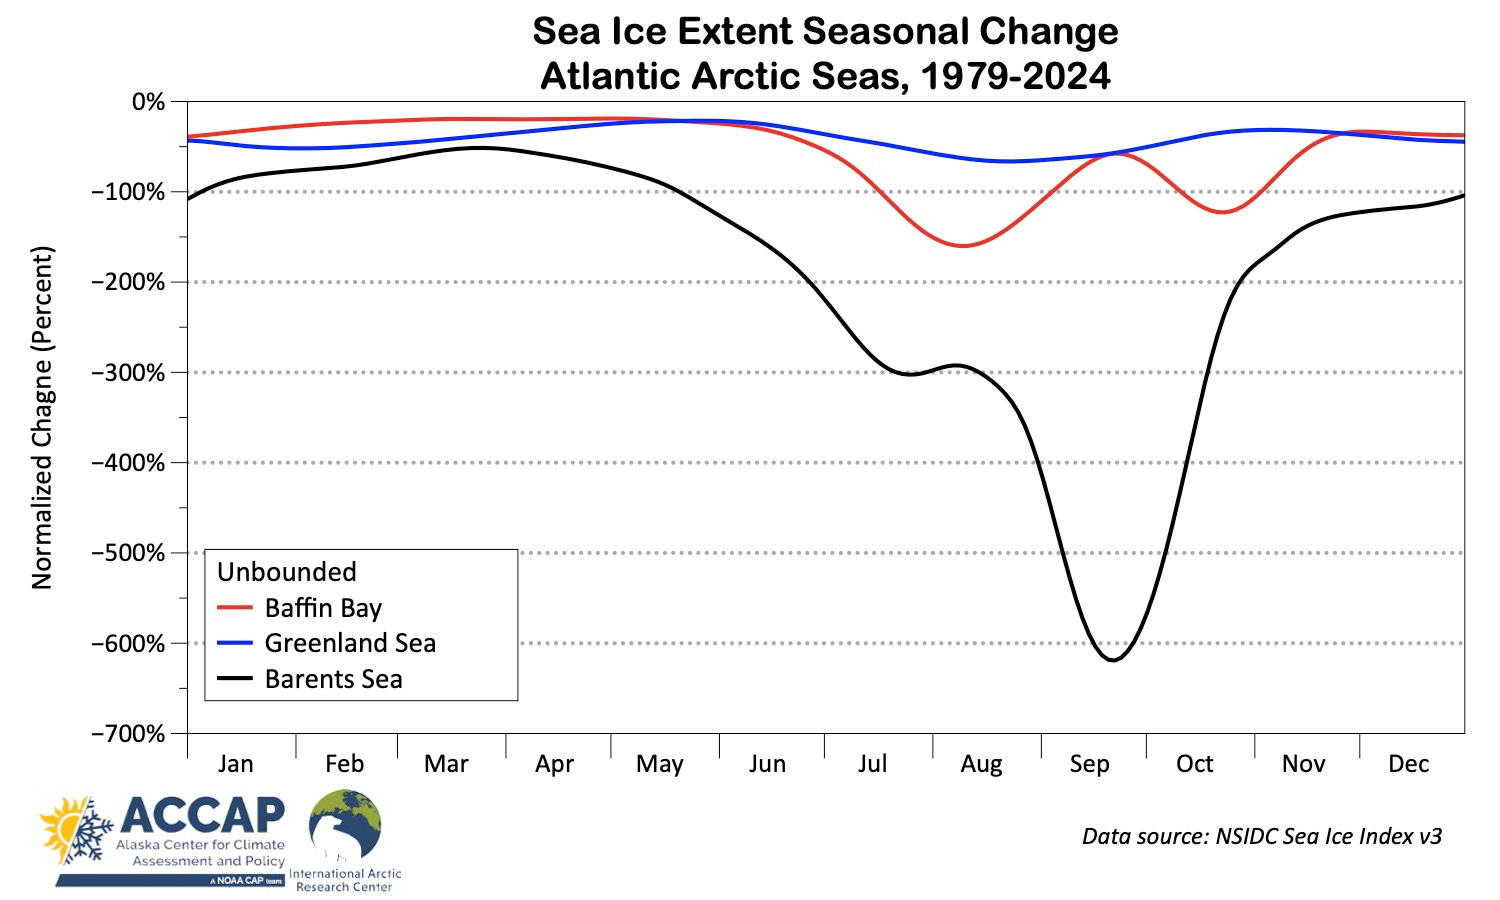
The Atlantic sector seas, Fig. 4, are functionally unbounded, in that sea ice does not typically (or ever) cover the entire basin, and trends in sea ice extent are different in important aspects from most of the bounded seas.
The huge change in the Barents Sea August to October reflects historically high year-to-year variability of summer ice extent and nowadays the almost complete loss of sea ice in late summer and early autumn. The Greenland Sea does not show a clear seasonal signal: decreases in late winter are about the same scale as late summer. Baffin Bay, between Greenland and northeast Canada, shows a “double dip” maximum in decreases, one in August and then another in October. I’m not familiar enough with sea ice processes in the Baffin Bay region to speculate on reasons for this, though I do note that the Barents Sea shows a month-long flattening of the trend in July and early August, so perhaps there are larger scale regional factors.
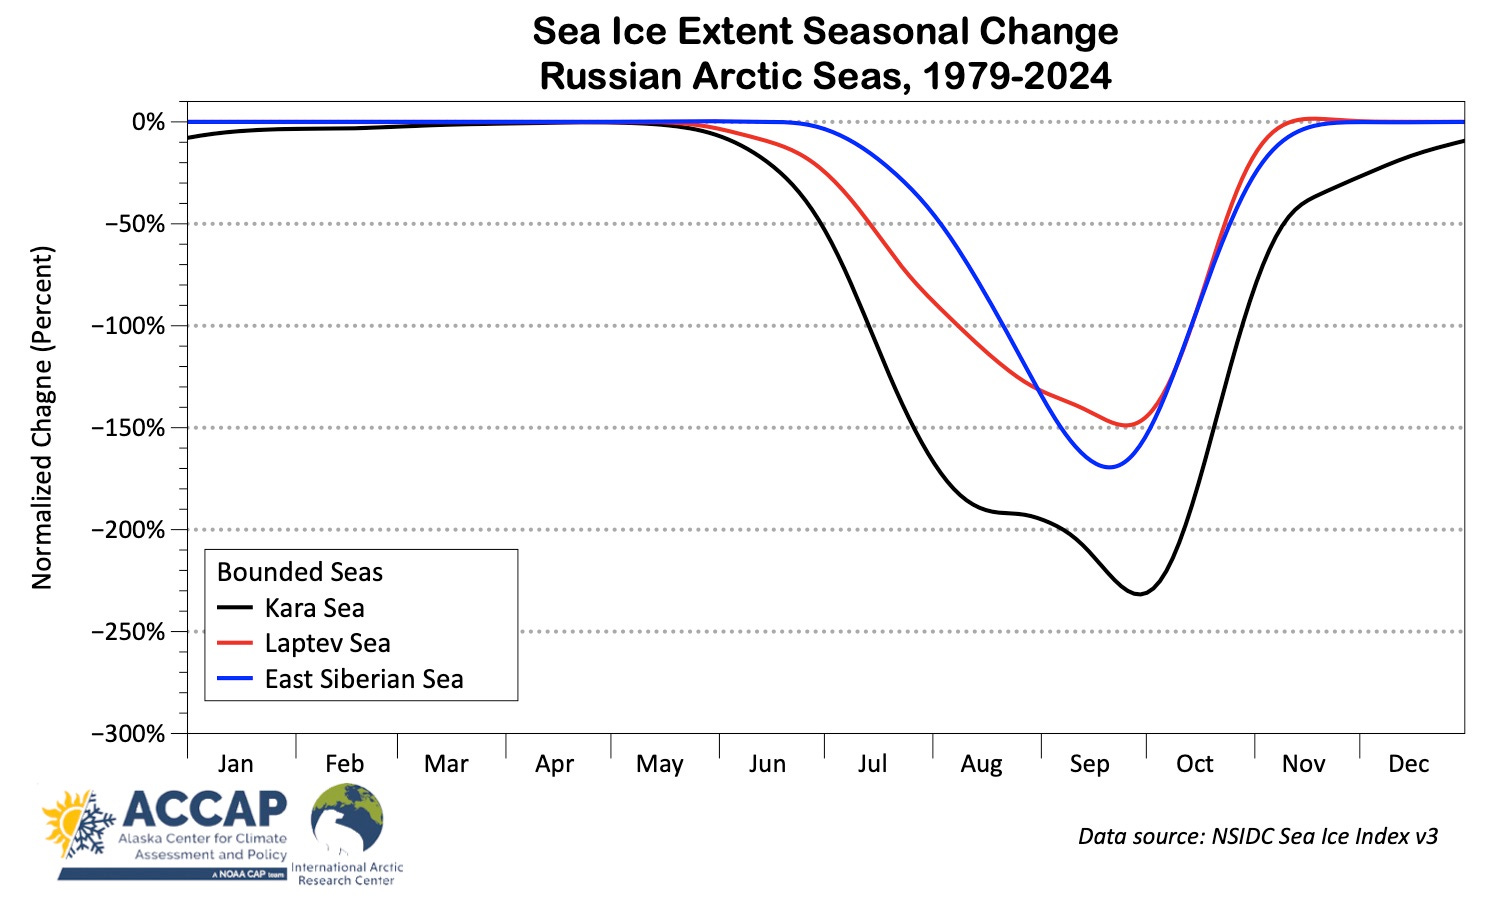
Seasonal changes in sea ice extent in the Russian Arctic seas (Fig. 5), which are all bounded, look a lot like the Pacific/North American sector, with a fairly sharp late summer maximum decrease. However, the Kara Sea, like its western neighbor the Barents Sea, shows a pause in the rate of decrease in late summer before the maximum loss at the end of September/early October.
Technical details:
In this post, pan-Arctic sea ice means any sea ice in the Northern Hemisphere, which in spring may include ice in ocean areas south of 50°N in the Gulf of St. Lawrence and the Sea of Okhotsk.
JAXA sea ice extent data is available here and NSIDC Arctic sea ice data is available here.
Extent change plots the daily linear regression change (annual rate of change times 46 years) divided by the median daily ice extent. For maximum clarity, the daily values have been lightly smoothed by locally estimated scatterplot smoothing (LOESS).
For brevity I have not plotted the seasonal change plot for the Central Arctic basin, as so far ice extent trends are confined to later summer and early autumn and are quite modest (less than normalized 15 percent change). This will of course change in the coming decades.
For a non-climate analogy, consider losing $1. If you have $100, maybe that’s not a big deal: you still have $99. But what if you lose $1 but only had $5 to begin with? In both cases the loss was $1, but it might be a much bigger impact if you start with much less.