
Arctic Regional Monthly Temperature Extremes
Easy today, but over time, it's complicated

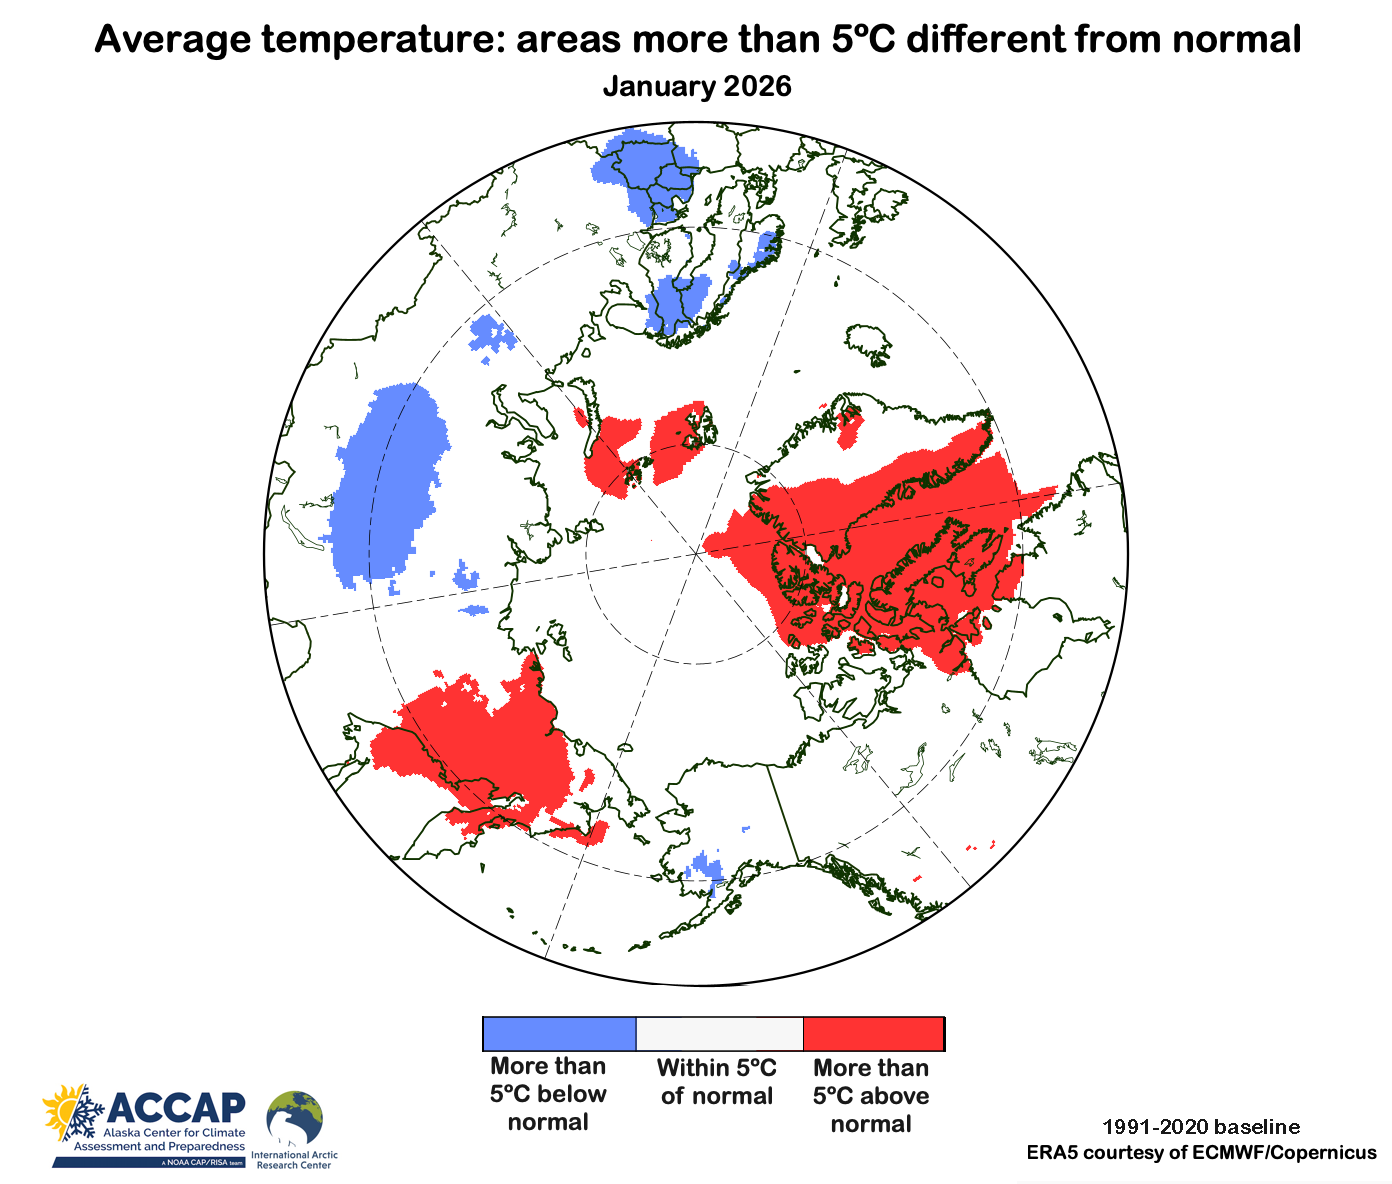
In the January 2026 climate summary I mentioned that almost a third of Arctic lands (land poleward of 60°N) had average temperatures that were more than 5°C different (higher or lower) than the 1991-2020 baseline average in the ERA5 reanalysis. Most of that occurred in western Greenland and eastern Nunavut, Canada and far eastern Russia, where January average temperatures were more than 5°C above the baseline average, but there were also smaller areas that were more than 5°C below the baseline in the northern Nordic Arctic, south-central Siberia and southwest Alaska (Fig. 1). When I wrote that, I thought that seemed like a lot, but it was just an impression.
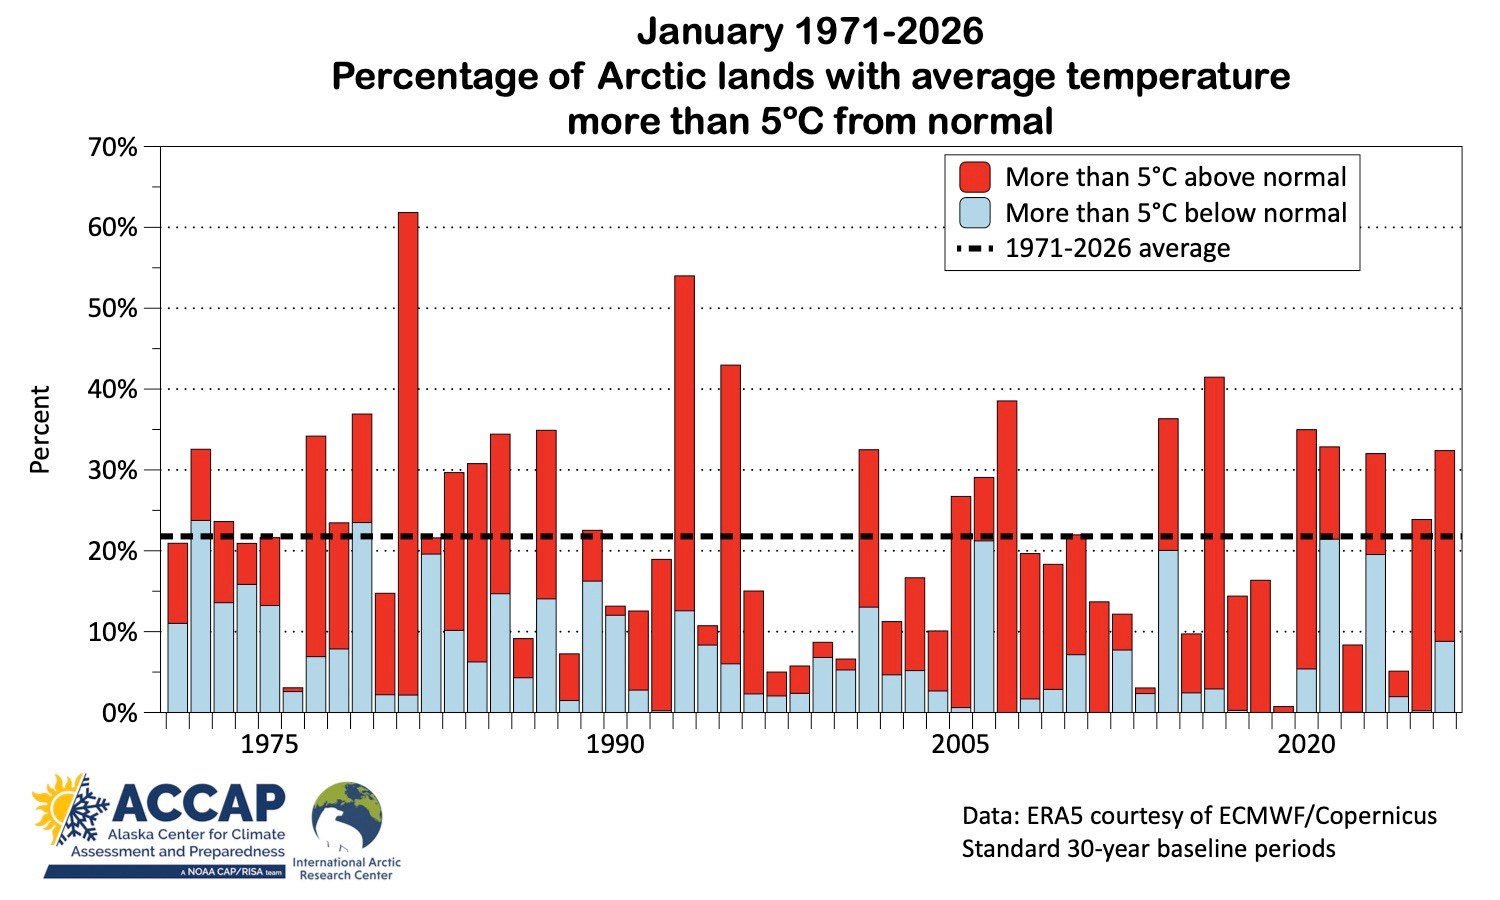
A reader asked if the overall area with this magnitude of large departures were excessively large or was increasing over time. So to put this in historical perspective, I constructed a time series (Fig. 2) of the fraction of Arctic lands where the January average temperature was more than 5°C above or below the applicable 30-year baseline (one way to account for the trend).1 In January 2026, more Arctic lands than usual saw average temperatures more than 5°C from the 1991-2020 baseline normal, but not dramatically so. Additionally, there isn’t a statistically significant trend over the past 56 Januarys in the area with departures this large. In most, but by no means all years, there is more area on the warm side than the cold side.
Of course, a 5°C threshold is completely arbitrary: a 5°C departure from normal in January is significant over most of the Arctic, but in July, when temperature variability is much lower than in mid-winter, a 5°C departure would be really remarkable.
A commonly used technique to account for this kind of temporal and spatial variability is to compare observed values relative to typical variability. For temperatures, this is easily done by dividing the difference from long term average of some baseline (say, 1991-2020) by the standard deviation of temperatures during the same baseline. In an ideal bell curve (Gaussian distribution), about two-thirds of the observations will be within one standard deviation of the average and 95 percent within two standard deviations. Unsurprisingly, actual temperature data often doesn’t conform very well to an ideal bell curve, but the concept remains useful as a way to account for local climatology.
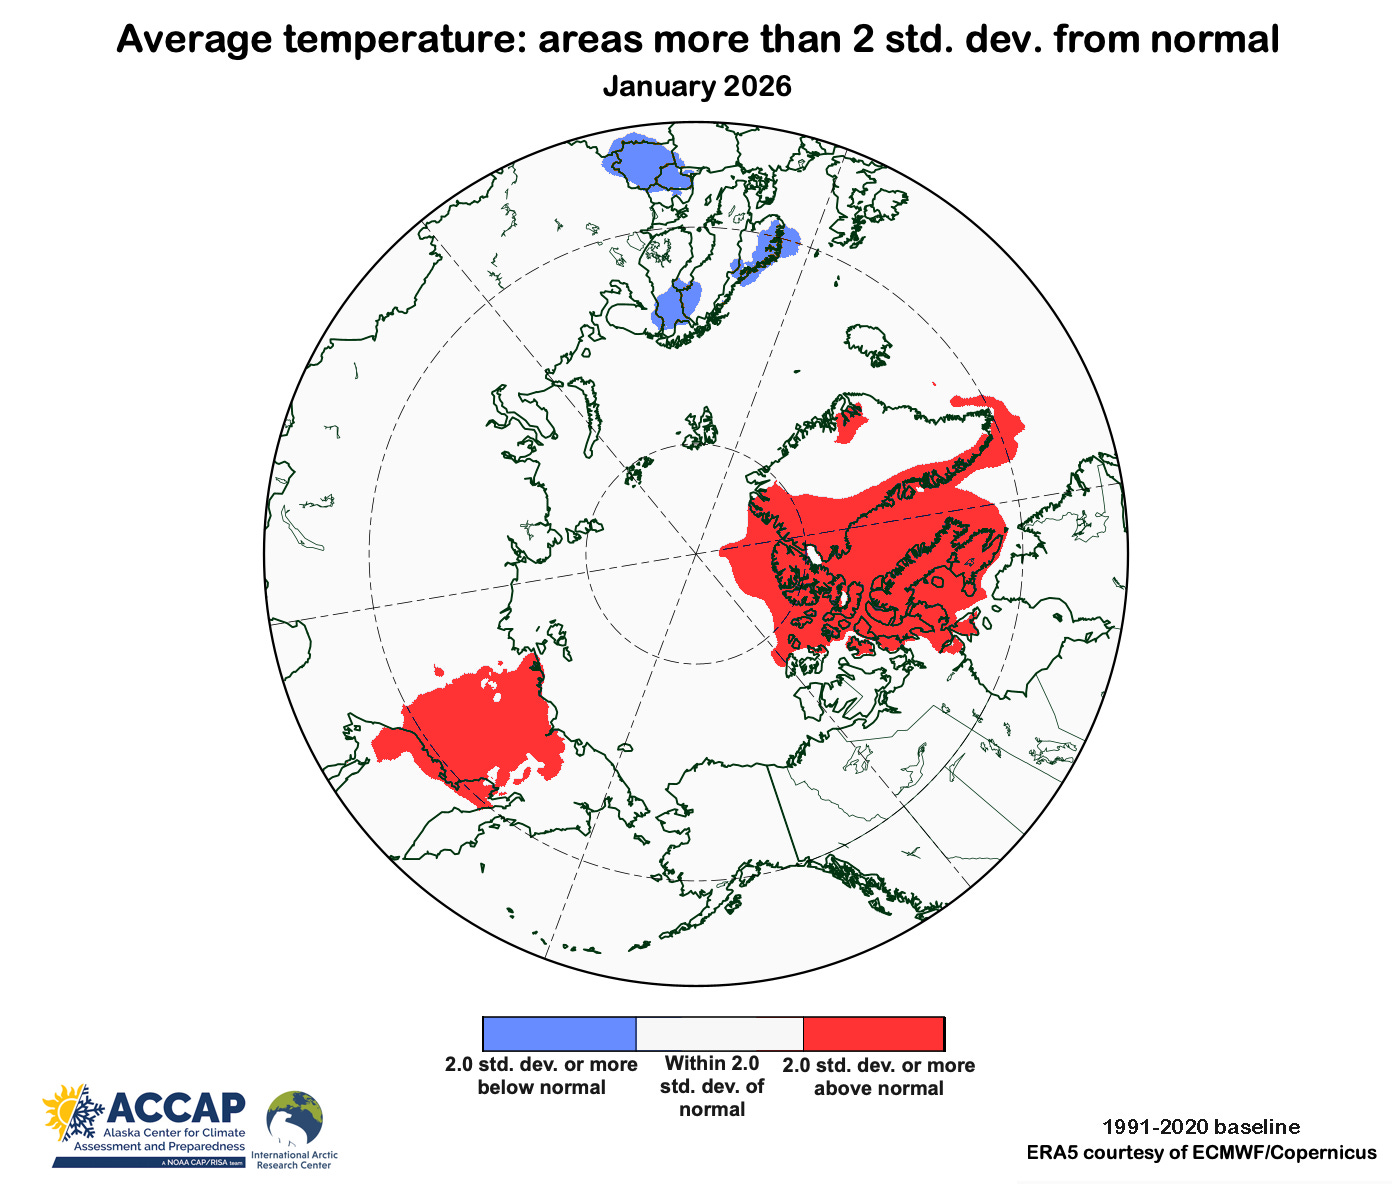
When we construct these “standardized departures” of the January 2026 average temperatures, a departure of two standard deviations (Fig. 3) gives a picture broadly similar to the arbitrarily selected 5°C threshold, though it differs in detail, e.g. over the Barents Sea region and most of the Asian Arctic except the far east, departures that were more than 5°C from the 1991-2020 baseline were also within two standard deviations of the 30-year average. This is an indication of large year-to-year variability in January average temperature in these areas.
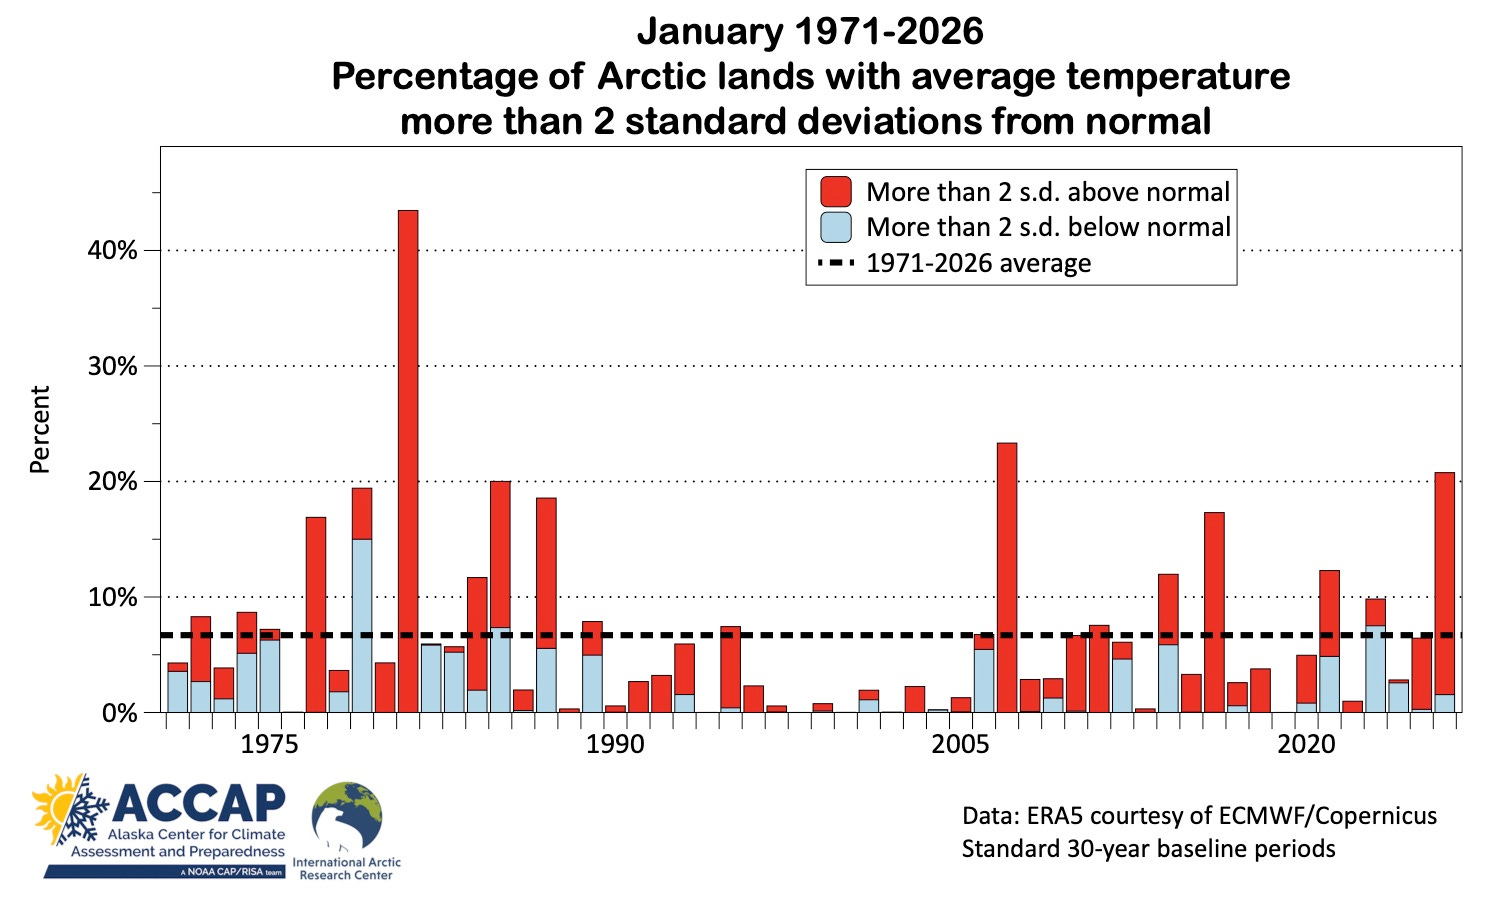
Looking at this metric in historical context, January 2026 was more notable. The 21 percent of Arctic lands with an average temperature more than two standard deviations from the baseline is the third highest in the past 55 years: only 2007 and 1981 had larger area with temperatures that far from normal.
Extremes across the year
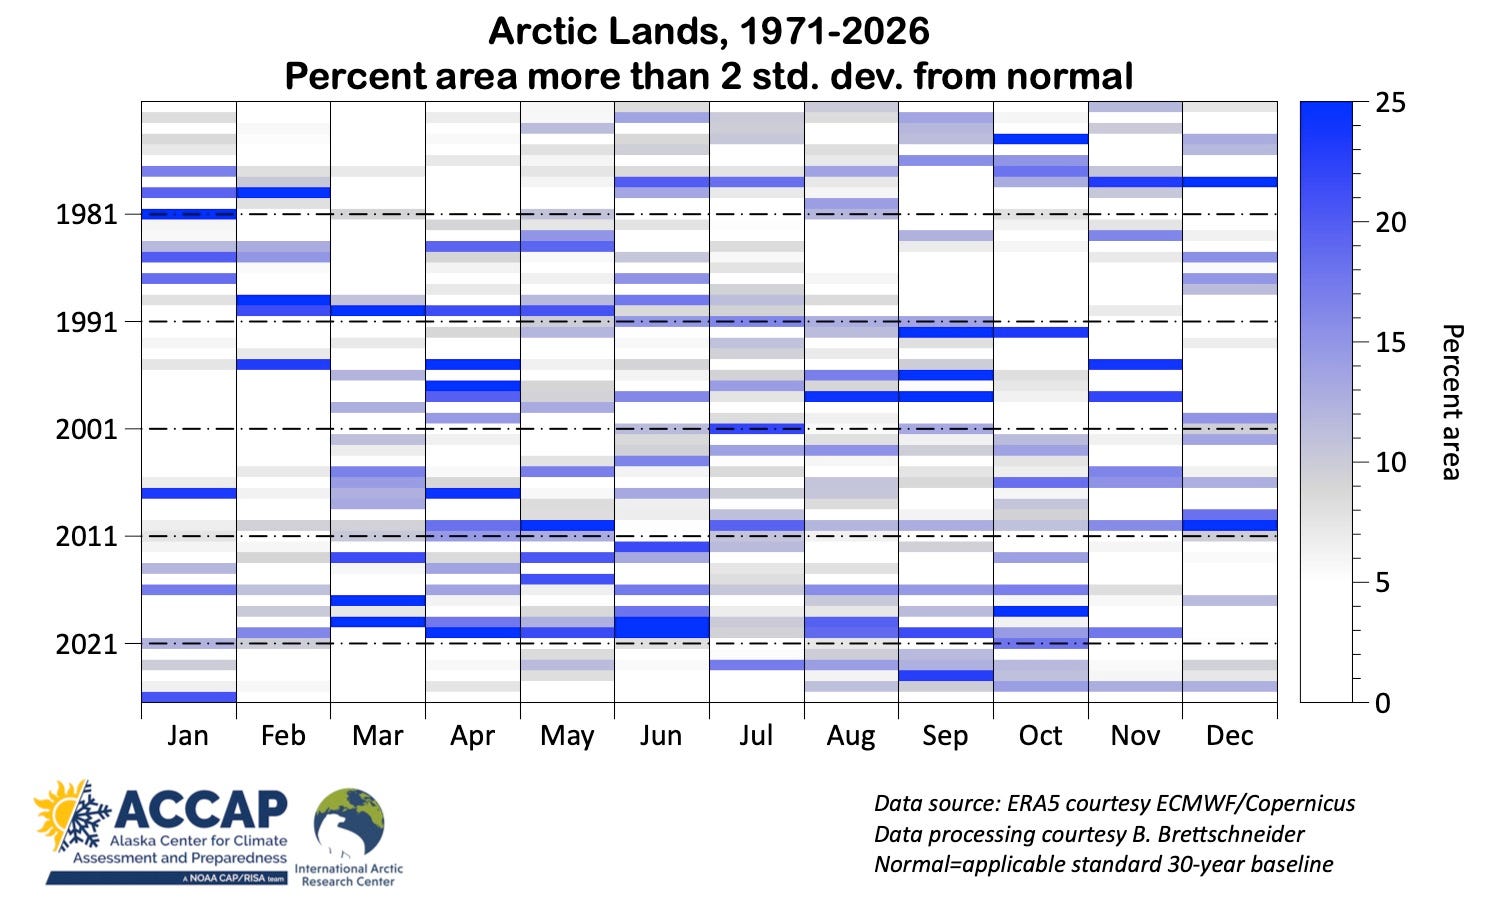
Thus far the focus has been on January average temperature across Arctic lands. How about the rest of the year? Figure 5 shows a “heat map” emphasizing months when there were especially large areas more than two standard deviations from the baseline average. Only two months show a statistically significant trend in the area with temperatures departure of two standard deviations or more.
In October, decreasing sea ice extent and resulting transfer of heat from the ocean surface to the atmosphere is certainly playing a role in increasing very mild temperatures, even over land areas (since the late 1990s nearly all of the average temperatures in excess of 2.0 standard deviations from the baseline have been on the warm side). In March there is also an increasingly trend, though in this case it may be more of a statistical artifact resulting from hardly any extremes in the 1970s and 80s. However, the decrease of sea ice extent in March could potentially be a factor.
Limitations
I would be remiss if I didn’t point out a significant weakness in the time series analyses presented above. Whether it’s departures from a baseline in degrees or as a standardized departures, both these measures require the use of some baseline(s). In the absence of trend, this would be not a problem. However, because temperature at the decadal scale are rising rapidly over most of the Arctic, the use of 30-year baselines that are reset once a decade (the NOAA and now WMO standard) means that towards the end of each decade, the applicable 30-year baseline will, in general, not as accurately reflect the rapidly changing climate as it does early in the decade. For example, in 2001, the 1971-2000 baseline was likely a better fit for the “current climate” than the same baseline period was in, say, 2010, the last year before the change to the 1981-2010 baseline.
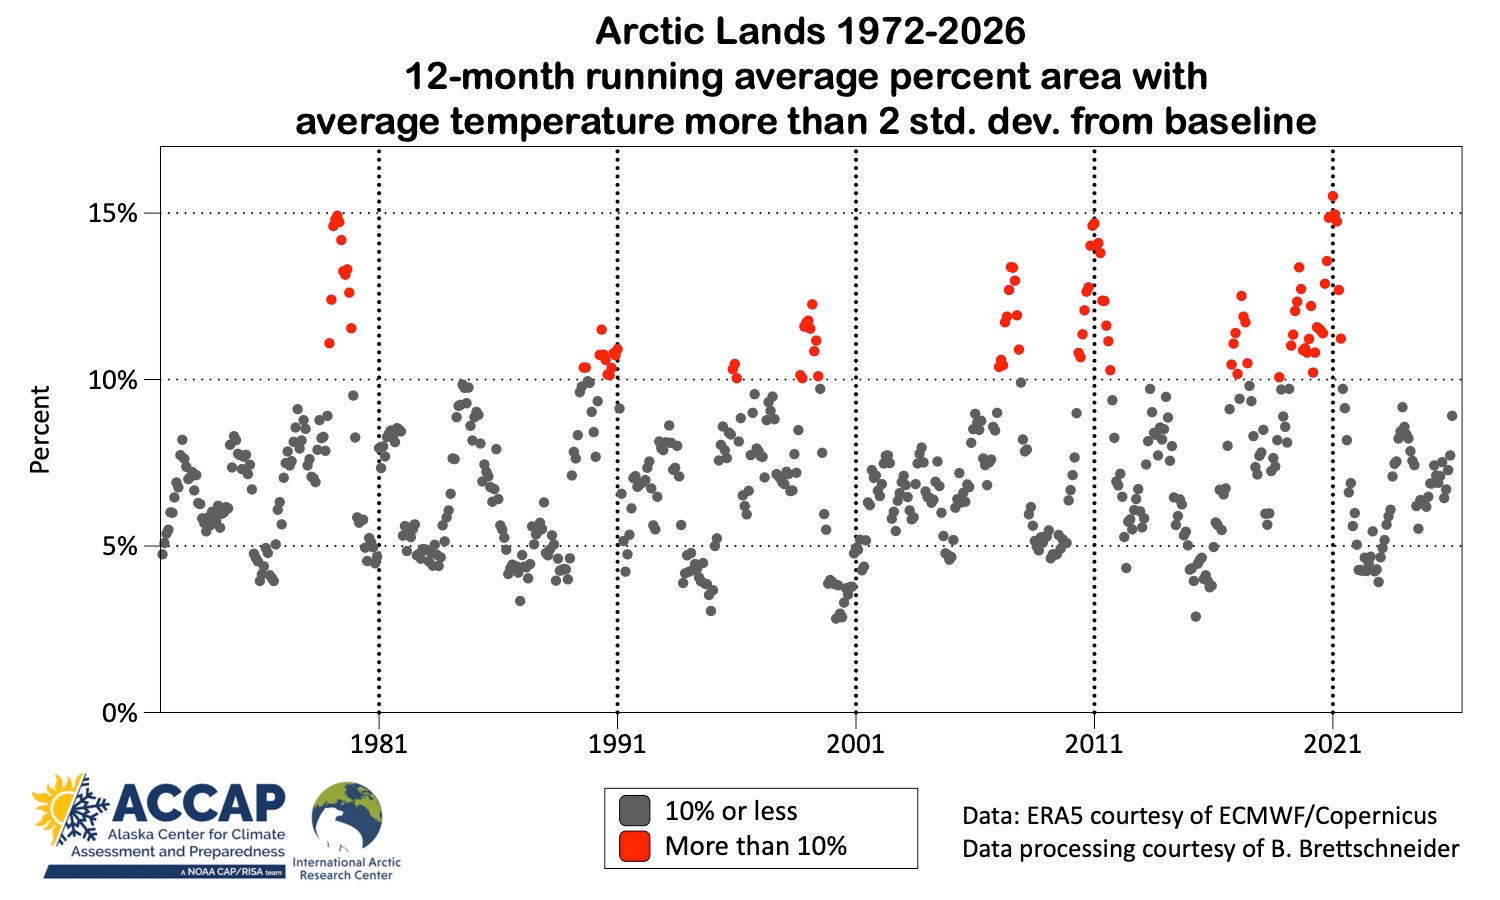
This effect is evident in Fig. 6, which plots the 12-month running average of the area of Arctic lands more than two standard deviations from the applicable baseline. Notice that all the extended excursions in the running average above 10 percent of the Arctic lands occur in the second half of the decades, i.e. shortly before the new 30-year baseline takes effect, i.e. 1981, 1991, etc. Also, there is a sharp drop-off in high areal values right at the start of the new baseline period in 1991, 2011 and 2021.
If the purpose is to quantify temperature departures relative to a contemporary climate, as opposed to a fixed baseline (in which the trend eventually overwhelms everything else) there are numerous workarounds to reduce this “old baseline” problem. One way is to update the 30-year baseline more frequently, e.g. as NOAA’s Climate Prediction Center does with the Ocean Niño Index, revising the baseline every five years. This could be extended to update the 30-year baselines to as frequently as annually. Another way is to use regression or spline functions to construct baseline average and variance statistics that are up-to-date. However, these have drawback of (slightly) changing values for the past, e.g. the 1993-2022 “normals” today would in general be slightly different than if constructed with data ending in 2022.
Technical details and underlying data sources
As usual in this newsletter, Arctic means “poleward of 60°N”.
ERA5 monthly temperature available through the Copernicus Climate Data Store, here.
Code by B. Brettschneider/NWS Alaska Region allowing rapid ERA5 regional analysis is invaluable for my work.
Applicable 30-year baseline refers to the NOAA and now World Meteorological Organization standard 30-years period that would have been in effect each year. For example, in the years 1971 to 1980, the standard baseline is 1941-70, for 1981 to 1990, the standard period is 1951-80, etc.
Your work is deeply appreciated