


Arctic Autumn Cloud Trends
Surprising but explainable

I’m often asked about long term trends in cloudiness, but this is another one of those weather/climate elements where, like winds, it’s very difficult to provide firm answers. Part of this is due to the nature of clouds, which vary greatly in thickness and opacity. From the surface, an overcast sky may be solid leaden gray in dense fog, or it may be thin and high cirrus clouds such that the sun or moon shine brightly through. Solar radiation in principle could account for this varying cloud opacity when the sun is above the horizon, but says nothing about the rest of time. At high latitudes, geostationary satellites don’t provide continuous monitoring of clouds. So as usual we rely on ERA5 reanalysis to example long term changes.
Total cloud cover is reported and modeled as a fraction of the sky covered (not necessarily obscured) by clouds based on the view from the ground. No clouds at all is a cloud fraction of 0 and complete sky cover by clouds, regardless of what altitude the cloud(s) occurs at, is a cloud fraction of 1. For convenience, here I’ve converted these fractions to percent values.
Arctic cloudiness climatology and trends
The Arctic is a very cloudy region in autumn, and Fig. 1 shows just how cloudy. For the Arctic overall, the 1991-2020 average cloud cover is 83 percent, while for Arctic lands it’s slightly lower at 78 percent. For comparison, the autumn average cloud cover in the lower 48 US states is 45 percent and Europe south of 50°N has an autumn average cloud of 53 percent.

With this background about what’s typical, the 50-year change map in Fig. 2 might not be quite as shocking as it would otherwise. The vast majority of the Arctic has seen cloud cover (in ERA5 reanalysis) steady or decrease a bit over the past 50 years, with only a few areas showing an increase. However, because average cloud cover is extremely high to start, in most of the Arctic there isn’t much room to increase.

Still, it’s a bit of a surprise to see the widespread decrease. So I thought to take a deeper dive into the area showing the largest decrease, which happens to be the area in the Chukchi Sea just west of the Alaska coast.
A detailed analysis
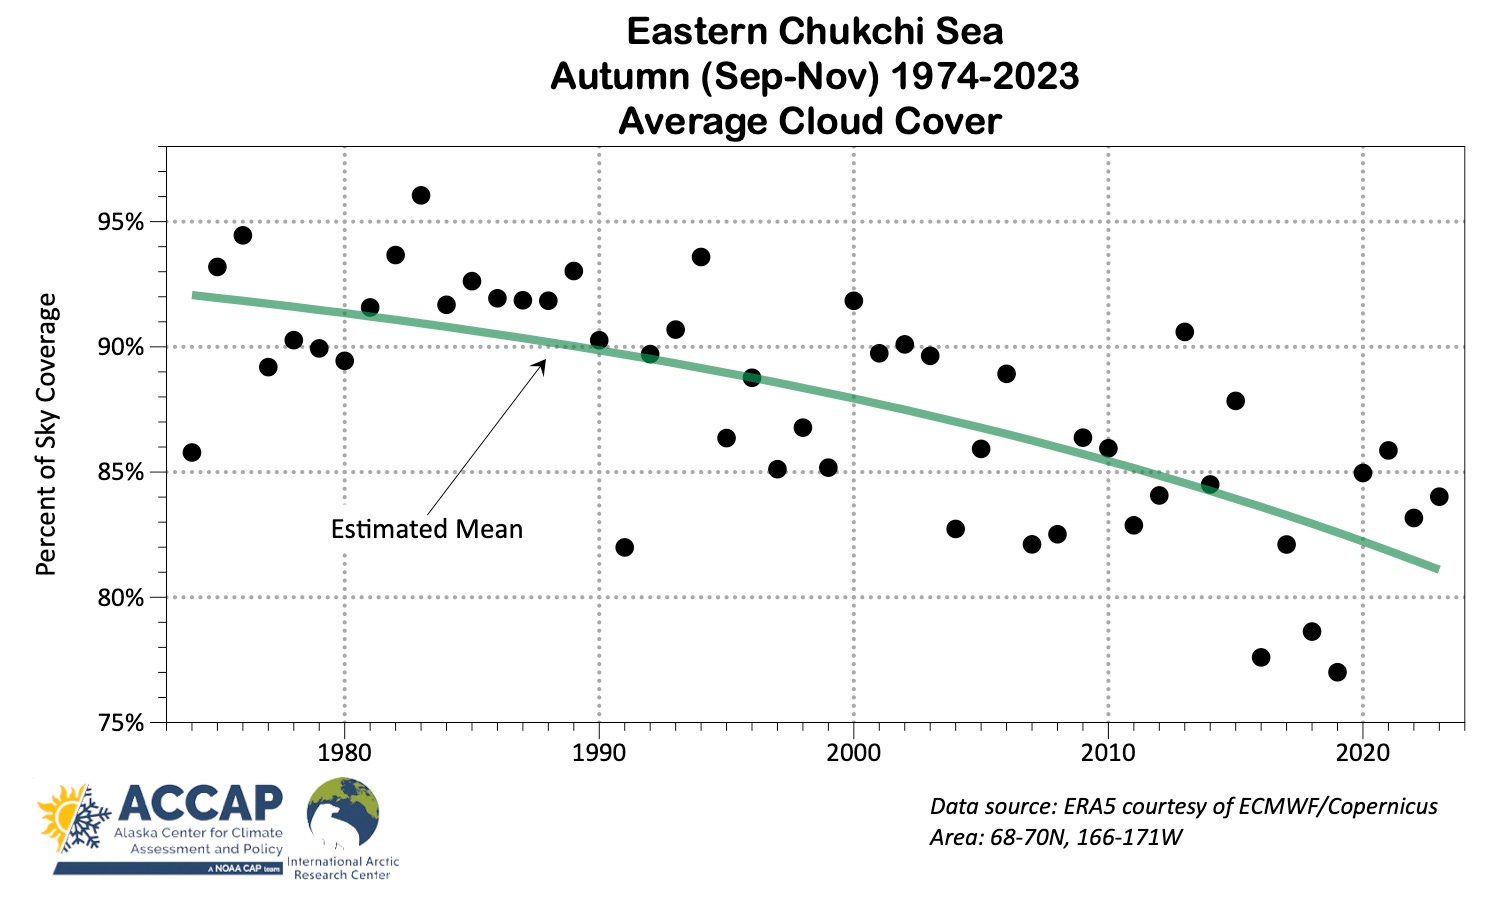
Because a first input for cloud cover into the reanalysis is satellite data, and satellite data into reanalysis starts in 1979, my first thought was: is there something odd in the pre-1979 cloudiness? Figure 3 plots the autumn average cloud cover 1974-2023. It turns out that in this area, the pre-1979 average autumn cloudiness looks just like typical autumn cloudiness through the early 1990s, with most of the decrease since then.
What could be driving this decrease? Referring back to Fig. 1, the highest average cloud cover occurs over areas that at least historically had sea ice for part or even all of the autumn. Sea ice cools the air directly above it, and of course the capacity of air to hold water vapor falls dramatically as the temperature drops. This means that for a given amount of water vapor in the air, the relative humidity increases as the temperature falls until the humidity is 100 percent and fog or clouds form.
Autumn ice is also thin and there is more ocean water exposed through breaks in the ice than in the winter and spring. So it at least is physically plausible that loss of near surface cooling from sea ice could result in less near surface cloud cover.
The Chukchi Sea has seen large changes in autumn sea ice, so Fig 4. plots the average autumn cloud cover against the average sea ice concentration. There is a fair bit of scatter, but most of the autumns with the highest cloudiness also had comparatively high average ice concentration.1
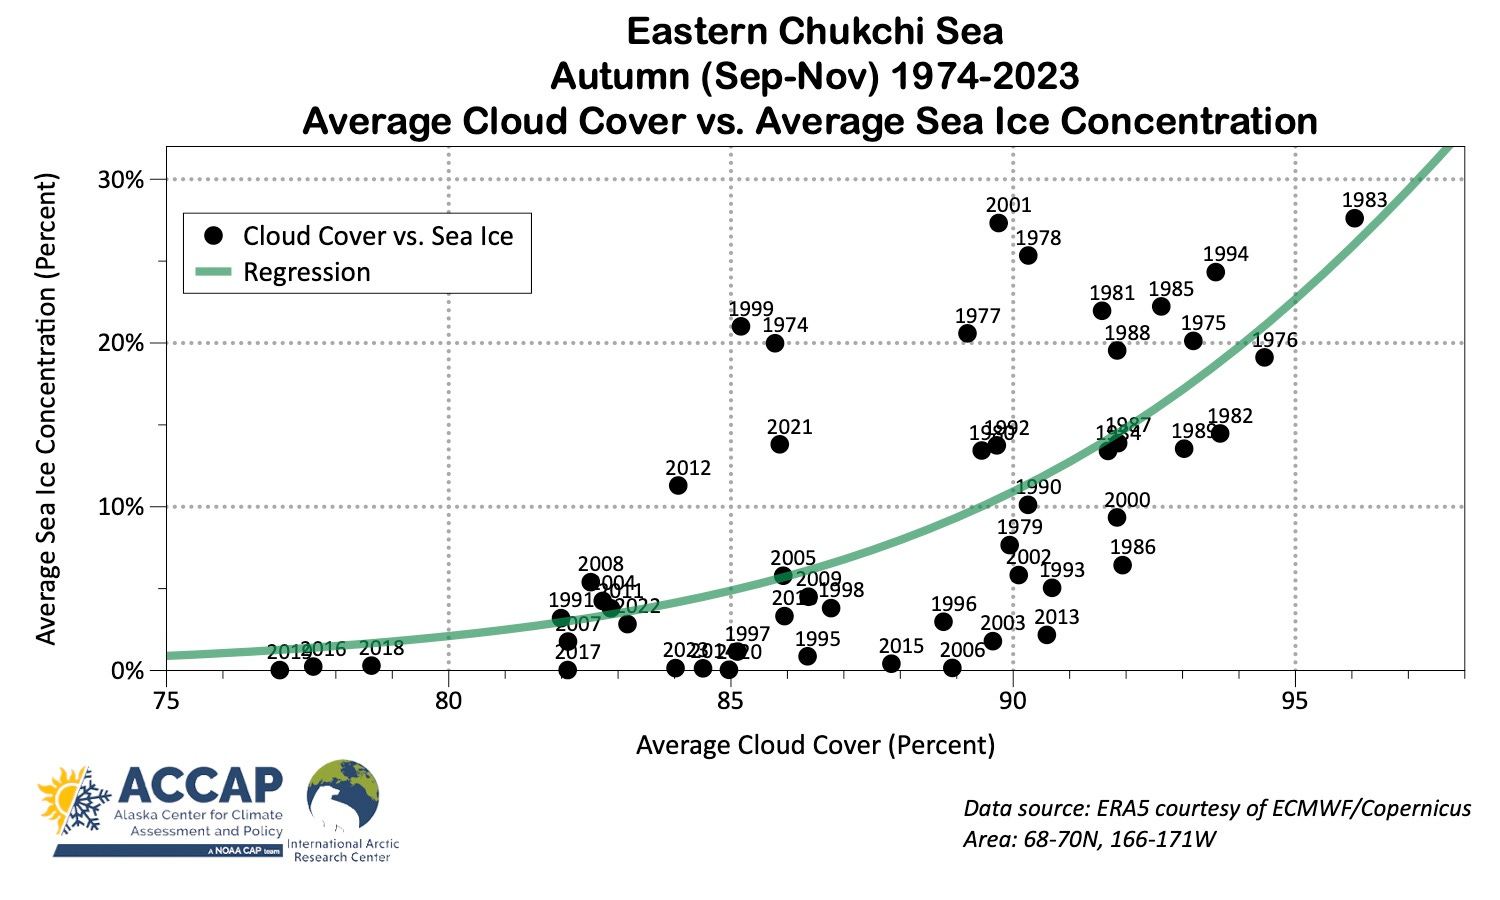
There is some but not as strong a correlation between the lowest cloudiness autumns and very low average ice concentrations. This helps highlight that there are also large scale drivers at play in determining cloudiness. For example, autumns with very low sea ice are also likely to be autumns with frequent storminess, which is usually accompanied by extensive cloudiness.
Technical Details
As usual in this newsletter, Arctic means “poleward of 60°N” unless otherwise specified.
ERA5 monthly cloud cover data available here.
Code by B. Brettschneider/NWS Alaska Region allowing rapid ERA5 regional analysis is invaluable for my work.
In this part of the Chukchi Sea, even in the late 20th century, September sea ice was minimal, so differences in autumn average ice concentration in Fig. 4 mostly reflect differences in October and especially November sea ice.
The Chukchi Sea keeps coming up- first in anomalous sea ice, now in cloudiness data. ????