


April 2024 Sea Ice
The melt season begins

Arctic
Arctic-wide sea ice extent in April averaged 14.31 million km². This was about 1.4 percent below the 1991-2020 average and the highest April average extent since 2013. Figure 1 shows the April average ice concentration. Only the Sea of Okhotsk had notably less extensive ice than usual for this time of year.

The decrease in Arctic-wide sea ice extent from March was a bit over 700,000 km², which is close to the average March to April change.
Alaska and vicinity
Sea ice around Alaska was fairly typical for the past decade (excepting 2018 and 2019 sea ice crash years). The median daily sea ice concentration from the AMSR2 satellite derived data is shown in Fig. 2.
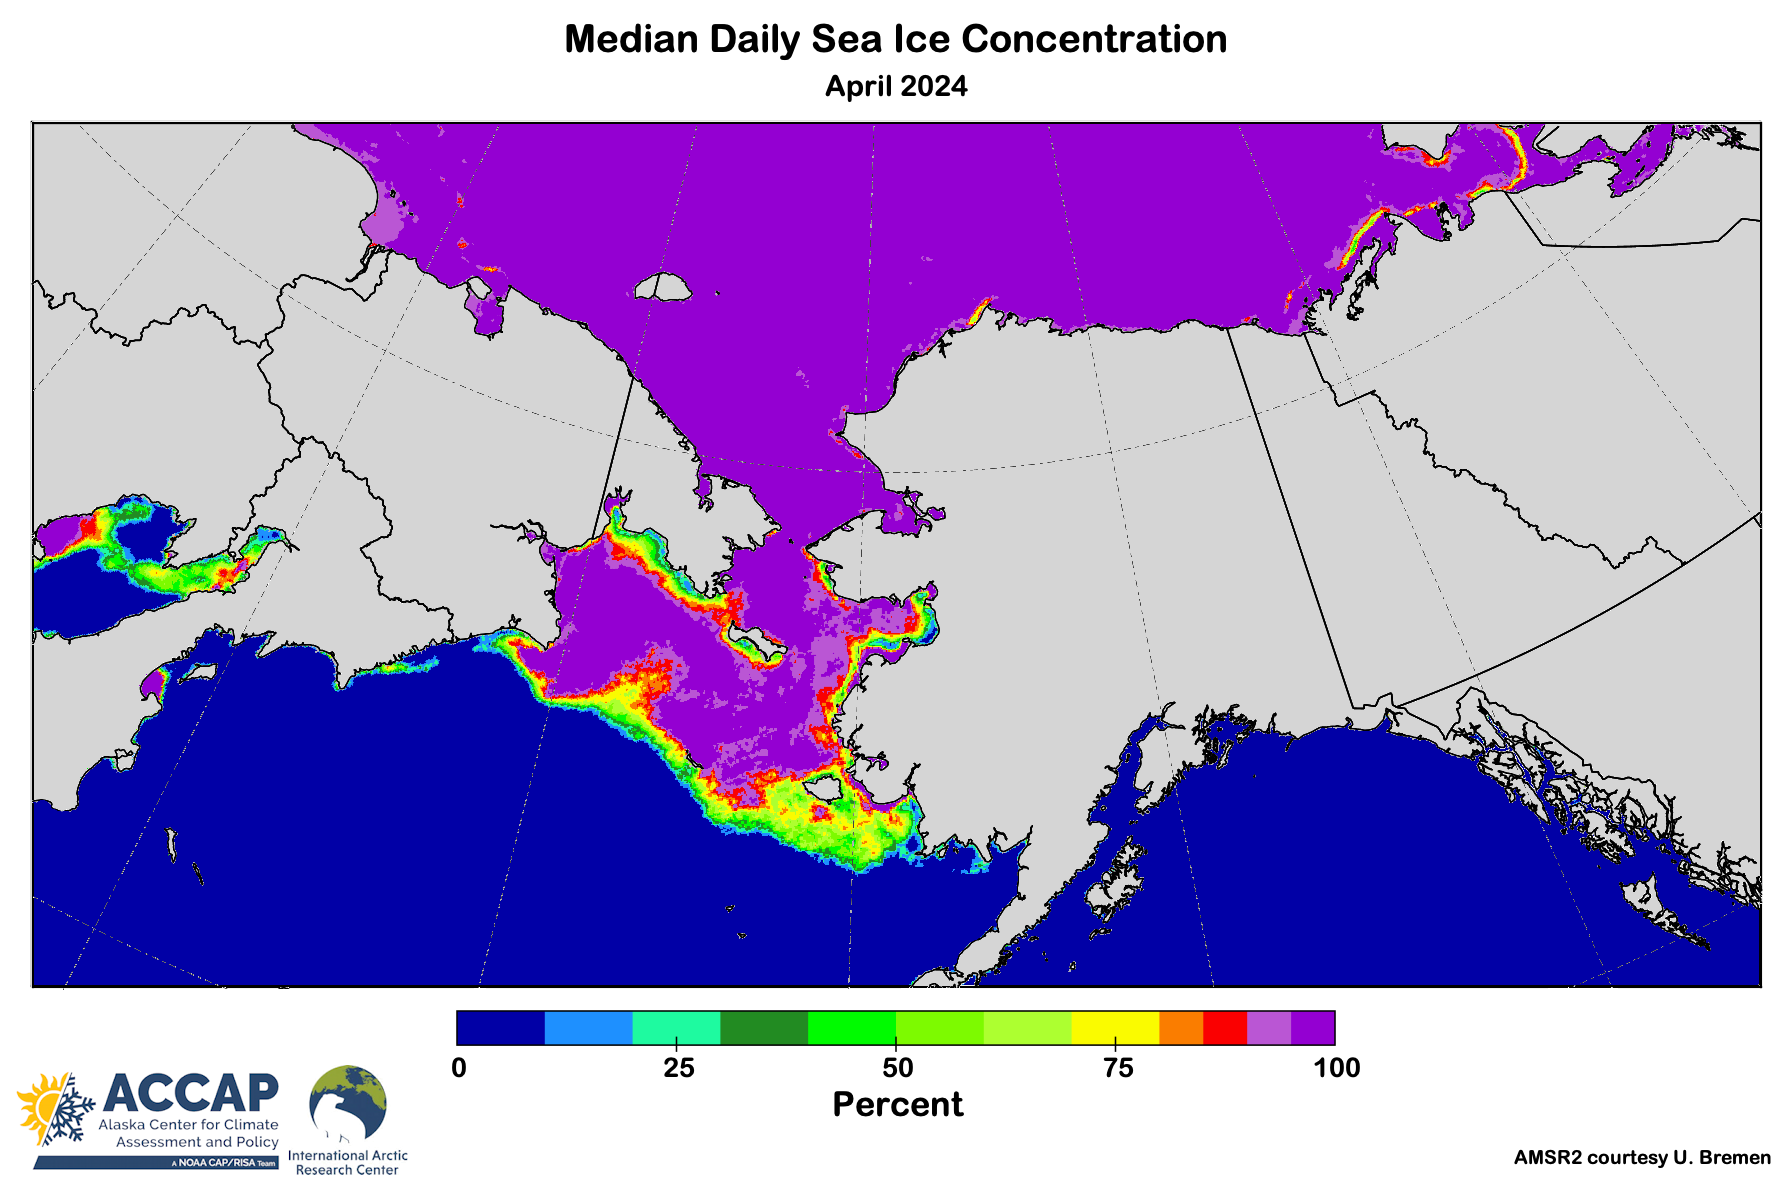
North of the ice edge, lower concentration ice is noticeable in eastern and southern Norton Sound and on the south sides of St. Lawrence Island and the Chukotka Peninsula. These are all favored areas for early season open water due to winds and currents both in the spring and earlier in the winter. North of the Bering Strait, ice concentrations (at this scale) were much closer to 100 percent, though areas of lower median concentration ice were found just west of Pt. Barrow, Alaska and in the southeastern Beaufort Sea offshore of the Northwest Territories coast.
Figure 3 shows the April average extent each year since 1979. This year, the Bering Sea April average ice extent was 623,000 km², which is very close to the averages in April 2014-16 and 2021-23, but a little lower than the average April extent prior to 2014.

End of April Sea Ice
Conveniently, the last day of April 2024 brought clear skies to most of the northern Bering and southern Chukchi Seas region. I’ve annotated the Suomi NPP satellite’s truecolor image, which is roughly what you would see if you were riding around on the satellite 518 miles have the ground, with a pair of high powered binoculars, in Fig. 3. There’s an immense amount of detail visible, from areas of mostly snow-free ground starting to appear to different kinds of sea ice as well areas of open water.
As the melt season kicks in each Spring, the southern edge of the pack ice moves north as ice melts and patches of open water develop farther north in response to local winds and currents. Just where these areas develop and where ice persists varies significantly from year-to-year, and of course the ice is quite mobile as it’s pushed around by currents and winds, so any given area may see ice come and go multiple times before the ice melts out completely.
This interannual variability is nicely illustrated by Fig. 5, a “postage stamp” collage of the April 30th sea ice concentration for the past nine years as analyzed by the National Weather Service Alaska Sea Ice Program.
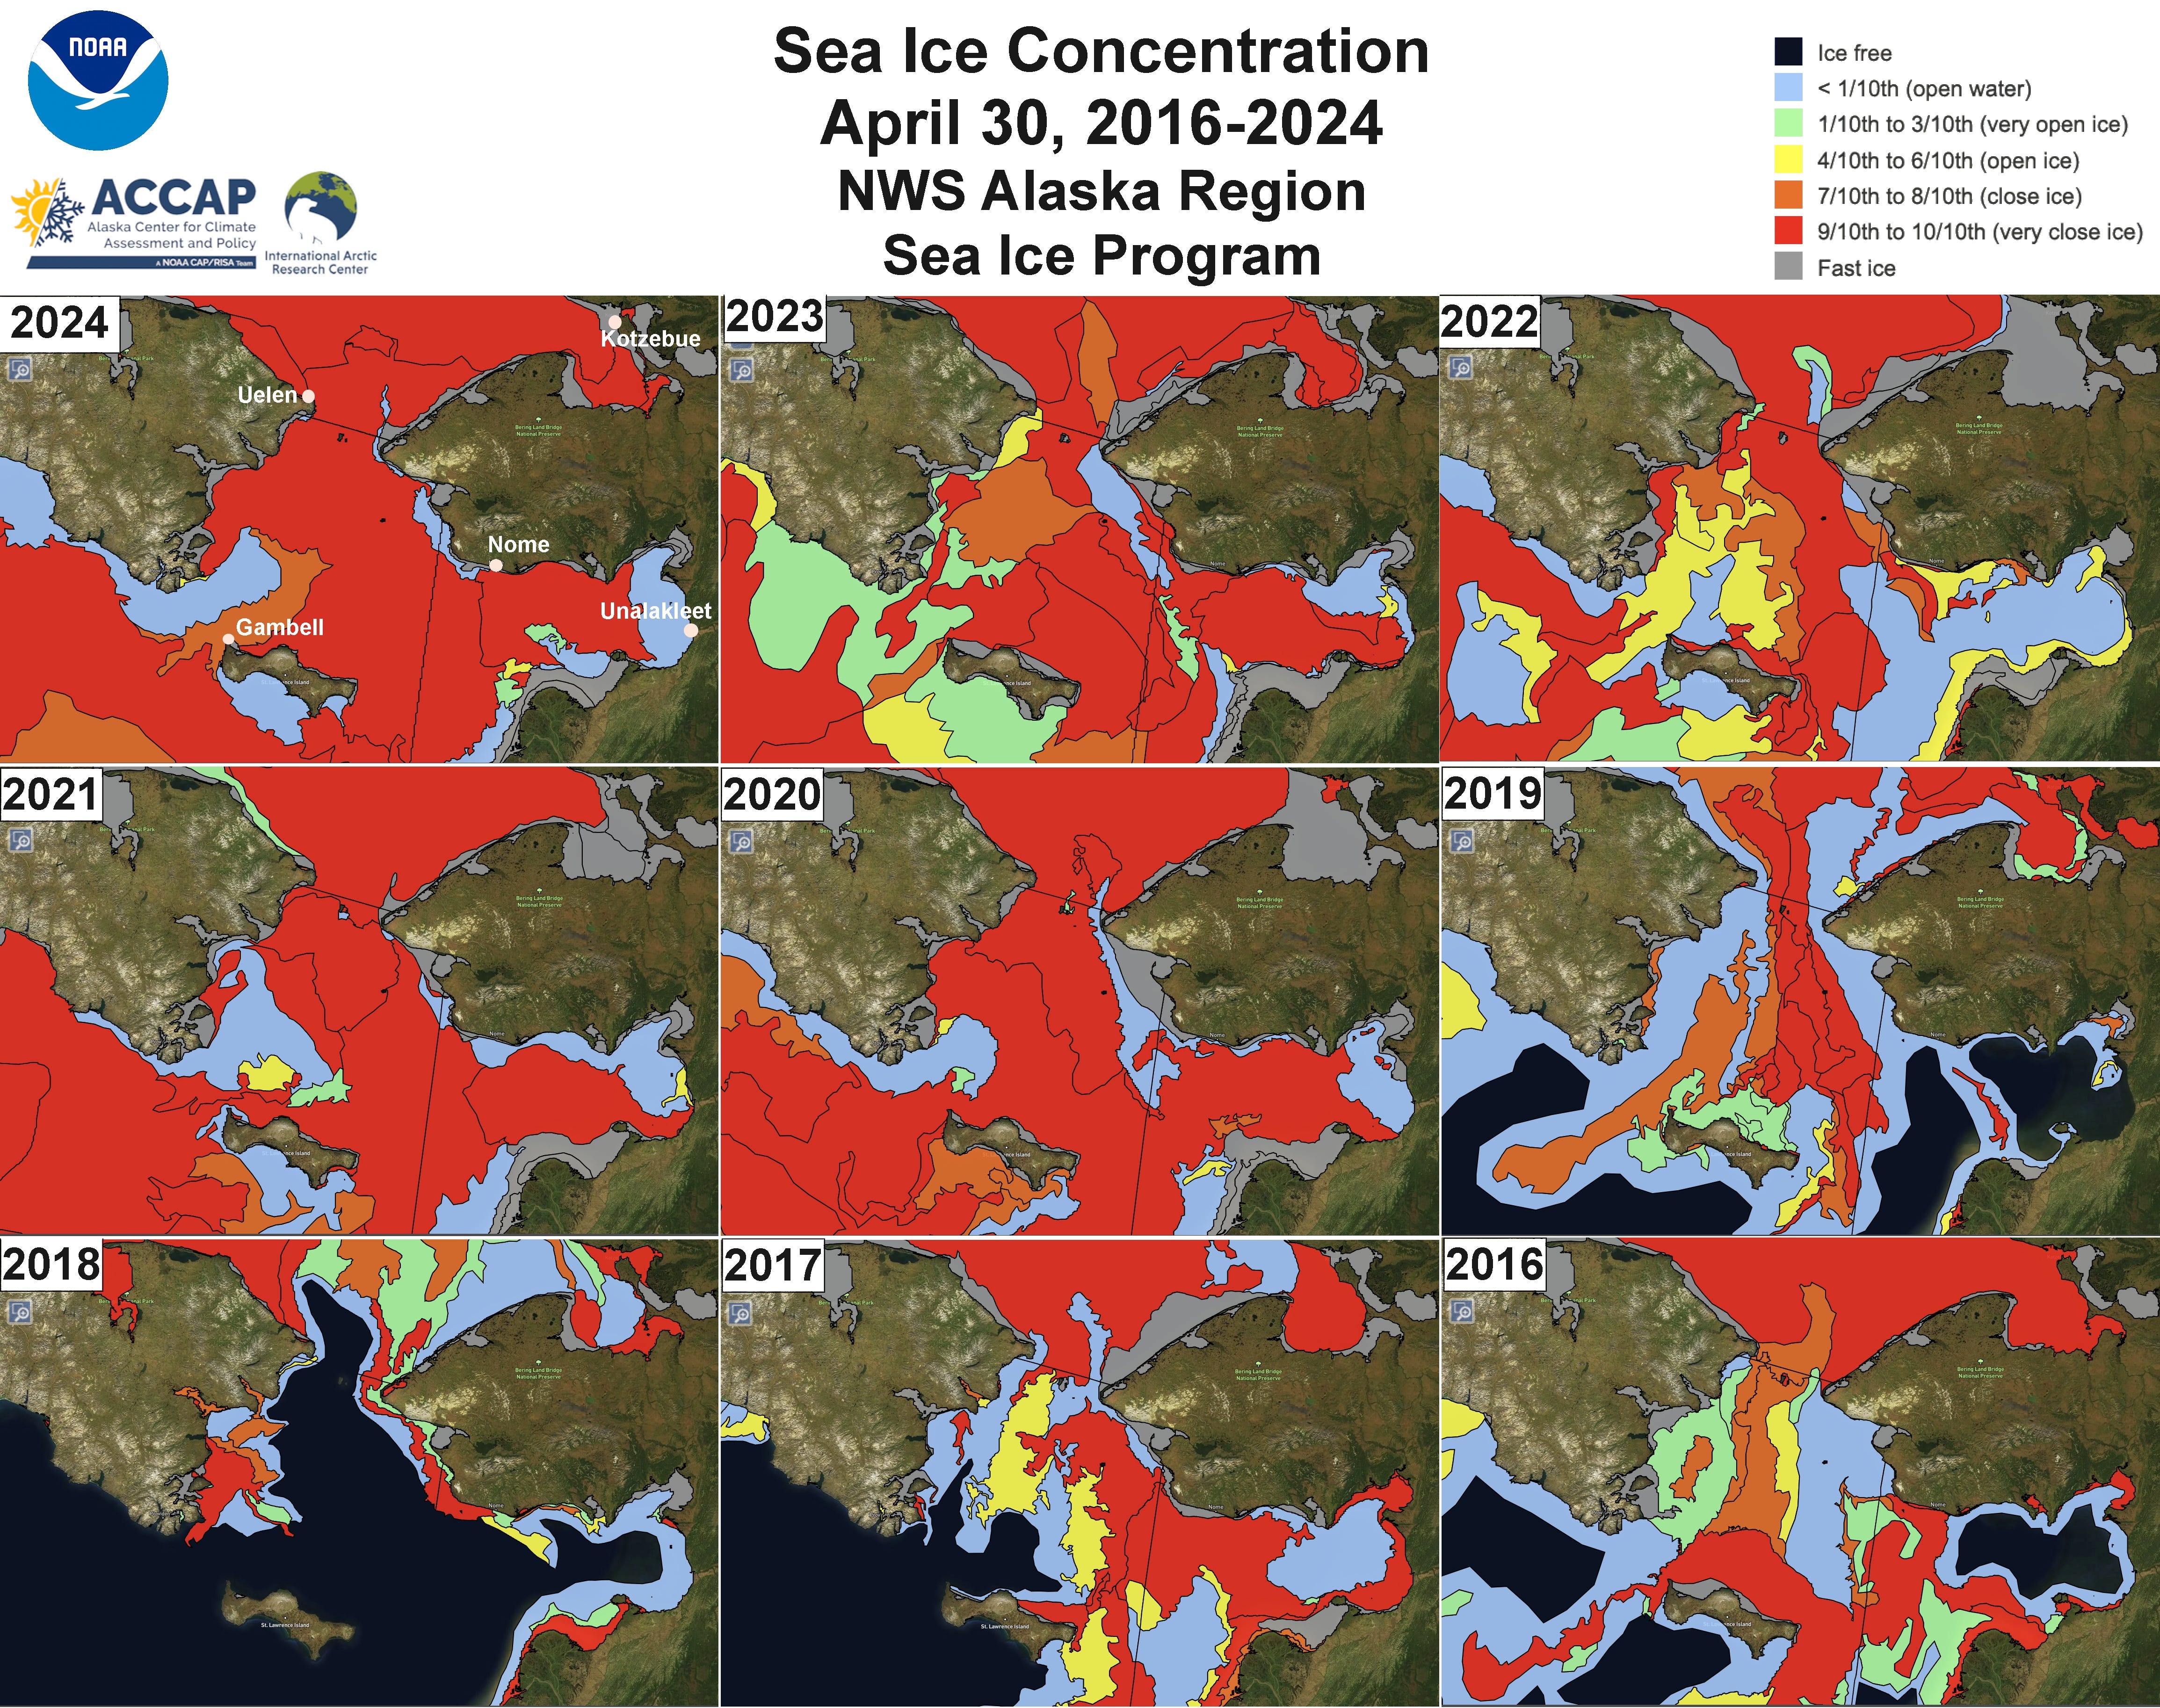
The winters of 2017-18 and 2018-19 were the historically low ice seasons in the Bering Sea and this was still evident at the end of April.
Given current trend lines and extrapolating out, how long do we have before the Arctic is all open water in the height of summer? Very rough estimates are fine.