


Anchorage's Extreme December Precipitation

In a previous post we reviewed the repeat snowstorms December 5-15 that brought Anchorage to a near standstill for a few days with 40 to 50 inches of snow around the city (Fig.1). In that post we noted while extreme, it’s not unprecedented for Anchorage to get this much snow in less than two weeks. However, the liquid equivalent of the snow was truly “off the charts”.

As you probably know, when we talk about precipitation amounts, that’s jargon for the amount of water equivalent that falls out of the sky and reaches the ground. That can be in the form of rain or the water from melting any type of frozen stuff, such as snow, sleet or hail. And amounts are typically expressed as the total depth that would accumulate over a area (if it did not run off or percolate into the ground). For starters, let’s make clear there’s no significant doubt as to the accuracy of the precipitation reported from the automated surface weather station (ASOS) at the Anchorage International Airport. The total precipitation reported between December 5 and December 15th was 3.74 inches (95.0mm). The National Weather Service Office, located about two miles southeast of the ASOS, maintains a separate precipitation observation program using a completely different type of precipitation gauge and recorded a total of 3.94 inches (100.1mm) in the same period, an insignificant 5 percent difference. Most of the Anchorage area volunteer observers with the CoCoRaHS program who made complete daily observations during this time reported between 3.5 and 4 inches of precipitation.
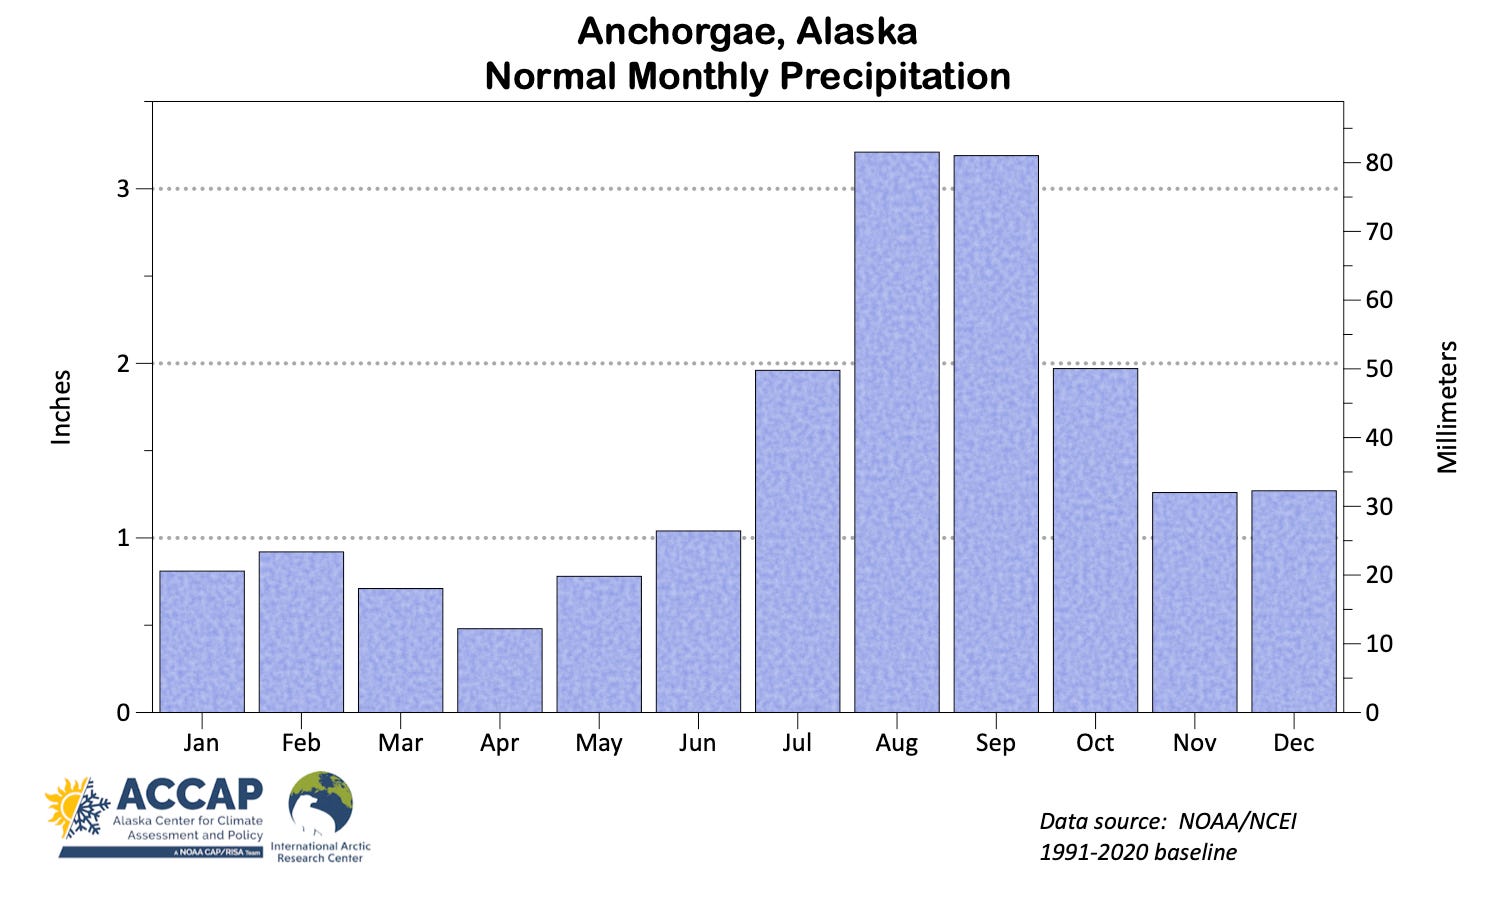
Situated on the west (leeward) side of Chugach mountains, Anchorage has a comparatively dry climate, at least in terms of total annual precipitation. The average of 17.60 inches (447mm) is comparable to places like Salt Lake City, Utah or Edmonton, Alberta. In addition, Anchorage, like most areas in Alaska, has a pronounced seasonality to precipitation (Fig. 1), with nearly 60 percent of the average annual total occurring between July and October.
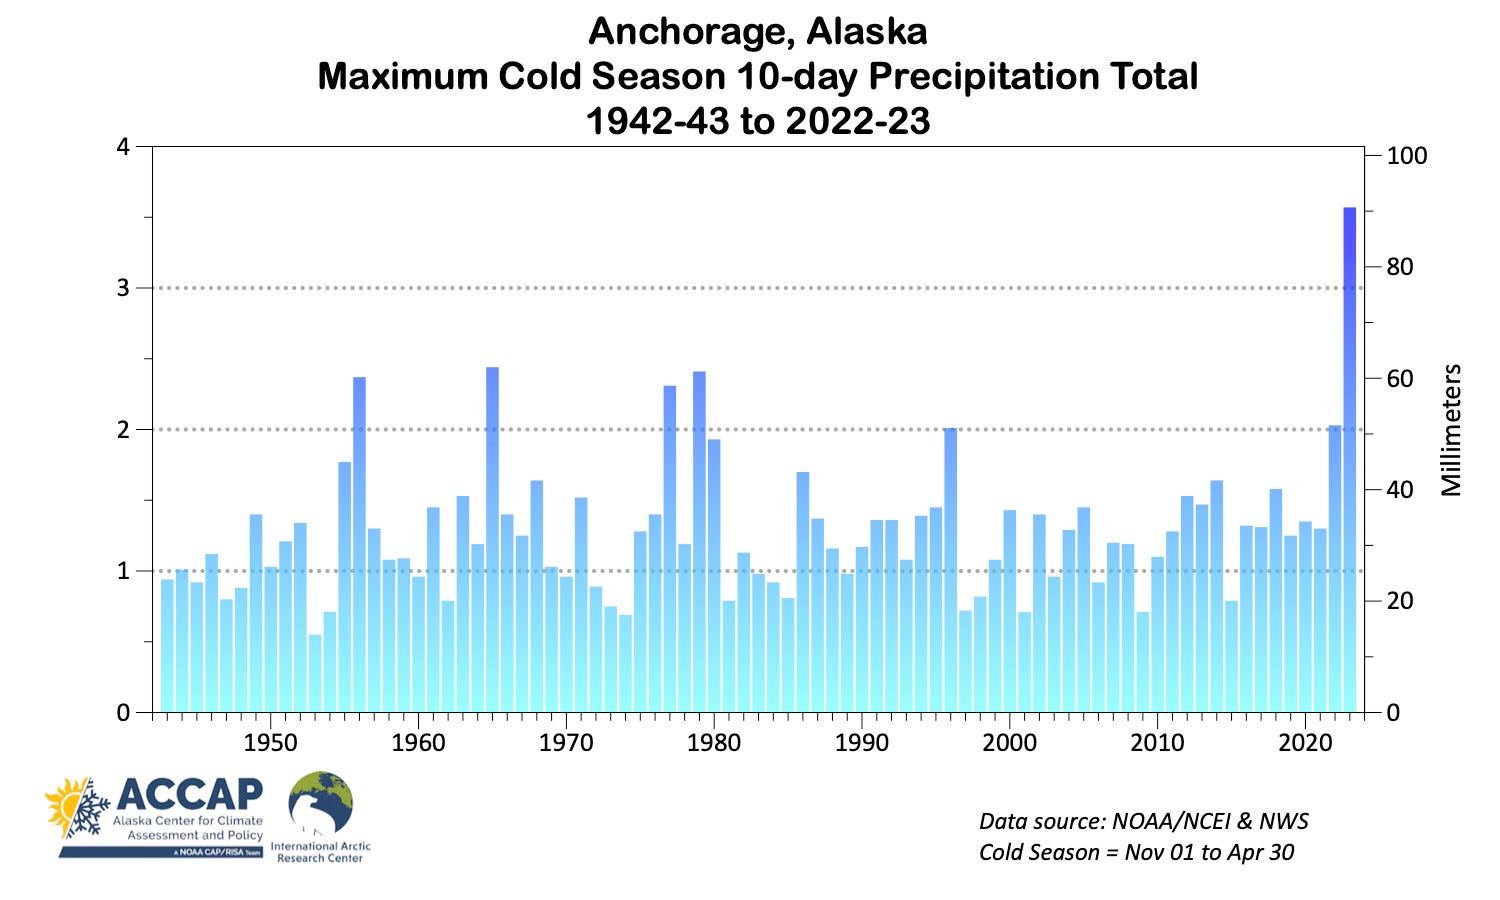
So while 3.74 inches (95.0mm) precipitation in two weeks would be unusual at any time of year, it’s really the occurrence outside of the wet season that makes this so remarkable. This is already the highest precipitation total for December, previous record 2.67 inches (67.8mm), and in fact is higher than any other winter or spring month. To illustrate just how extreme the December precipitation was, Fig. 3 plots the maximum 10-day precipitation each cold season (November through April) since 1942-43. The December 2022 10-day total of 3.59 inches (91.2mm) is far higher than recorded in any other winter. In fact, it’s 38 percent higher than what’s now the second highest (2.44 inches, 62.0mm, in November 1964).
As we did with snowfall, we’ll use the 80 seasons (1942-43 through 2021-22) to calculate return intervals for cold season precipitation, and the results are shown in Fig. 4. Not to put too fine a point on it, but 80 years is not nearly enough time to establish that 3.59 inches of precipitation in the cold season really has a return period of over 3000 years! Rather, this serves to illustrate how far outside the historical precipitation record the December 2022 totals have been in Anchorage.

January 8, 2023 update:
Here’s a plot of the December total precipitation in southcentral Alaska as a percentage of the 1991-2020 average. Nearly all this precipitation fell December 5th to 16th. The narrow area that received the extreme precipitation, basically Kenai to Palmer-Wasilla, is evident.

Having these charts available is fantastic ! I believe the snowfall is highly unusual and record setting, but once every 3000 years ? It seems to me that it is a once in every 80 year occurrence and with more time passing we will be able to better say more about how unusual this period was.