


Alaska/NW Canada Winter 2023-24 and El Niño
An underachieving El Niño

Summary
Winter (December through February ) average temperatures over much of Alaska and northwest Canada south of about 67°N are historically favored to be warmer than normal during El Niño winters. Winter 2023-24 featured a strong El Niño, but nearly all of the region had a cooler winter than usual compared to other El Niño winters since the mid-1970s, and over a good portion mainland Alaska and the western Yukon Territory the average temperatures was actually below normal. In some places this was the first El Niño winter to be cooler than normal since the late 1960s. Precipitation and snow during past El Niño winters is much more variable than temperatures, but 2023-24 brought very heavy snow to parts of southern and western Alaska.
The reasons for these outcomes are complex and are under investigation, but global ocean surface warmth, the very warm waters in the far western equatorial Pacific and the usual random variability of the ocean-atmosphere system all likely played a significant role.
El Niño and ENSO
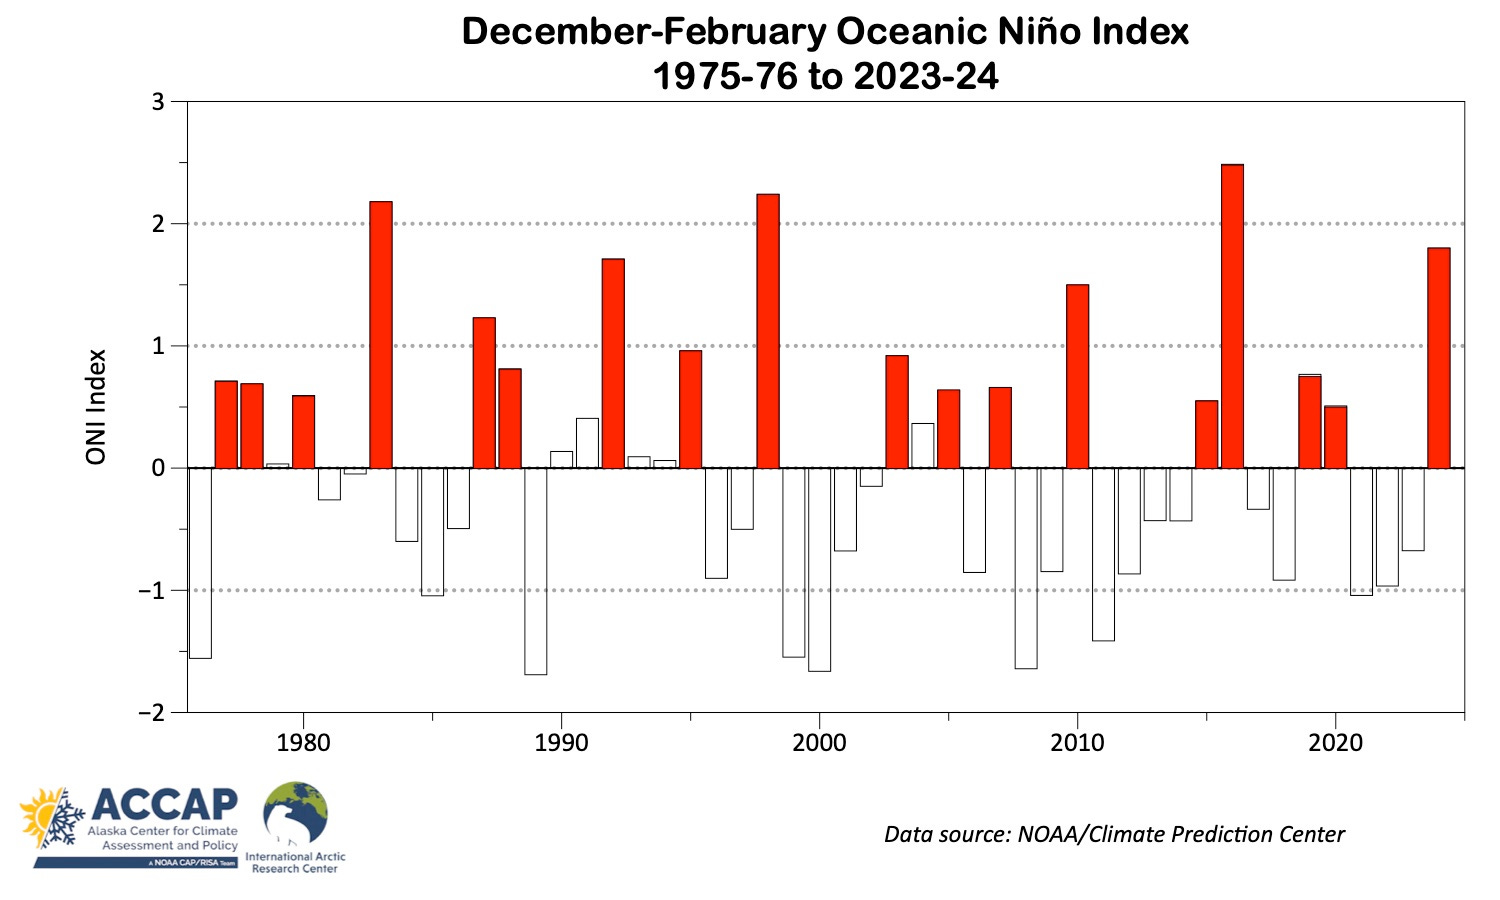
El Niño conditions emerged in the equatorial Pacific Ocean in Summer 20231, peaked in early winter 2023-24 in the “strong El Niño” category and El Niño was weakening quickly by mid-March 2024. Figure 1 plots NOAA’s Oceanic Niño Index (a widely used measure of El Niño/La Niña) for December through February (DJF) since 1975-76, with the El Niño winters in red. The preliminary estimate for 2023-24 ONI is +1.8, which ranks as the fourth highest since the mid-1970s.
Note: there are many online resources to learn more about El Niño and the ENSO cycle, some of which have not been updated in 20 or more years! The ENSO Blog on Climate.gov is a useful and regularly updated source for background and up-to-date information.
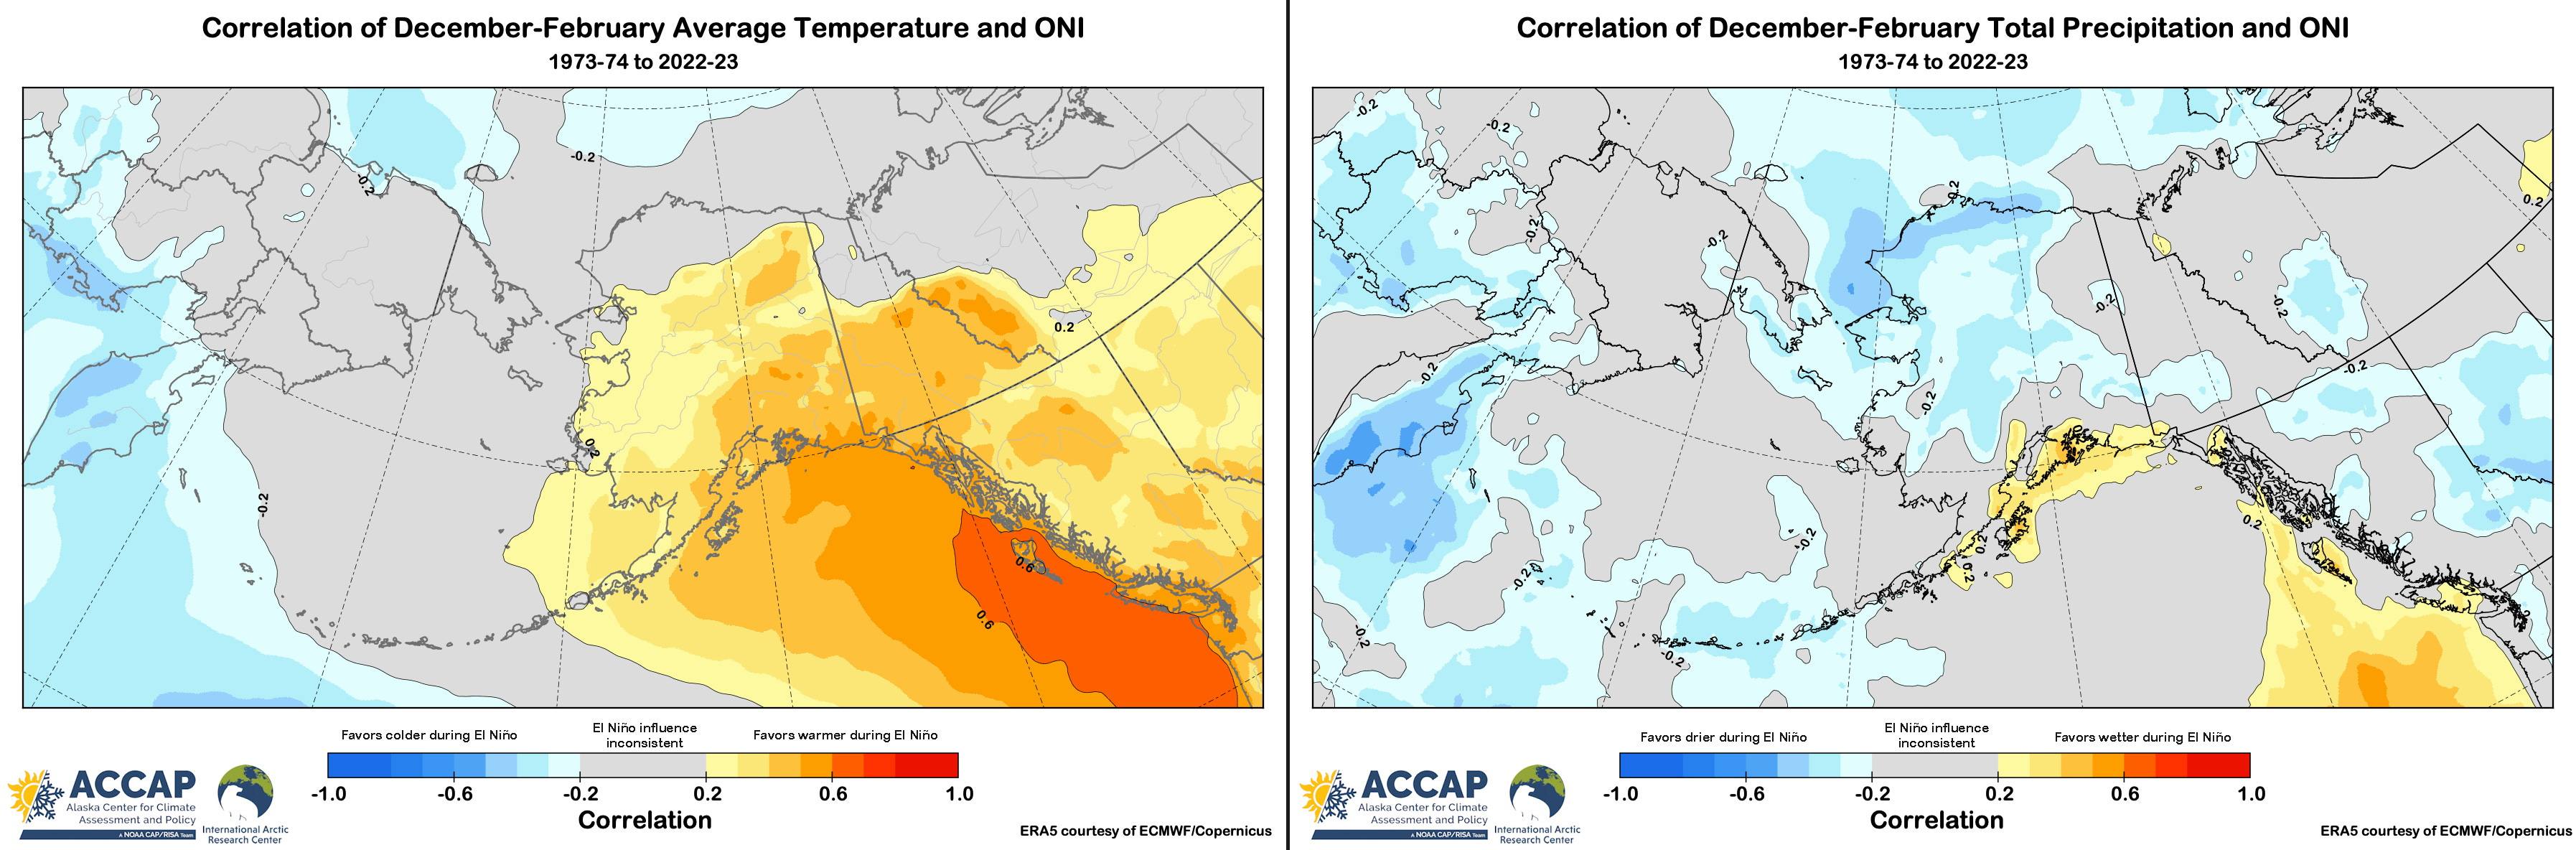
Across much of northwest North America, the El Niño/La Niña cycle (collectively known for historical reasons as ENSO: “El Niño Southern Oscillation”) has a significant relationship on winter temperatures and to a lesser extent with precipitation. Figure 2 plots the 50-year correlation between the DJF ONI and the same season average temperature (left) and total precipitation (right).2
For much of Alaska and western Canada, there is a notable positive correlation of ONI with average temperature: higher values of the ONI typically favor higher values of DJF average temperature. From the far western Aleutians northwestward across Kamchatka and into eastern Siberian as well as portions of the Arctic Ocean, higher values of the ONI typically favor lower values of DJF average temperature.
Winter precipitation is not nearly as well correlated with ONI as temperatures, with the Gulf of Alaska coast correlation of the opposite sign (El Niño favors wet) than much of western/northern Alaska and parts of Northwest Canada (El Niño favors dry).
The gray shade shows areas where variations in ONI and average DJF temperatures/total precipitation do not fluctuate in a consistent way.
What happened in Winter 2023-24?
El Niño winters in recent decades in Alaska and northwest Canada have typically been warmer than normal and generally feature less deep cold weather than in non-El Niño winters. However, over a large portion of the mainland Alaska and central and northern Yukon Territory this past winter did not meet expectations. Figure 3 shows the DJF 2023-24 average temperature departure from the 1991-2020 normal on the left and the median temperature DJF departure from normal for the 16 El Niño winters in the prior 50 years (see technical details below for what “normal” means in this content).

Over a large swath from the western Yukon Territory southwestward across Interior Alaska and into southcentral and parts of southwest Alaska, winter average temperatures were near or below normal, in sharp contrast to the expected El Niño outcome. In fact, in some places in central and eastern Interior Alaska, including e.g. Fairbanks, this was the first El Niño winter with a below normal average winter temperature since the late 1960s.
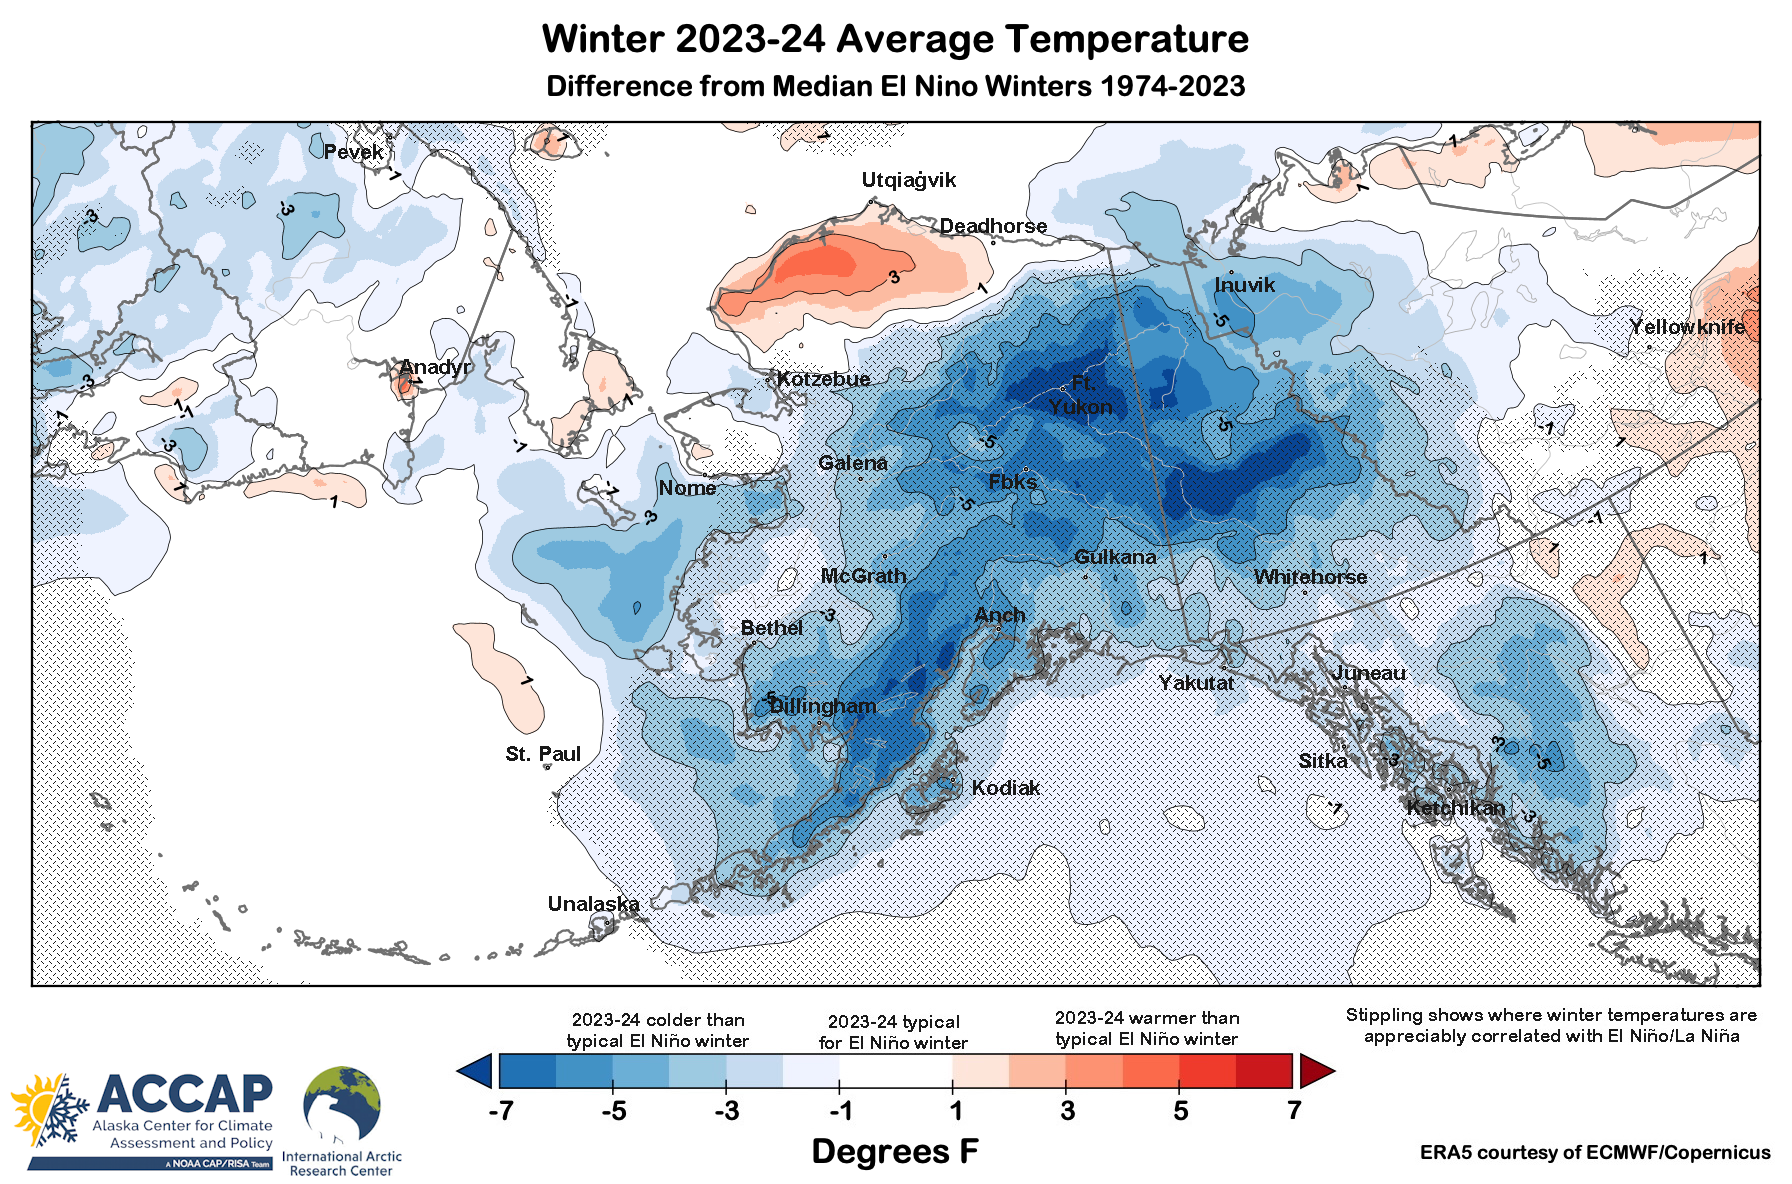
Figure 4 plots the difference between the winter 2023-24 average temperature and 16 El Niño median, i.e. left side of Fig. 3 minus the right side of Fig. 3 and adds the ENSO significance shown in Fig. 2. This shows that almost everywhere in northwest North America where ENSO has some reasonable correlation with the winter average temperatures, this past winter the average temperature was lower than the El Niño median, even in areas where the above normal category was correct, e.g. all of Southeast Alaska, most of western Alaska. In short, temperature-wise this was an “underperforming” El Niño almost everywhere in the region.
Winter 2023-24 Snow
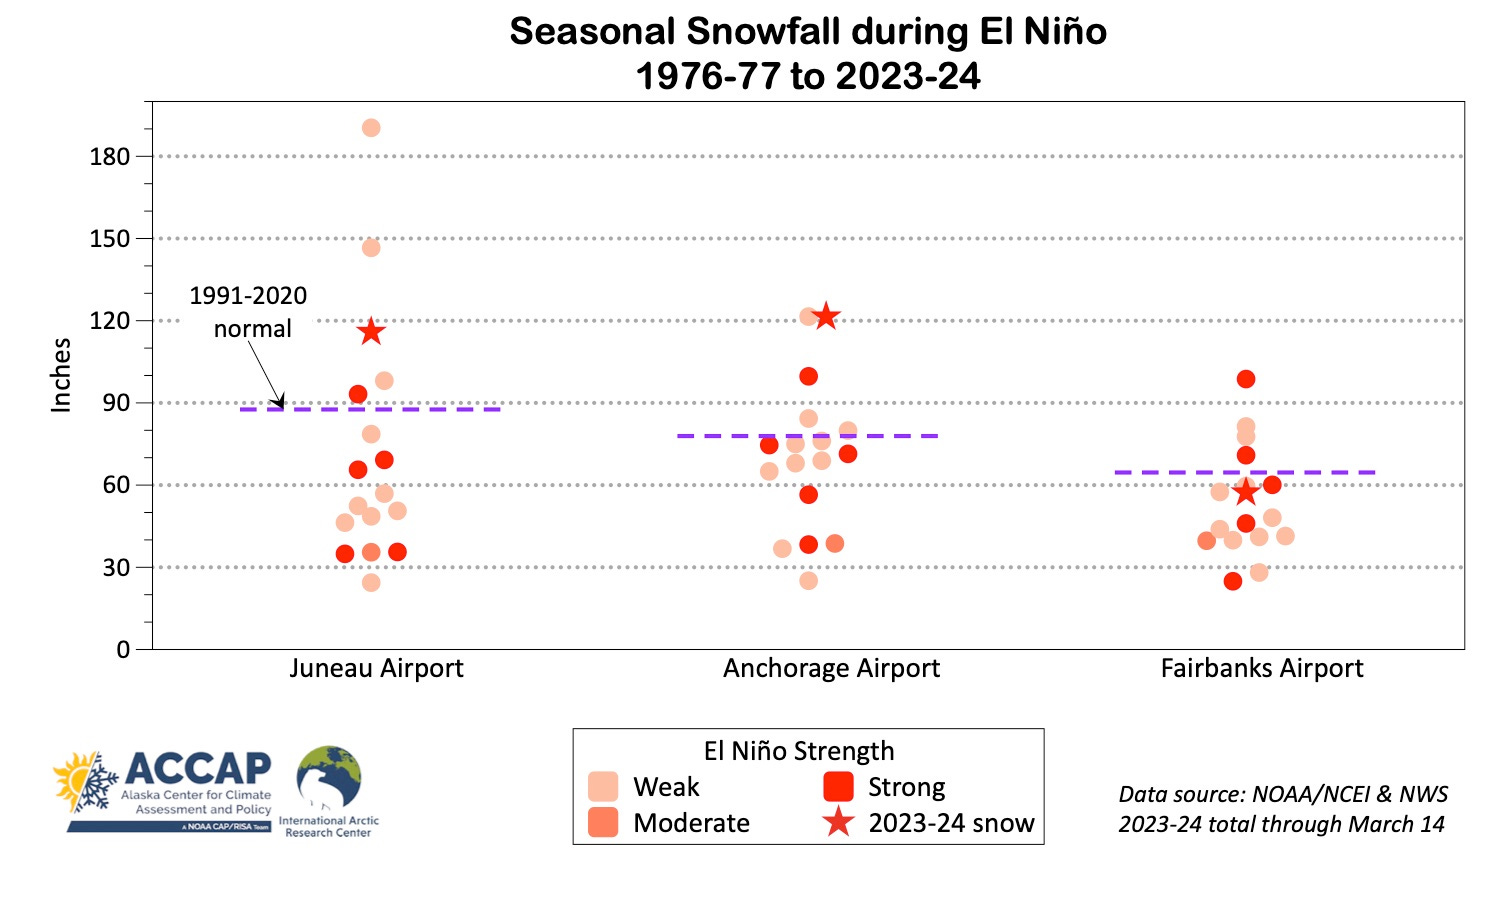
In the interest of keeping this newsletter at a reasonable length, I’ll leave off the graphics for precipitation and focus on snowfall, which has certainly been impactful in many sections of southern and southwest Alaska this winter. Figure 5 plots the total season snowfall (September 1 through March 14) for Alaska’s three largest cities during each El Niño since the mid 1970s. All three communities (or at least their airports) have had more snow than the typical El Niño winter, but only Anchorage is poised to set a record. Juneau’s snowfall is well above normal but both 1994-95 and 2006-07 had much more. Juneau snowfall this winter is also a useful reminder of the importance of sub-seasonal variability: almost 60 percent of Juneau’s 116 inches of snow (so far) fell in an 11-day period in January, highlighting that comparatively short lived weather patterns can have an outsized influence on seasonal precipitation and snow totals (anytime, not just during El Niño).
Why wasn’t this a typical El Niño for Northwest North America?
Although this was the fourth highest DJF ONI in the past 50 years, there are several indications that the atmospheric response was more typical of a weak El Niño. Figure 6 shows the average outgoing longwave radiation3 departure from normal for the 16 El Niños 1976-77 to 2022-23 (left) and this winter (right). Outgoing longwave radiation in the deep tropics serves as a proxy for thunderstorms, and it’s through the transfer of momentum and moisture from these big low latitude thunderstorms and the subsequent influences on mid-latitude storm tracks, that slight changes in sea surface temperatures near the equator can impact higher latitude weather and seasonal climate. During El Niño, these big thunderstorms typically occur much farther east than otherwise, which “pulls” the jet stream coming off of Asia and across the higher latitude Pacific Ocean farther to the east.

The most dramatic feature of this winter’s equatorial thunderstorm activity is the reduced activity south and southeast of Hawai’i compared to the 16 El Niño average, and this is much different that the three winters with higher ONI values (1982-83, 1997-98 and 2015-16) than this year, when excess thunderstorm actively extended much farther east.
Another indication of the comparative weakness of the atmospheric response was decreased higher latitude jet stream level north/south wind flow compared to some other El Niños, which allowed the Arctic to overall be more isolated from the mid-latitude influences.
There has been a lot of chatter in the climate science world about this apparently weak response during strong El Niño, and there’s ongoing research into this question. Right now most of the speculation centers on the record warm global ocean temperatures “interfering”. I’m leaning toward the sustained warmth in the far western equatorial Pacific Ocean as an important factor. Sea surface temperatures west of the dateline in the equatorial Pacific Ocean are nowadays usually warm enough to support thunderstorms, and this winter the sea surface temperatures remained higher than in some past El Niños, which may have partially suppressed thunderstorm activity farther east.
Technical details:
For each El Niño winter the average temperature was compared against the 30-year standard baseline that would have been in use at the time. So for the El Niños in the 1970s, the 1941-70 baseline was used. For El Niños in the 1980s, the 1951-80 baseline was used, etc. This procedure provides a consistent “departure from normal” and adjusts for the trend in winter temperatures. This is just one way to define “normal”. There are other perfectly valid ways to define “normal” that yield slightly different results, but the story is the same.
ERA5 reanalysis data from ECMWF/Copernicus and data available here.
Monthly composites and graphics from the NCEP/NCAR reanalysis available here.
Code by B. Brettschneider/NWS Alaska Region allowing rapid ERA5 regional analysis is invaluable for my work.
NOAA/Climate Prediction Center upgraded the “El Niño Watch” to “El Niño Advisory” with the El Niño/Southern Oscillation (ENSO) Diagnostic Discussion issued June 8, 2023. Three-month ONI values since 1950 are conveniently available on the CPC website here.
Correlation is a measure of how two quantities co-vary, and can range between -1 and +1. A correlation of zero means variation in one quantity has no reflection in the second. A correlation of +1 means that there is perfect agreement between the two: as one goes up the other goes up with consistent magnitude while a correlation of -1 is a mirror image: as one goes up the other goes down with consistent magnitude. This does not imply that variation in one quantity causes variation in the other.
Think of “outgoing longwave radiation” as the “infrared terrestrial energy”, where “longwave” refers to radiation in the infrared (beyond the red end of visible light) part of the electromagnetic spectrum, “outgoing” refers to leaving the Earth and “radiation” here (and most climate contexts) refers to electromagnetic energy.