Alaska’s warming environment is strongly influenced by the rapid changes occuring in the cyrosphere: that is, the frozen water part of the environment, e.g. sea ice, snow and snow cover and permafrost. Summer though is the one season when the sea ice and snow changes are not major factors for Alaska and vicinity change. So it’s perhaps not surprising that the pattern of climate changes in summer differs in some respects from other seasons.
Air and Ocean Temperatures
The 50-year average temperature change in Fig. 1 shows that unlike the colder seasons, the largest temperature increases in the summer are south of the Alaska Range, with parts of the Interior and North Slope having hardly warmed at all: less than 1°F in 50 years. However, for me at least, the most eye-catching features are the large increasing in some near-shore ocean areas. These are especially prominent in Norton Sound, Kotzebue Sound, MacKenzie Bay and the western Gulf of Anadyr. These of course are areas where large rivers empty into the ocean, and the big increases reflect changes in sea ice melt and inflow of comparatively warmer river water.
Figure 2. shows the change in average ocean surface temperatures between 1979 and 2022.1 While the changes are generally most pronounced near the mouths of the big rivers , there are exceptions. For example, the large increase north of the Russian coast just east of the dateline and Wrangel Island is not associated with a major river but rather reflects the decline of the sea ice in mid-summer. While most dramatic in the north, even in the deep waters of the southwest Bering Sea and the Gulf of Alaska sea surface temperatures are rising.
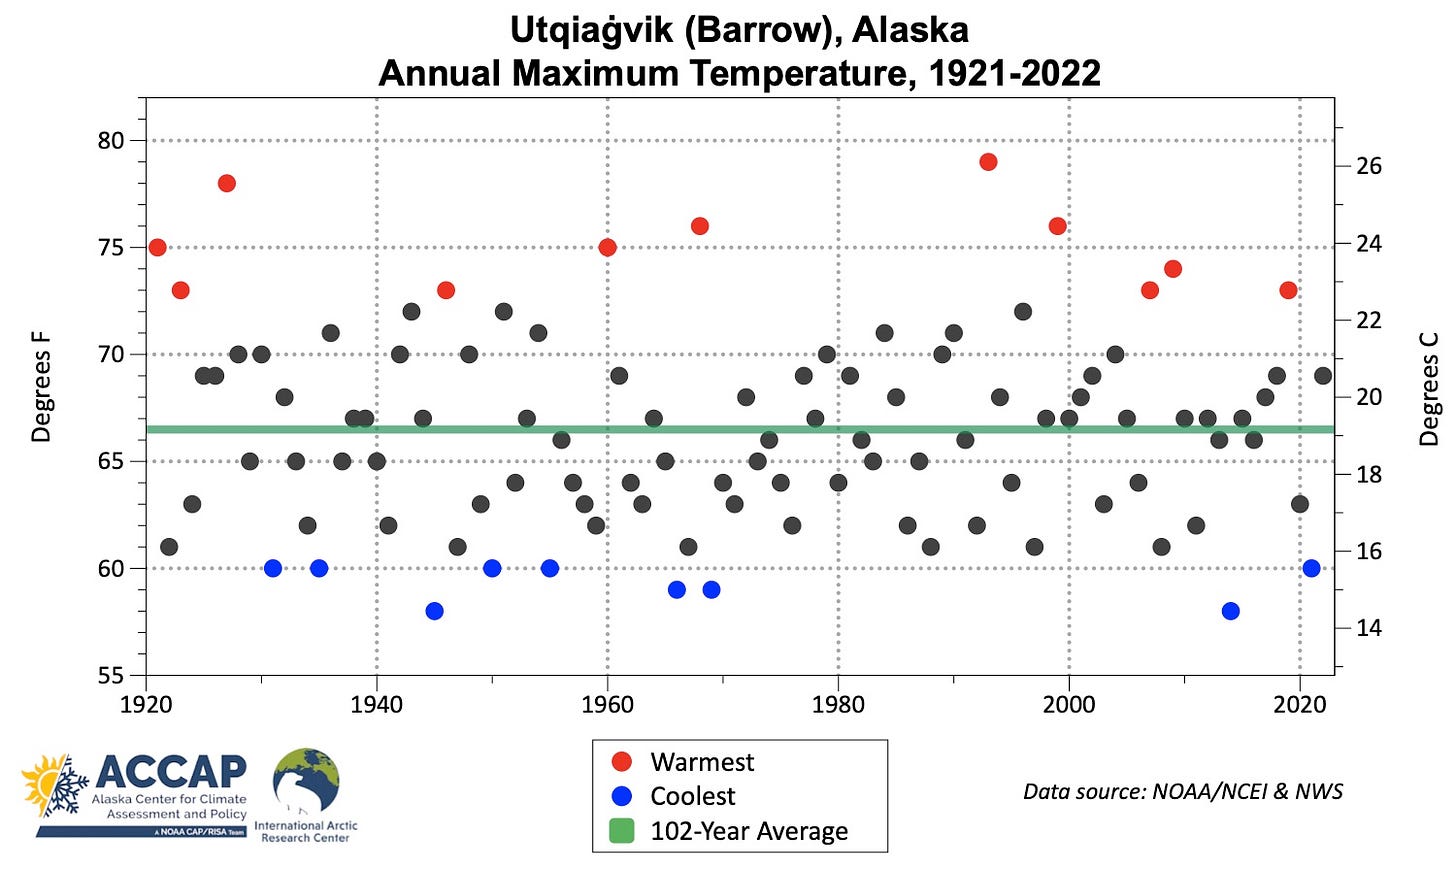
In climate change analysis we often focus on changes in averages, and there are good reasons for that, but it’s hardly the only thing that matters. We might also ask about changes of the highest temperatures. Interestingly, nearly all places in Alaska with long term climate records show little or no trend in the highest annual temperature. Figure 3 shows the highest annual temperature at Utqiaġvik over the past century, and clearly there is no long term trend.
We can also use ERA5 reanalysis to investigate this question. Figure 4 is from the recent paper “Alaska Terrestrial and Marine Climate Trends, 1957–2021” Ballinger et. al. 2023 (more about this paper in my post here). Figure 4 reproduces part of a figure in that paper, showing the trend (color field, °C per decade) and the statistical significance of that trend (stippling=trend is statistically significant) of the highest 1 percent (=99th percentile) of hourly temperatures each year. This is different than the highest single temperature: since this is based on hourly values, over the course of a year there will be 87 hours with a temperature as high or higher than the 99th percentile value. Here we see that the pattern of the largest increases in the warmest temperatures during the year are similar but not quite the same as the pattern of the average temperature changes. In particular the area in the northeast Interior shows statistically significant increases in the highest temperatures although from Fig. 1 the the 50-year trend isn’t large.
Precipitation
Changes in total summer precipitation over the past 50 years are generally small over most of the Alaska. As is the case the rest of the year, parts of the North Slope have seen a significant increase. The really interesting changes are on the south coast. The eastern Gulf of Alaska coast and most of Southeast Alaska have seen a substantial increase in summer rainfall, while the southern Bering Sea and Alaska Peninsula have seen a slight decrease. This does not look entirely like a larger climate change pattern, but rather a multi-decade shift in the prevailing summer storm track, probably superimposed a more gradual large scale increase driven by increasing evaporation from the warming oceans.
I’ve used a slightly shorter period here than my usual 50-year changes because of the importance of satellite data in sea surface temperature estimates in areas with next to no in-situ observations.


