December was very mild across nearly all of Alaska. This was notable especially because it’s not common in a cold season month for both western Alaska and Southeast to be substantially warmer than normal due to the longitude spread and the typical scale of waviness in the mid-atmosphere flow, but that’s exactly what happened in the final month of 2024.
***Updated January 5, 2024 to add the ERA5-based temperature and precipitation graphics.***
Upper Air Pattern
The flow pattern aloft explains a lot of what transpired in Alaska in December. At the level of the storm steering flow, for the month as a whole (Fig. 1), we find that high pressure was anchored to the northwest of the Bering Strait, as low pressure extended from the Sea of Okhotsk eastward across the southern Bering Sea. At the same time, high pressure extended from British Columbia northwestward into mainland Alaska with south to southeast flow into Southeast and most of mainland Alaska . This southeast-to-northwest tilted high pressure orientation is a classic set-up for above normal temperatures in Alaska and strongly orographic-modulated precipitation.

Temperature
Almost the entire state was warmer than normal in December, and except for the North Slope the departures were significant. For the month, Sitka airport’s average temperature of 42.7F (5.9C) is the highest of record there (since 1947). Iliamna came in with the third mildest December (only 1985 and 2000 had a higher average temperature), and many other places, including Nome, King Salmon, Kodiak, Anchorage, Talkeetna and Ketchikan had an average temperature that ranked in the top ten highest.

Figure 2 shows the December temperature departures from the ERA5 reanalysis.

There were some extreme daily temperatures during the month. On December 11, both Nome (44F, 6.7C) and Kotzebue (39F, 3.9C) set all-time record high temperatures for December. Nome also had, for the first time ever in December, three straight days when the temperatures remained above freezing. All total, 21 new daily record high temperatures were set (not tied) at long-term climate sites in December. Cold Bay, with a low temperature of +7F (-13.9C) on the 2nd, was the only new daily record low.
Precipitation
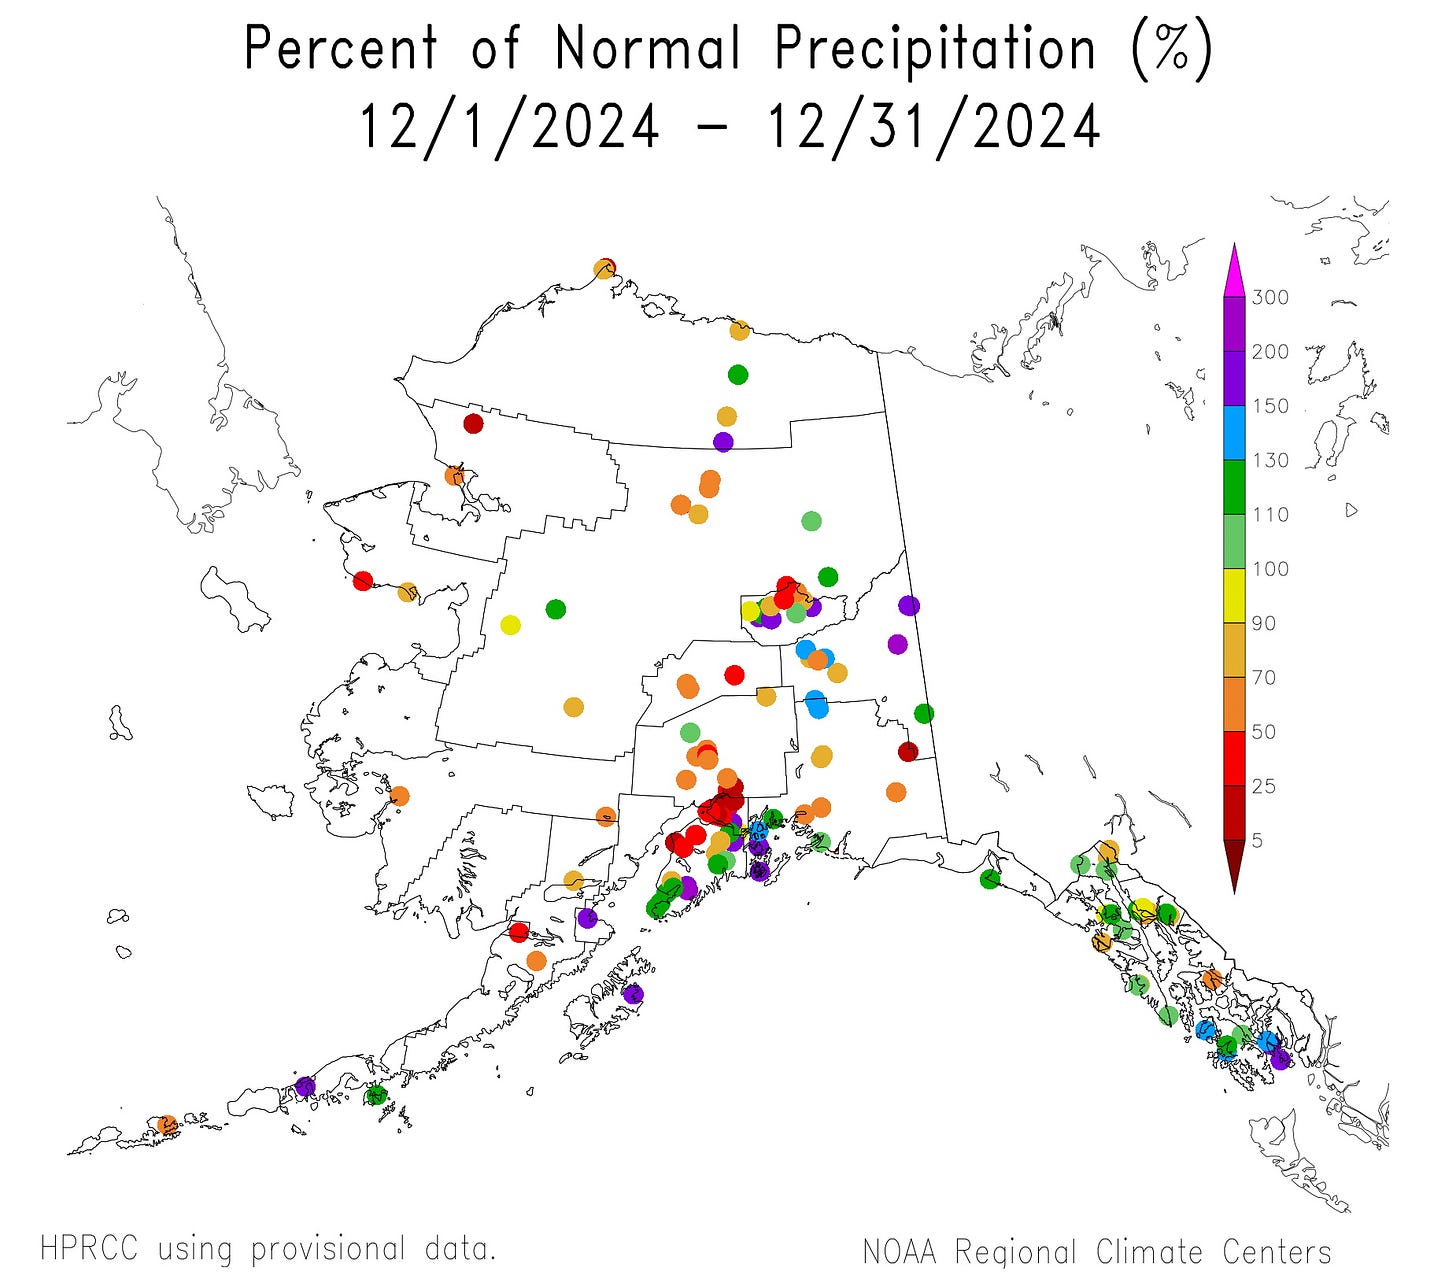
Site-specific precipitation as a percent of 1991-2020 normal is shown in Fig. 3. Winter precipitation observations in Alaska always come with a boat-load of caveats, usually the result of under-reporting of precipitation from automated stations and near total absence of quality control (I've removed a few obviously bogus totals from the graphic).

Figure 3a. shows the December precipitation as the percent of 1991-2020 average from the ERA5 reanalysis, which is broadly similar to the in situ observations.

There are only a few observations along the west coast from Bristol Bay to Northwest Arctic Borough but all the near coastal sites had below normal totals. Other patterns of note include above normal precipitation on the east side of the Kenai Peninsula and Kodiak Island but significantly below normal on the west side of the Peninsula into upper Cook Inlet and the lower Mat-Su valley. Most of Southeast saw above normal totals. The Interior is more of a mixed bag, though in general Fairbanks favored above normal totals while the northern Interior, or at least the Dalton Highway corridor, the only area with multiple observations, was drier than normal.
With persistent southeast winds aloft bringing storm after storm to the western Gulf of Alaska, it’s unsurprising that the December precipitation at Kodiak was especially high. The Kodiak airport reported 14.73 inches (374.2mm) of rain on 25 days during the month, the second highest December total in the past century.
Snow
Following precipitation, snowfall was light across the state. The highest total reported was 39.5 inches at the US Customs Station northwest of Haines. Although not at high elevation, this stretch of the Haines Highway is a very snowy area and the snow total was barely over half of the December normal. No other reporting site had even as much as two feet of snow.
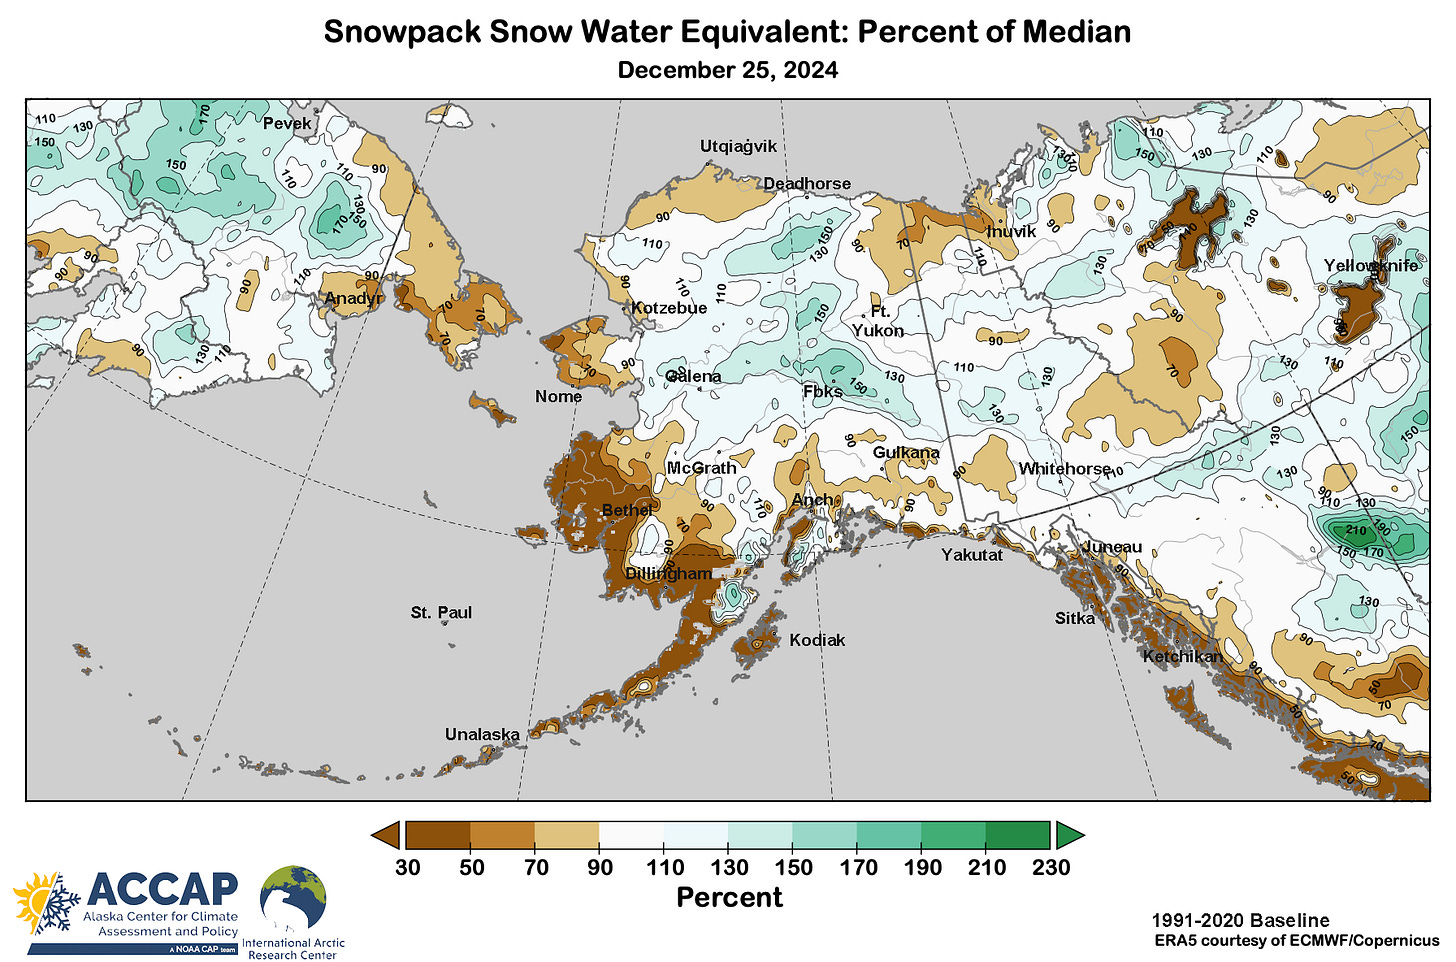
The late December snowpack, was, as usual, quite variable across the state. The ERA5 view of snowpack as a percent of the 1991-2020 median on Christmas is shown in Fig. 4. Most of the Interior except for the northeast has near to above normal snowpack, but the outstanding feature is the very low (in places non-existent) snowpack in southwest Alaska, extending north to the Seward Peninsula and into Northwest Arctic Borough. Southeast Alaska also showed well below normal snowpack. Snowpack was thin enough that travel and outdoor activities were hindered in some areas in the Yukon-Kuskokwim delta and on the Seward Peninsula.

Sea ice
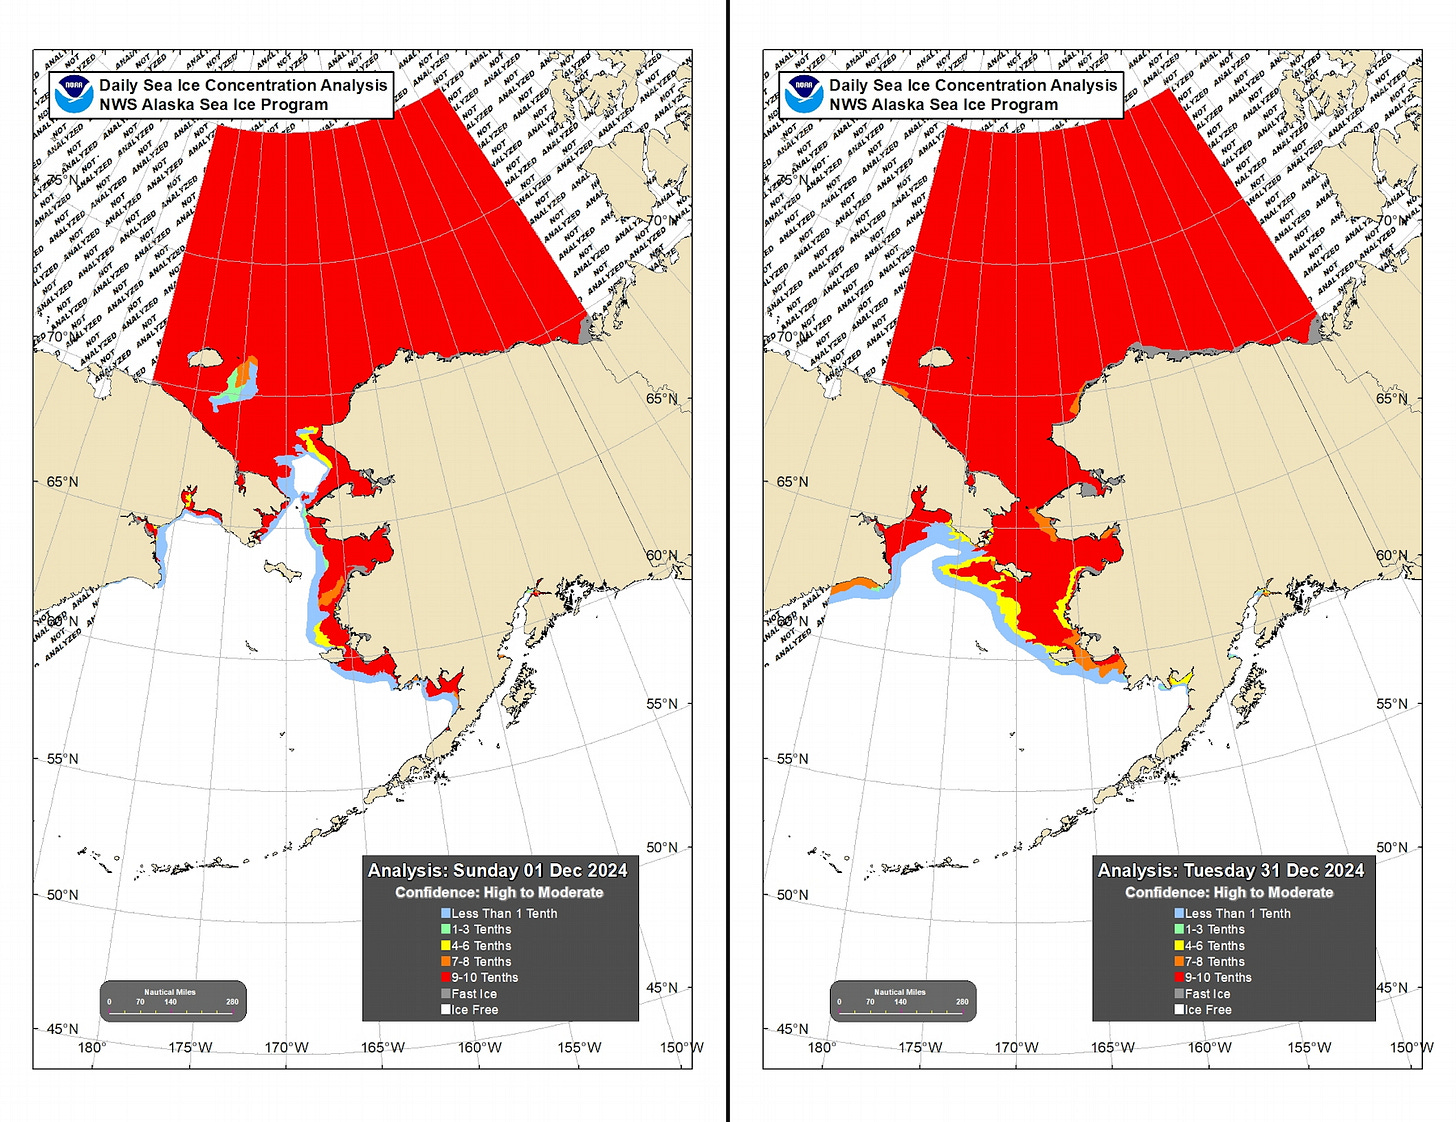
Sea ice was slow to grow in the Bering Sea in December, and ice concentrations were quite variable in the southern Chukchi Sea. Figure 5 shows the NWS Alaska Region sea ice concentration analyses for the start (left) and end (right) of the month.

Ice-over1 on the Chukchi Sea was December 4, which is earlier than most years since 2012 but not surprising given the significantly below normal sea surface temperatures during most of the summer and early autumn. For the Bering Sea, the December average sea ice extent in NSIDC data was lower than last year but overall fairly typical for Decembers since 2012.
Technical details and underlying data sources
The NCEP/NCAR reanalysis is available here and remains a useful near-real time tool for large scale, free-atmosphere evaluation.
All in-situ observations are preliminary and subject to change, though I do “on-the-fly” QC.
The High Plains Regional Climate Center mapping tool is available here.
Site-specific climate statistics and factoids from NOAA Regional Climate Center’s ACIS website here.
National Weather Service Alaska Region Sea Ice Program analyses available here.
The NSIDC Sea Ice Index is based on the comparatively low resolution passive microwave data (nominal 25km² by 25km² but in practice is not that good) and given as the 5-day trailing average, so slightly lags changes in sea ice. At regional to Arctic-wide spatial scales this is usually not significant. Details on the Sea Ice Index are here.
Ice-cover is the first date in the fall/early winter that open water covers less than five percent of a basin in NSIDC Sea Ice Index data.


