


Alaska annual snow trends
A complex story but trends emerging

You may have seen the November 13 article in the Washington Post (link, possibly pay-walled, here) about the 2024-25 winter snow outlook and longer term trends in snowfall around the US. Unlike many national climate stories, this one included Alaska, with quotes from our colleague Dr. Brian Brettschneider with the NWS Alaska Region. I’ve had several posts on seasonal snowfall trends so this is a good excuse to look at the annual snow trends for Alaska.
Difference in Averages
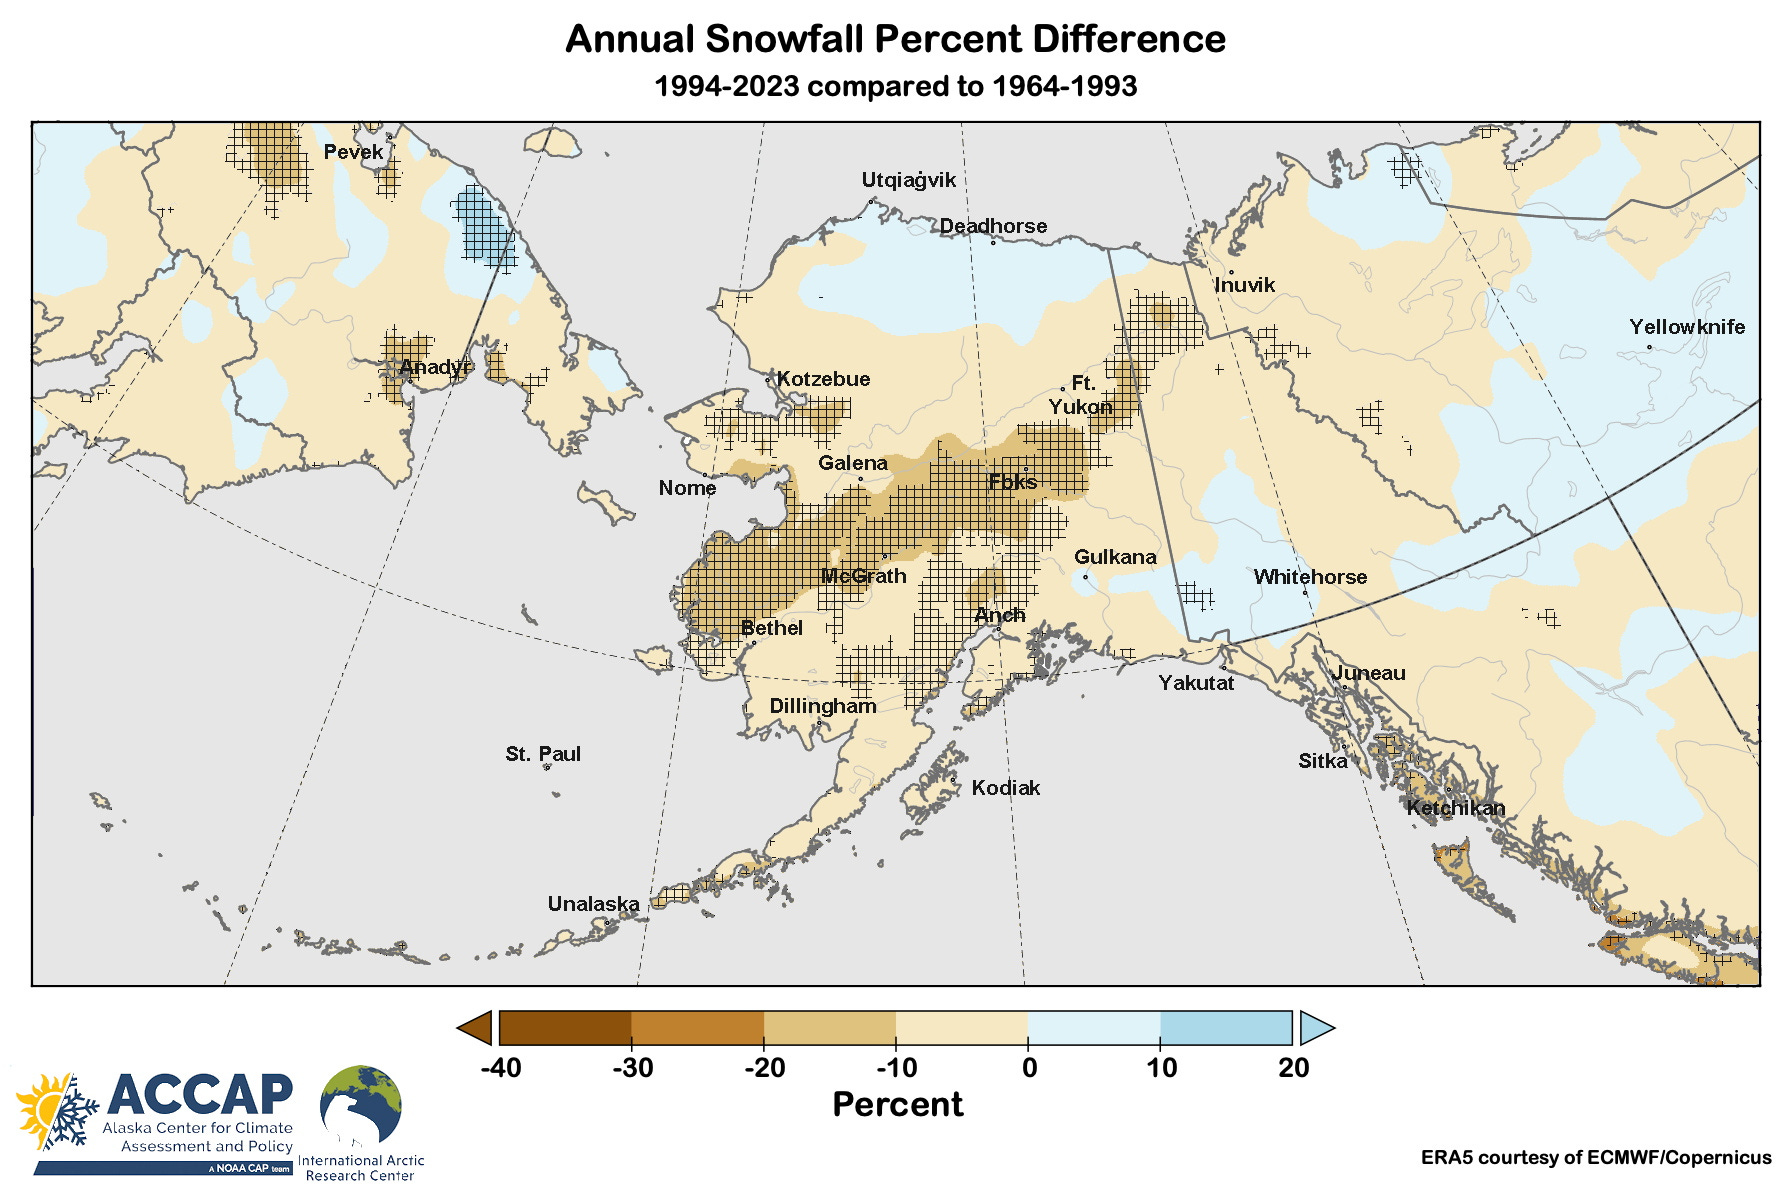
Figure 1 basically reproduces the Alaska insert map in the WaPo article (plus of course adjacent lands in Canada and Russia). This is just the percent difference of the most recent 30-year annual average snow (1994 through 2023) relative to the average of the previous 30 years (1964-1993) based on ERA5 reanalysis.
The most recent 30 years have averaged less snow than 1964-1993 in most of Alaska, while the North Slope and parts of the southern Yukon, Northwest Territories and northeast Russia have seen a bit more snow.

Whenever I see this kind of “difference of averages” graphics, my first thought is always: is the difference shown meaningful? Over multiple decades, annual snowfall (and precipitation) often have one or two extreme years that can unduly influence the averages. The year-to-year variability is important to take into account when comparing averages from different periods. In Fig. 2 I’ve hatched the areas where the difference in average snow 1994-2023 is significantly different from the 1964-93 average, based on the standard 2-sample t-test.1 The lower average in recent years is significant in a swath from the Yukon-Kuskokwim delta northeastward into the northern Yukon Territory as well as parts of Southcentral and parts of Southeast and the lower Alaska Peninsula.
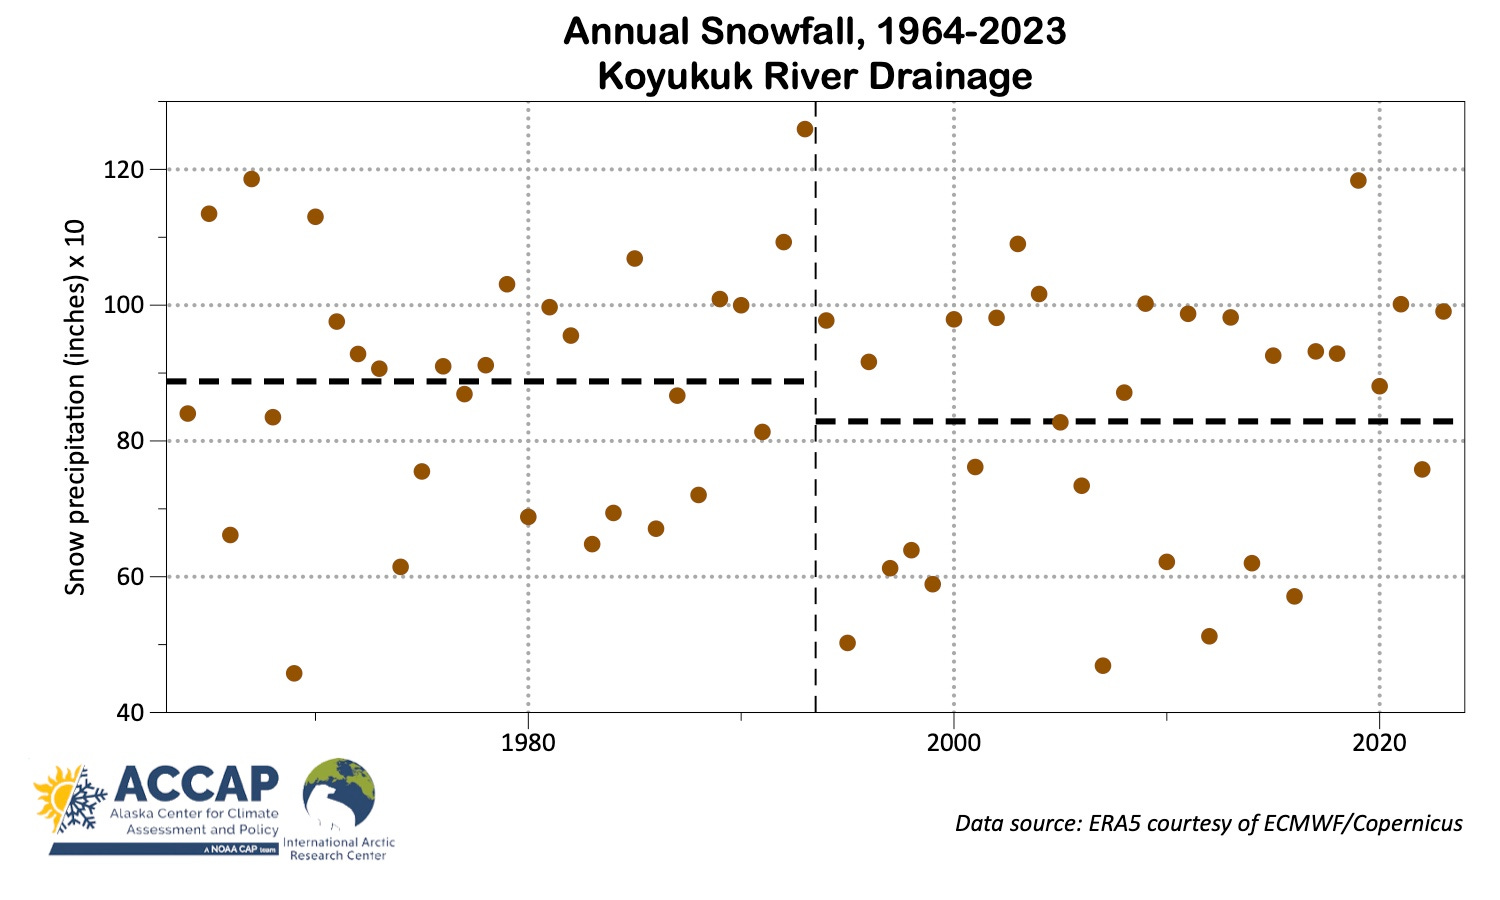
What about areas that show less snow 1994-2023 in Fig. 2 but are not shown as significantly different? Figure 3 illustrates the ERA5 annual snow for the Koyukuk River watershed in the north-central Interior, where average snow is lower for 1994-2023 compared to earlier but nowhere is significantly lower (in the statistical sense). The 1994-2023 average snow is about 7 percent lower than the 1964-1993 average but the year-to-year variability is large enough that we don’t have high confidence that the difference isn’t just from natural variability.
Change from trend
If you’re a regular reader of this newsletter you know I usually show climate changes derived from some flavor of regression, and I prefer a 50-years period whenever possible, mostly because half a century is usually long enough to smooth out some of the quasi-cyclically climate processes (e.g. La Niña and El Niño) and importantly, it corresponds roughly to a “mature adult’s” working memory. So sticking with my preferred approach, Fig. 4 shows the trend 1974 to 2023 using the same color scheme as in Fig. 1 and 2.
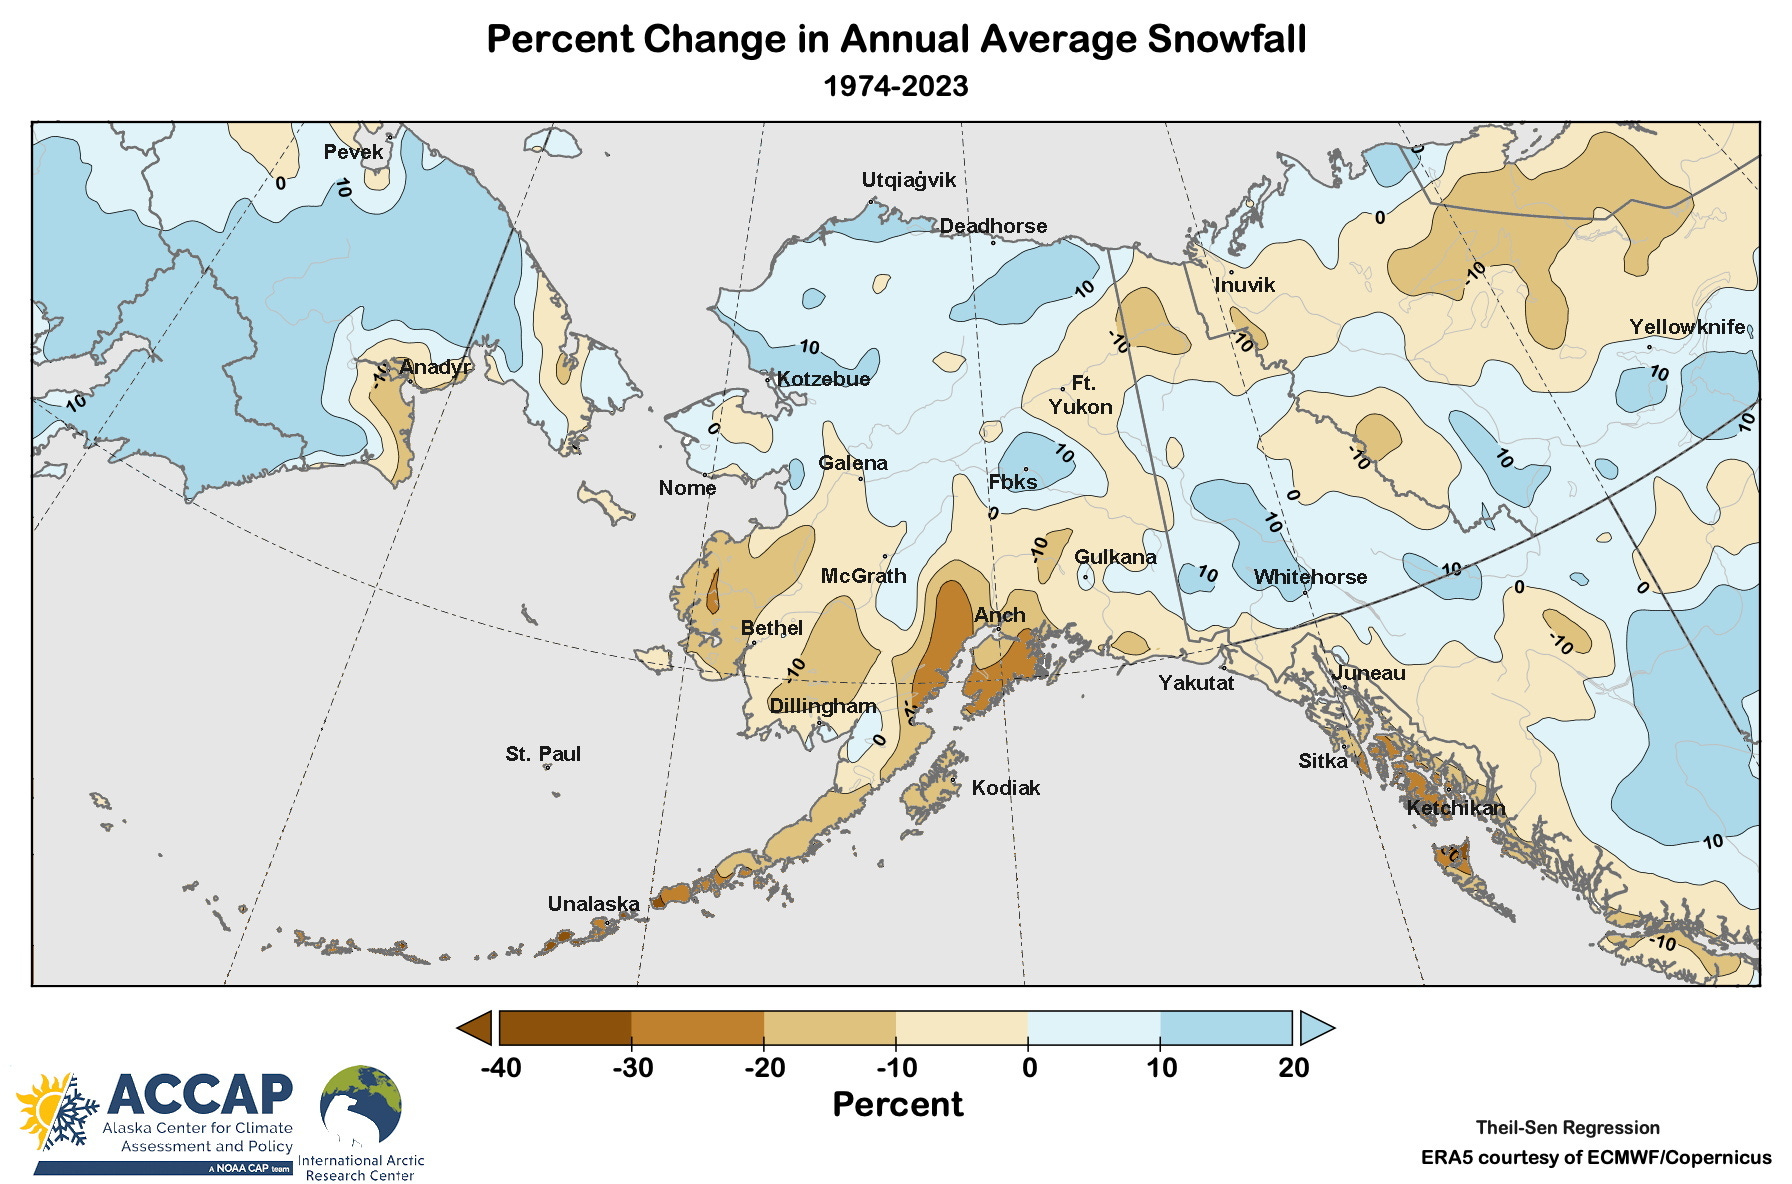
Whoa! Figure 4 is in many aspects quite different from Fig. 1, especially over the northern Interior, northeast Russia and northcentral Canada. What’s going on?
The first thing to notice is this is for a different time period than the 30-year average comparisons. In this case that is important because several years in the late 1960s and early 1970s were very snowy over much of mainland Alaska. This is obvious in Fig. 3, where three of the five snowiest years in the past sixty years in Koyukuk River watershed occurred prior to 1974, and so are not included in these 50-year trend calculations.
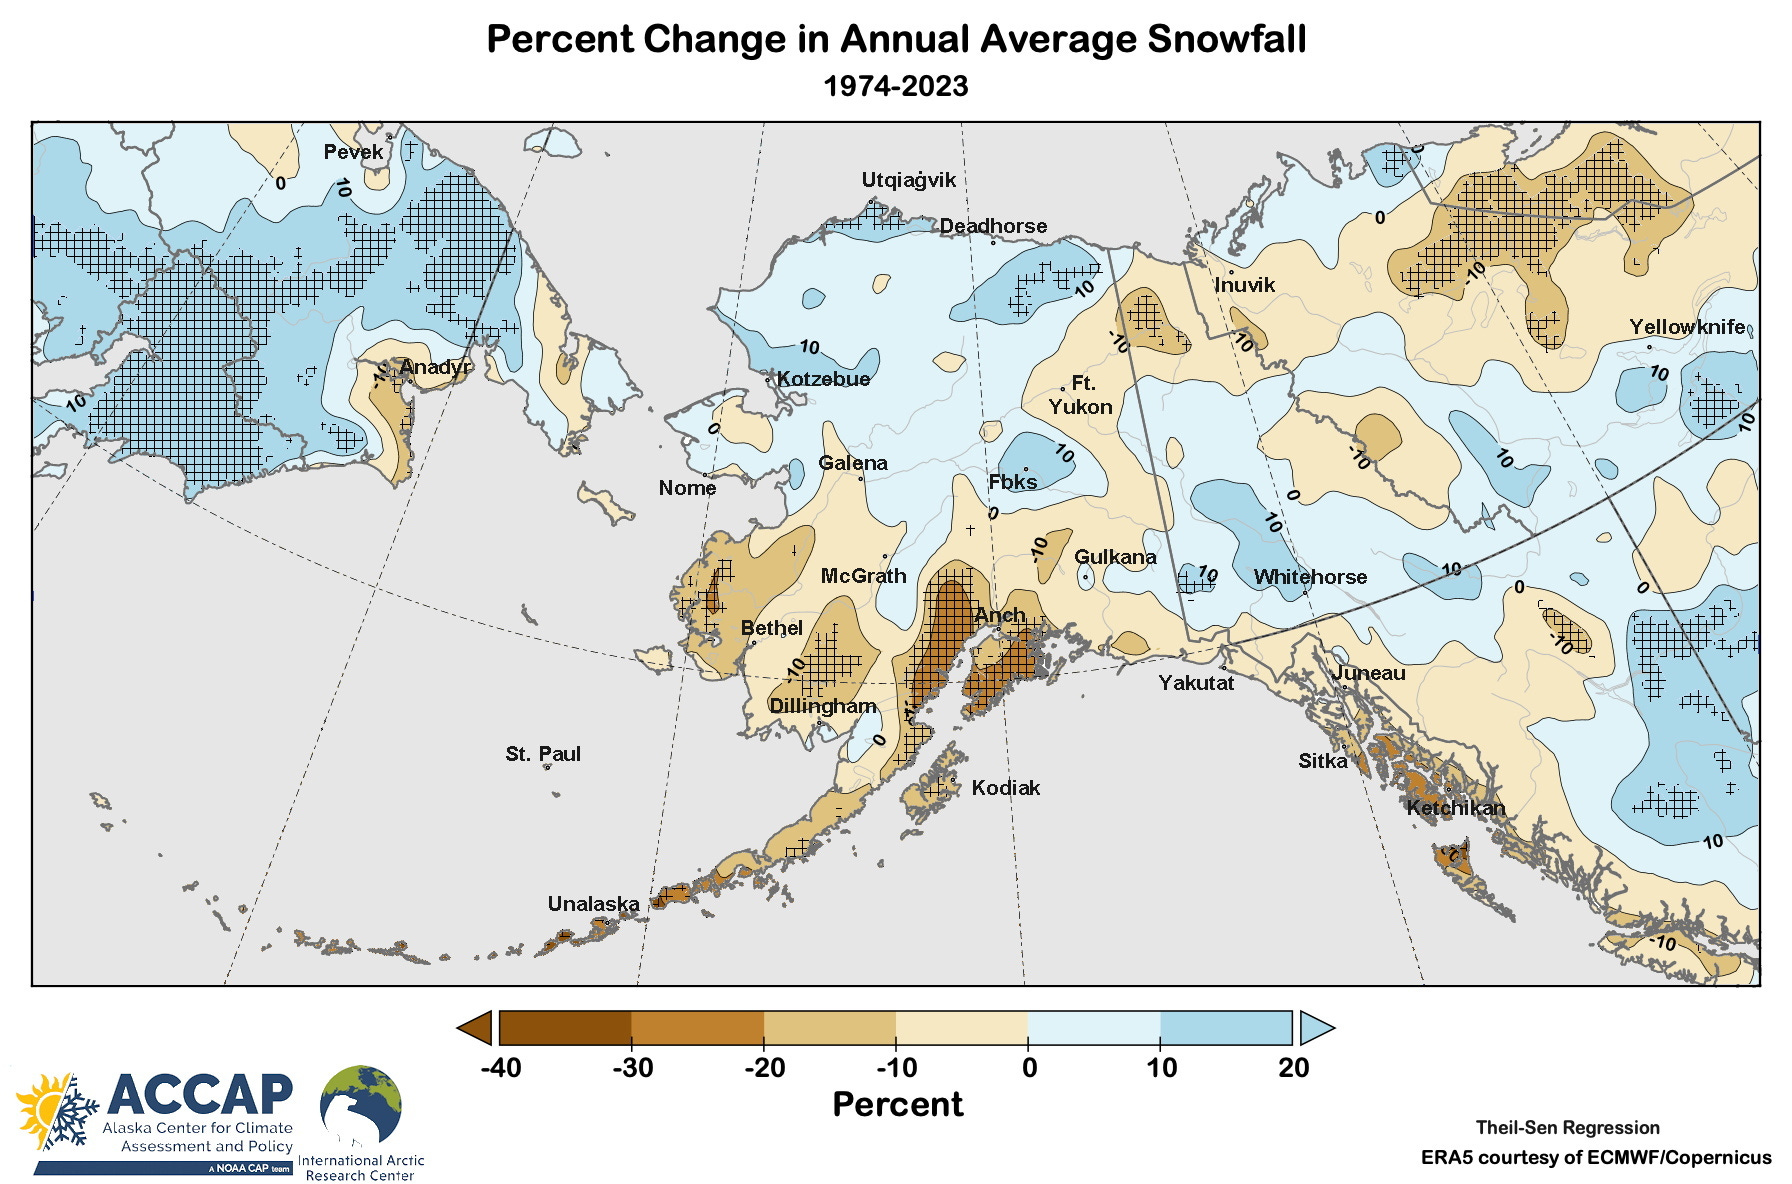
Figure 5 is the corresponding graphic to Fig. 2, showing areas with statistically significant trends with hatching. Here there is some agreement, with significant decreases showing up in the same areas in Southcentral and southwest Alaska and even in the northern Yukon Territory.
Which is right?
Both these approaches to “how is X changing” are widely used in climate science and in that sense both are correct. These examples illustrate that the time period over which change is being analyzed plays a big role in quantifying “how is X changing”.
But it is important to keep in mind that even with these different time frames and methods, the broad implications are largely the same: over most (not all) of Alaska, changes in annual snowfall are still within the natural variability that has occurred over the past 50 to 60 years. However, in some areas the changes have emerged from typical year-to-year variations, including over parts of southwest and southcentral Alaska, parts of Southeast and the Alaska Peninsula and Aleutians. The evidence is mixed over parts of the Interior, northwest Alaska (decreasing or steady) and North Slope (increasing or steady).
Technical Details
Ideally we would compare the reanalysis-derived changes with changes from in situ observations. However, hardly any climate stations in Alaska have a robust 60-year time series of total snowfall.
ERA5 monthly snow data available here. As a reminder, this is the water equivalent of precipitation the ERA5 has occuring at the surface as snow. This is different from the solid accumulation we have to shovel.
Code by B. Brettschneider/NWS Alaska Region allowing rapid ERA5 regional analysis is invaluable for my work.
The t-test applied in Fig. 2 has not be modified to account for spatial autocorrelation.
I'm wondering what stations in Alaska you would consider as robust for total snowfall records? Much of my research is in the Brooks Range and it seems that Kotzebue and Bettles have the "best" records for precipitation all year (Kotz better than Bettles). I know that snow records are particularly poor in Alaska, especially in the Arctic. Is there something in the Kotzebue record that makes it not reliable back to the 1930s, even though the GHCN records go back this far?
Figured 4 and 5 are in substantial agreement which is both reassuring and perplexing. What might be causing the significant decrease in the Anchorage region?