


Alaska and Arctic Spring Climate Trends
Warmer and Wetter

With the rapid return of sunshine to the high latitudes, thoughs turn to the coming warm season. Of course, that’s almost the definition of Spring in the Arctic: temperatures far below freezing and solid snowpack may not seem like Spring from the mid-latitude perspective, but for the Arctic, the ever increasing sun means another turn in the seasonal cycle.
Arctic Temperatures
It’s a given that Spring temperatures in and around the Arctic are warming, though the spatial patterns are a bit different than at other times of year. Figure 1 shows the change in the March through May average temperature (°C) over the past 50 years.1 The largest changes are mostly in the area from the western North Slope of Alaska westward across the northern Russian coast to the Barents Sea. Trends in Canada and Greenland are not as strong, and the area of slight (not statistically significant) cooling from southeast Interior Alaska eastward to the southeast Northwest Territories stands out simply because there has not been an increase.

For the Arctic (land and sea poleward of 60°N) as a whole, the typical Spring nowadays is 2.8°C warmer than in the mid-1970s. For Arctic land areas, the change is nearly identical, at 2.7°C in the past 50 years.
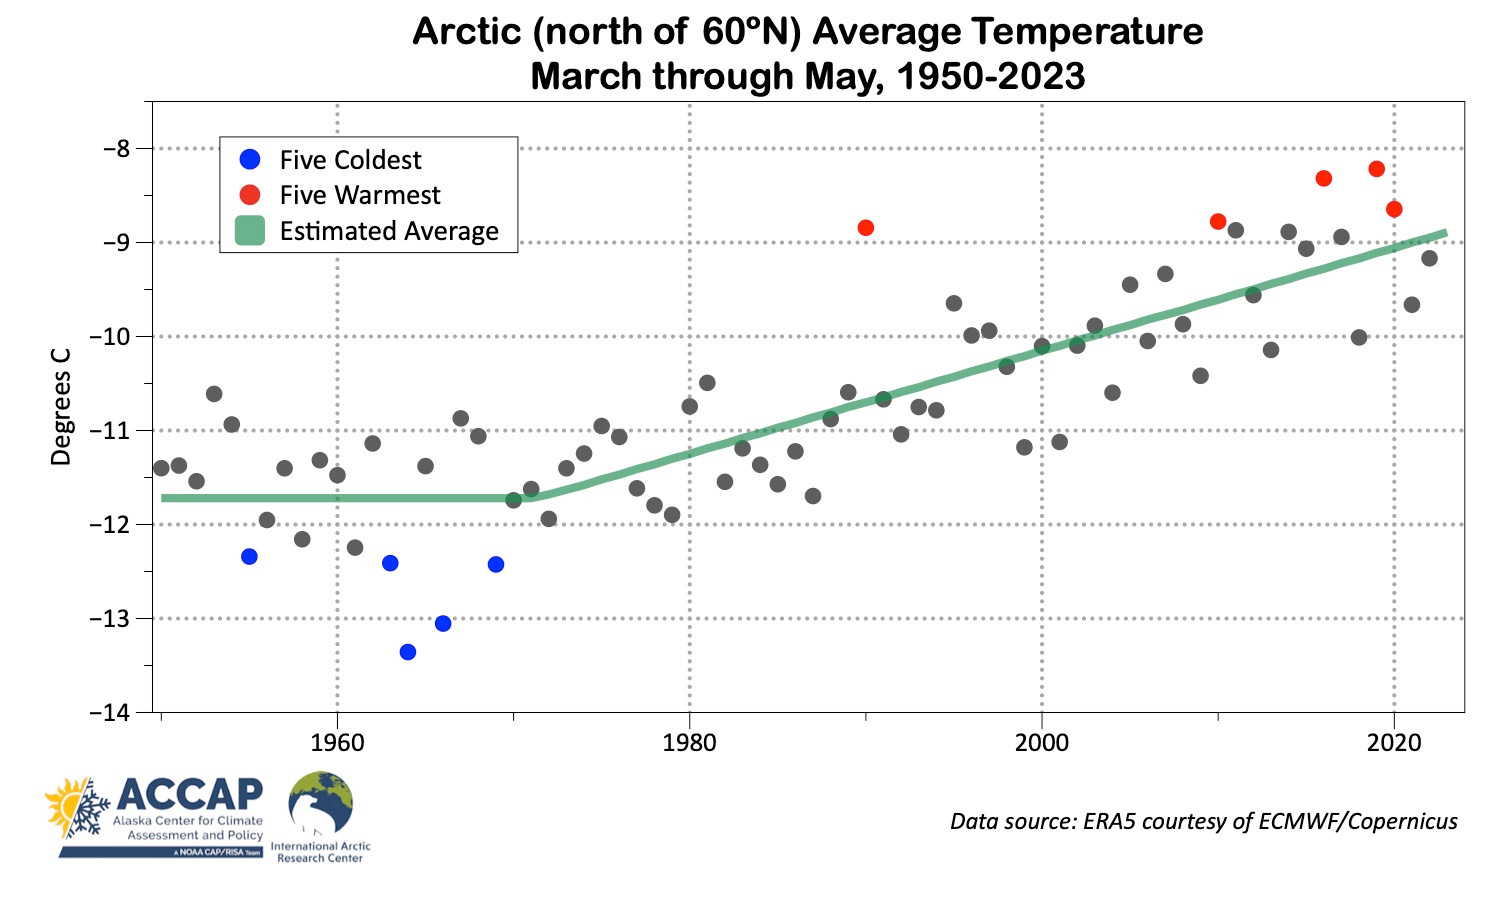
The Arctic-wide Spring average temperature time series starting in 1950, Fig. 2, shows the increase has been quite steady since the 1970s, with some, but not dramatic, year-to-year variability.
Arctic Precipitation
The Arctic is typically seeing more Spring precipitation (melted snow plus any rain) nowadays than 50 years, but unlike temperatures there are substantial areas with no significant increases. For the Arctic as a whole, the past 50 years have brought an 11 percent increase (10 percent on land) in total Spring precipitation, with the largest increases in Svalbard, the Nordic Arctic coast and portions of the Russian far east.
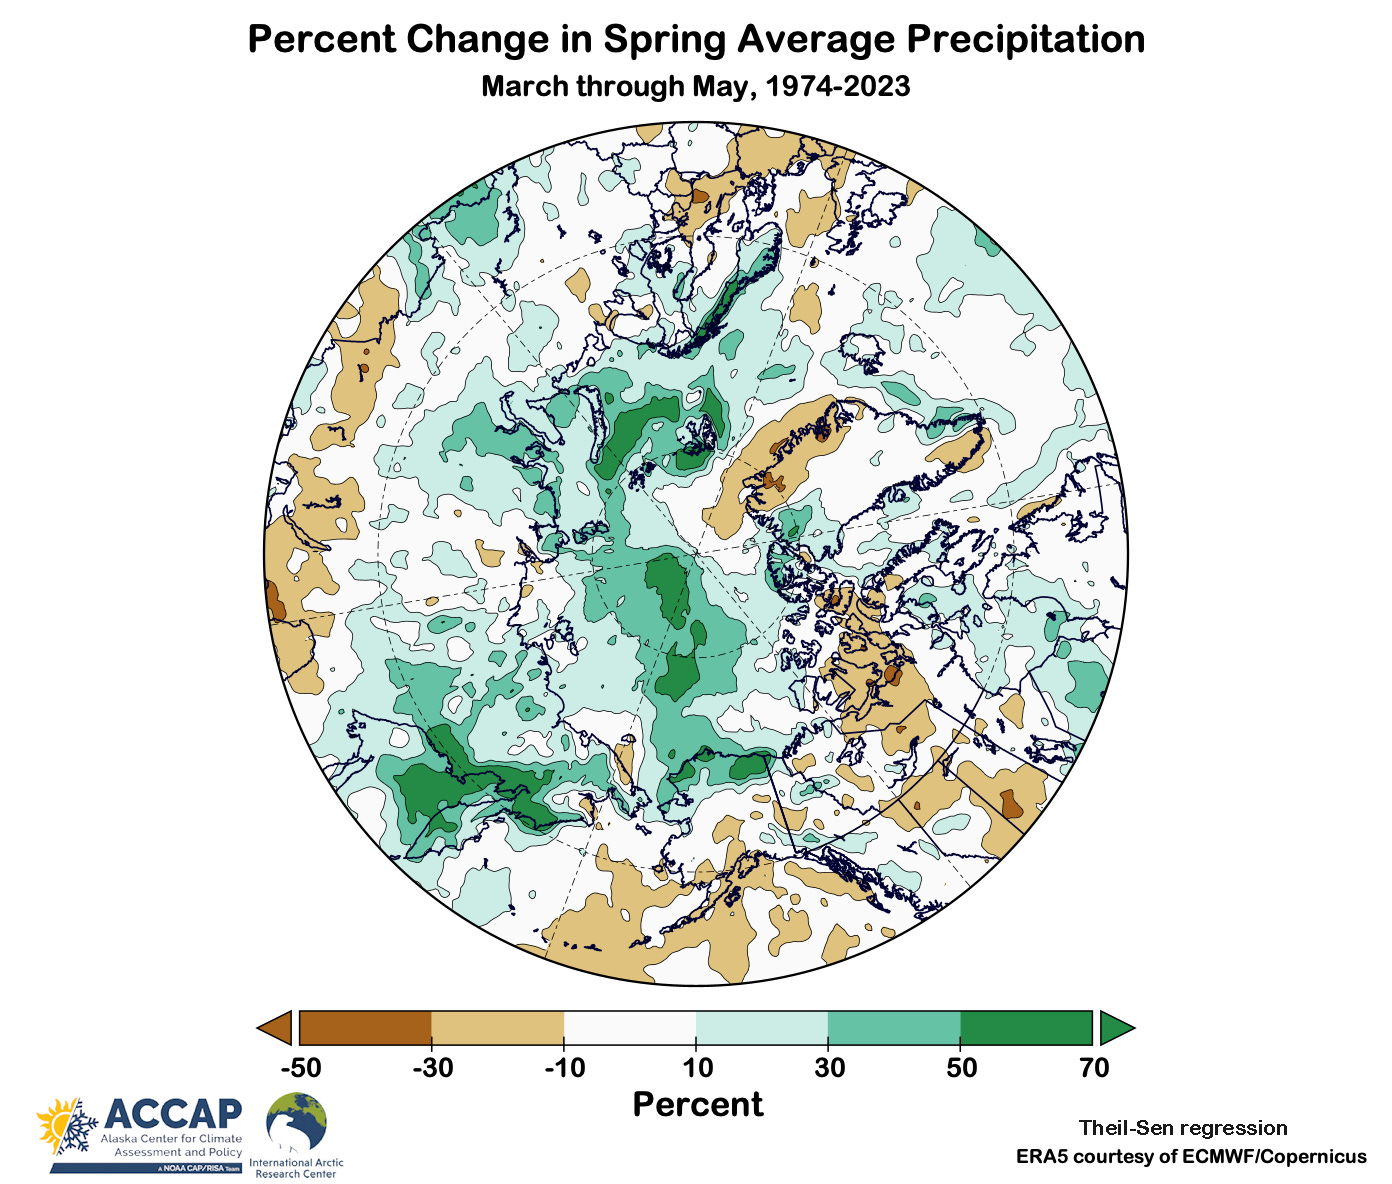
For much of the Asian and North American Arctic, Spring is the season with the lowest precipitation, so these changes in most cases do not reflect large increases in the absolute amount of precipitation. In the Atlantic and European Arctic there is less distinct seasonality to precipitation, though nowhere is Spring an especially wet season compared to the rest of the year.
Alaska Spring Trends
Temperatures in and around Alaska are warming except for a small area in the southeast Interior. Figure 4 shows the same data as in Fig. 1 except converted to °F. Unlike autumn changes, the large increases the over the Russian far northeast, North Slope and northwest Canadian coasts are not directly tied to the lack of sea ice compared to the past decades (though that is starting to be a factor at least in the southern Chukchi Sea the second half of May), but the thinner sea ice nowadays compared to the late 20th century is probably playing a role.

Alaska’s Spring precipitation has followed a different path than the Arctic as a whole. Over the past 50 years, Alaska Spring precipitation has decreased 4 percent (compared to the Arctic’s 11 percent increase). Like other seasons, the North Slope and northwest Alaska shows widespread and significant increases, while most other areas south of the Brooks Range show overall change or even slightly decreases.

The cold season snowpack is usually close to annual maximum in early Spring. Figure 5 shows the that the trends in March snow water equivalent (the amount of water in the snowpack) over the past 45 years are generally weak around Alaska.

Technical details:
Unless otherwise specified, “Arctic” here refers to land and oceans poleward of 60°N.
Temperature and precipitation analysis spatial maps and time series from ERA5 reanalysis data from ECMWF/Copernicus.
ERA5 monthly temperatures, precipitation and snow data available here.
Code by B. Brettschneider/NWS Alaska Region allowing rapid ERA5 regional analysis is invaluable for my work.
Reminder: there’s nothing magical about 50-year trends. I frequently use this because it’s a nice round number and it’s roughly the length of “mature” adult working memory.