It’s very likely that the 2023 minimum Arctic-wide sea ice extent was reached on September 19, when in preliminary National Snow and Ice Data Center analysis, sea ice extent (ice concentration 15 percent or higher) around the Arctic covered 4.23 million km². This is the sixth lowest annual minimum in the 45-year satellite record and very likely for much longer than that.
The annual sea ice minimum is probably the most widely reported Arctic climate measure. Figure 1 plots the annual minimum extent and an estimate of the time-varying average. The typical summer minimum by this analysis has decreased by 40 percent in the past 45 years, though it’s clearly not been a steady decline. The dramatic slow-down in trend in annual decrease in the past 15 years has been much discussed within the Arctic climate science community.

A new paper, led by Igor Polyakov at UAF and published in Science (open access summary here) takes an interdisciplinary approach and concludes that multi-year variations in the Arctic Dipole (an atmospheric circulation pattern: a somewhat dated wiki summary here) is a significant factor in modulating Arctic Sea ice, not only in moving ice around (long known), but if I understand correctly, even more importantly, in modulating the flow of Atlantic water into the Arctic, which is in turn effects sea ice melt from the bottom via changing water properties, e.g. temperatures and salinity at the ice/water interface. Polyakov et. al. suggest a change in the prevailing Arctic Dipole pattern is due and would bring a renewed acceleration of sea ice loss.
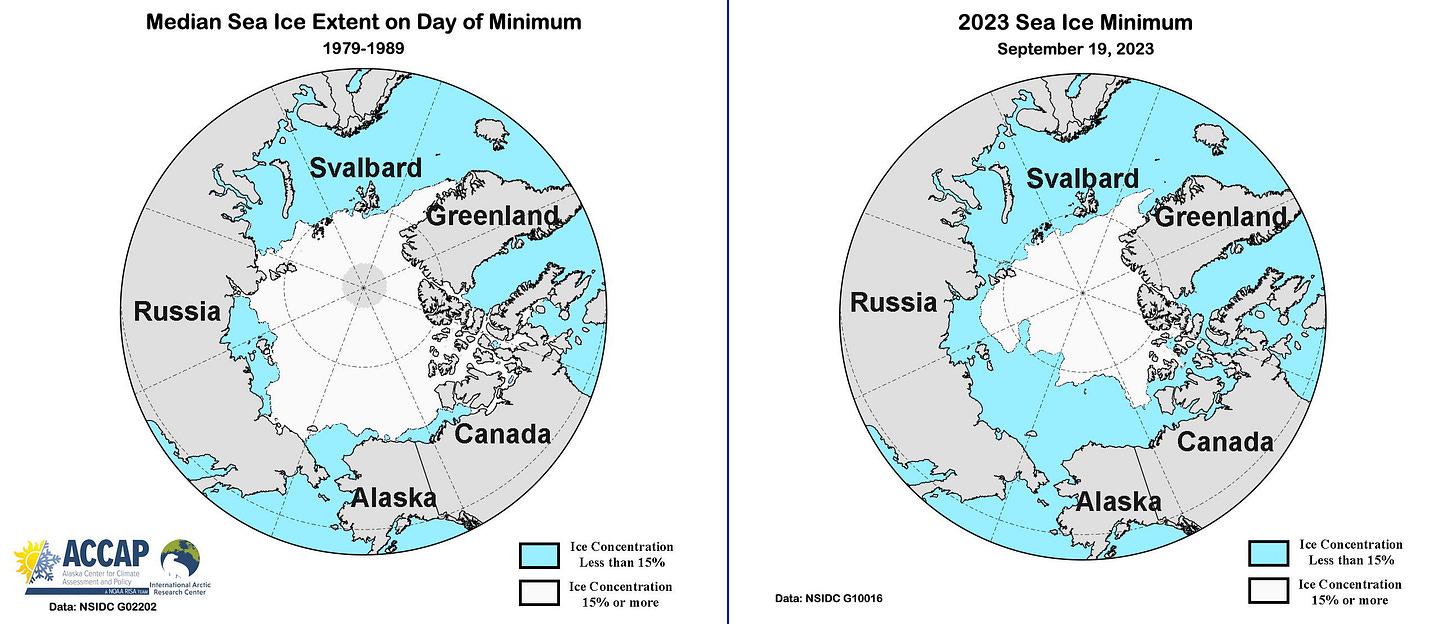
Figure 2 puts this year’s minimum extent in spatial context. On the left is the median sea ice extent on the day of the annual during first 11 years of the satellite era: this avoids cherry-picking a year for comparison. On the right is the extent on September 19th. Both the Northwest Passage (Atlantic Ocean to Bering Strait via Canadian waters) and the Northern Sea Route (Atlantic Ocean to Bering Strait via Russian waters) are wide open for non-ice hardened vessel traffic.

Figure 3 plots the Arctic sea ice extent monthly standardized departures and the 12-month running average from the start of the record in November 1978 to August 2023 using 1981 to 2010 as the baseline. I find this graphic useful because it illustrates the persistence of the decline of sea ice and that the winter ice extent recovery does not offset the summer ice loss.

Over the course of the year Arctic sea ice extent nowadays varies by more than a factor of three (in the 20th century was closer to a factor of two), so to look at long term change a useful tool are “standardized departures from average”. Standardized departures are widely used as a way to compare climate and environmental data that has a significant annual cycle, and are most simply calculated as the difference between the observed and average over some reference period divided by the standard deviation in the reference period.1
Regional Ice Extent
Figure 4 plots the rank of the 2023 minimum ice extent in the regional seas as of September 22nd. These ranks could change because of additional ice loss in the next couple weeks or through the final reprocessing that’s done annually. Note too that the definition of the regional seas used for NSIDC purposes does not match that used in some navigational and oceanographic purposes. However, the main message is clear: while not at the extremely low levels of 2012, the minimum sea ice extent on the Pacific side2 and in central Arctic Basin were quite low, while from Baffin Bay eastward as far as the the Laptev Sea this year’s minimums were not extreme by 21st century standards.

Technical details
NSIDC Arctic Sea Ice information, graphics and data available at https://nsidc.org/arcticseaicenews/
Link for Polyakov et. al. 2023 paper is here, though this is not open access.
As noted in the regional ice section, NSIDC near real-time sea ice extent estimates are reprocessed annually and so all the values here for 2023 may change very slightly. More information can be found in section 2.3 of the Sea Ice Index, Version 3 User Guide, pdf available here.
More sophisticated ways of creating “standardized departures” are available for handling quantities with meaningful lower or upper bounds or that that vary by orders of magnitude. So far we don’t need to employ such techniques for sea ice at the Arctic-wide scale.
The rank of the Chukchi Sea annual sea ice minimum is increasingly meaningless (at least on the low end) as nowadays in nearly all the ice is melting out in many years, e.g. this year at minimum, 97.5 percent of the Chukchi Sea was open water.


