Winter 2022-23 Recap

This post pulls together some analyses of basic climate conditions for the winter 2022-23 season. I had this planned this review for last week but the big western Alaska storms of early March grabbed the headline. Hence the delay.
Temperatures
Arctic-wide winter (December through February) 2022-23 average temperature departures from the 1991-2020 normal (°C) from ERA5 are presented in Fig. 1. The largest departures were in the Svalbard and Franz Josef Land region, with (near) record low sea ice playing a major role. Largest below normal areas were in central/eastern Siberia and parts of Canada. Alaska and the Russian Far East plus the Nordic Arctic were mostly above normal but not dramatically so. Based on analysis by Brian Brettschneider, in some areas in eastern Svalbard the average temperature this winter was higher than any since 1950-51, while a small area in the Sakha Republic, Russia had the coldest winter in the same 73 years.

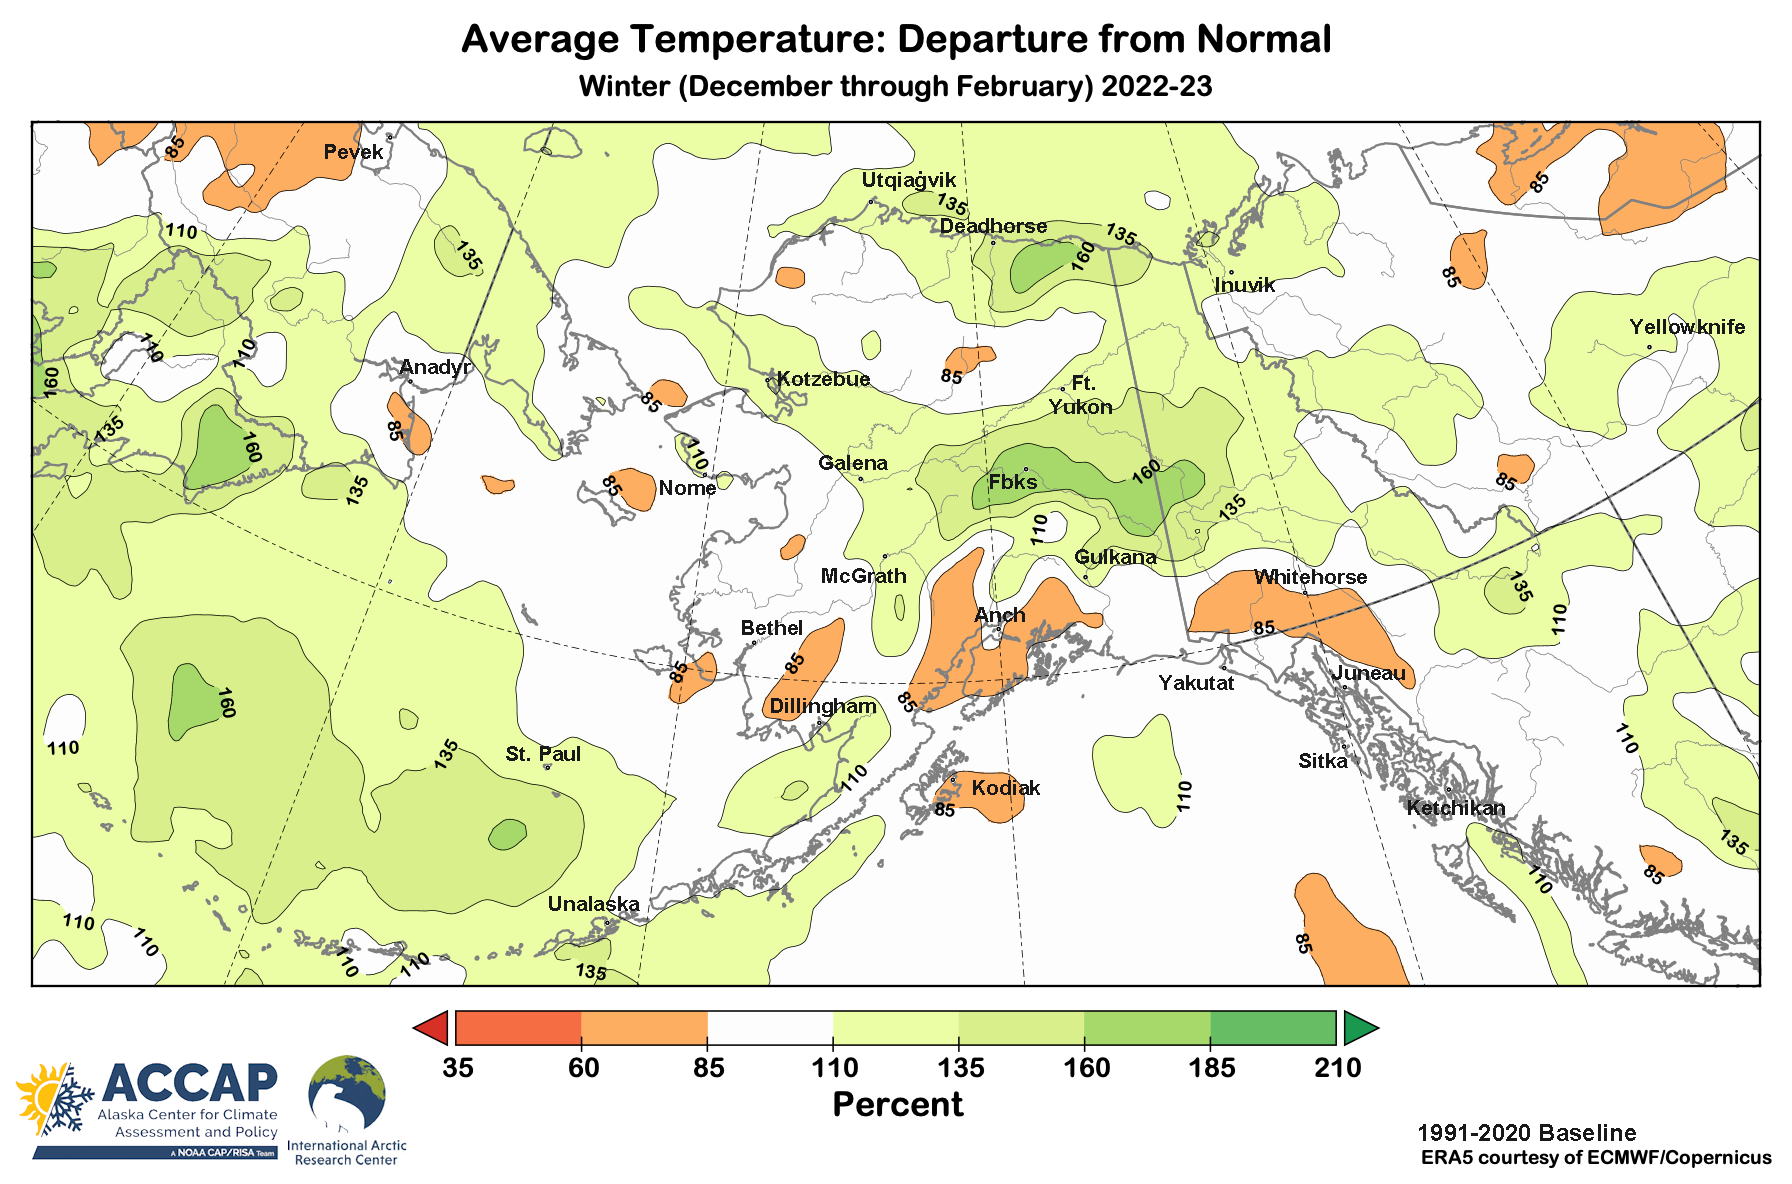
Zooming into Alaska and vicinity in Fig 2., we see that most of the Russian Far East, Alaska and the Yukon Territory finished up with near to above normal average temperatures. Of course, there was lots of variability at the monthly and sub-monthly scale, including all-time record winter high temperatures on the western North Slope in early December and extended deep cold in the eastern Interior. Most areas north of a Nome to Fairbanks line as well as Southeast Alaska had a milder overall temperature than last winter. Elsewhere average temperature were similar to winter 2021-22.

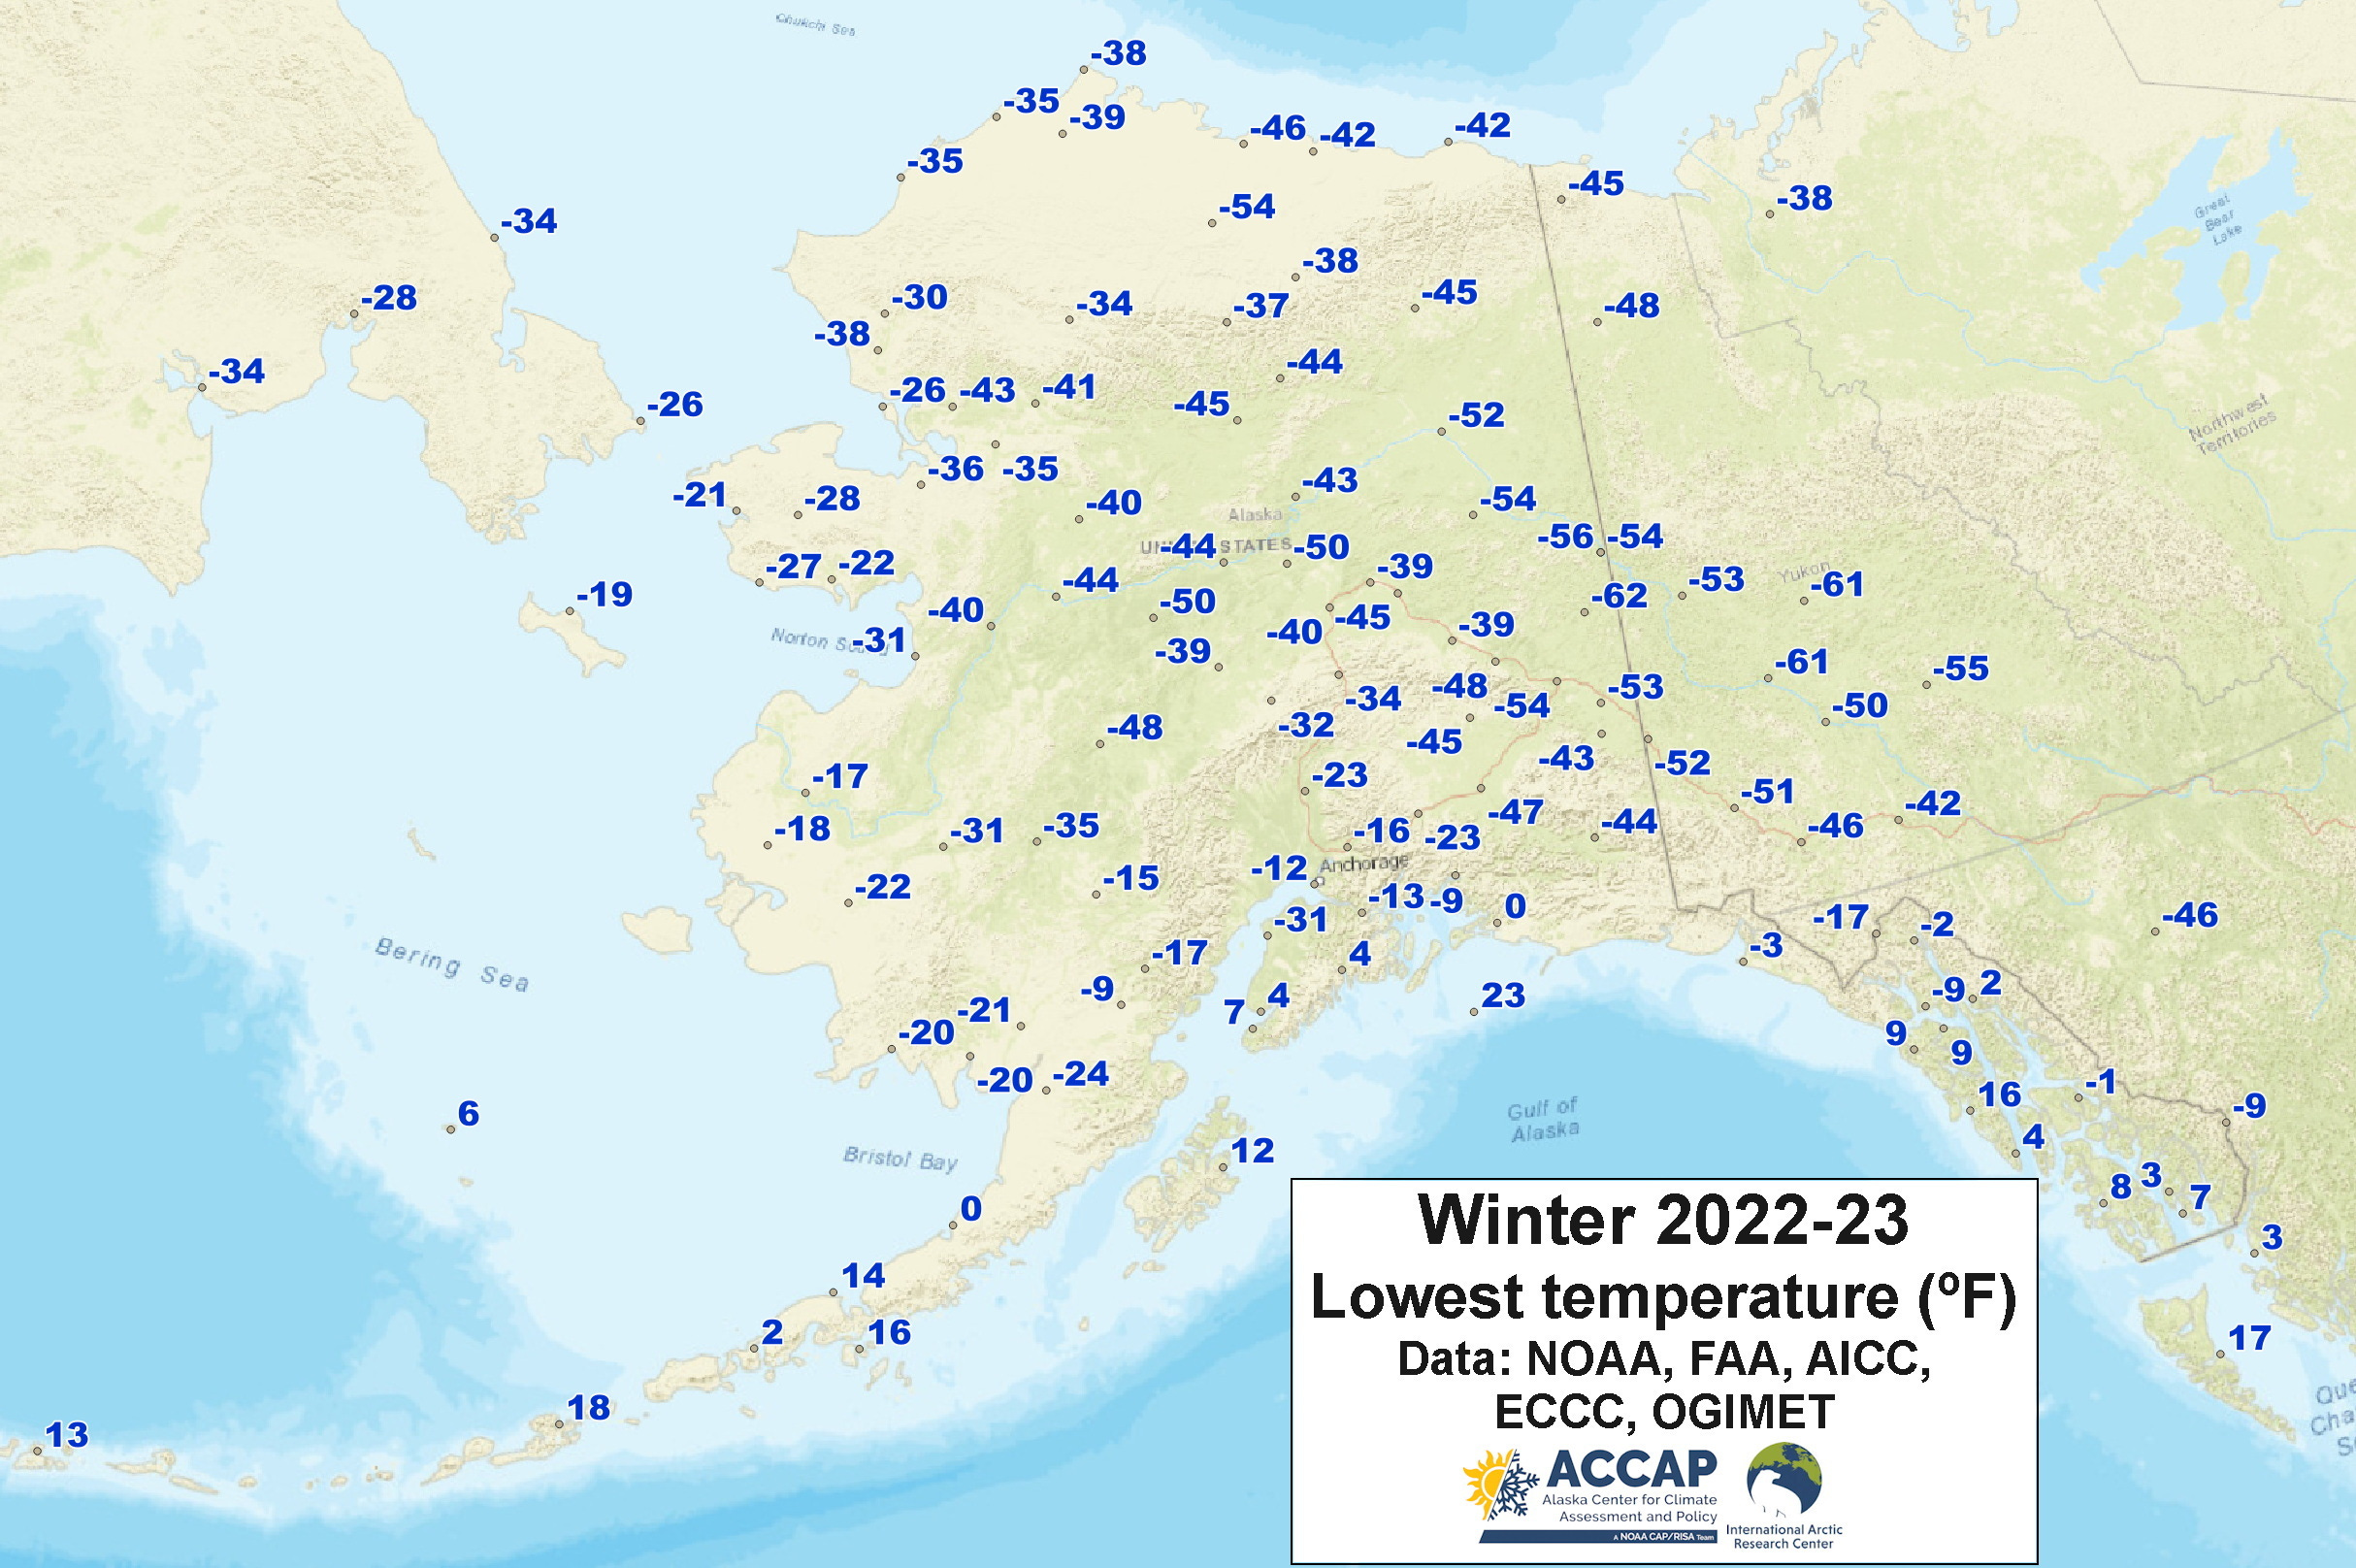
Always of interest are the lowest temperatures in the winter. Figure 3 plots the cold season lows from a variety of sources. Not all of these are part of the official climate record but all are from federal agency weather stations that I believe to be reliable. The pre-Christmas deep cold in the eastern Interior and central Yukon that in hindsight brought the lowest temperatures this past winter was not extreme by historical perspective but was the longest stretch of deep cold in this area since winter of 2008-09 and the -62F at Chicken the lowest in Alaska since January 2020. Possibly the most significant individual temperatures was the -31F at Kenai, the lowest December temperature in more the 50 years, but overall only the lowest since January 2017.
One of the most frequently asked questions I’m asked is what El Niño or La Niña means for Alaska. We’ve looked at this in a lot of ways, but as Fig. 4 shows, for Alaska as a whole at the seasonal scale, La Niña just does not add much as a forecast tool (that’s different than El Niño): for more than 40 years, knowing that there are La Niña conditions in the equatorial Pacific just does not give us much insight at the statewide scale, even when taking into account the long term warming trend. However, there are some modest sub-regional correlations south of the Brooks Range. The single most prominent feature of La Niña winters in Alaska is the subseasonal variability in weather patterns, and this past winter certainly lived up to that expectation.

Precipitation
Total precipitation for the winter was generally near to above normal with a few exceptions, mostly notably parts of the Kenai Peninsula and Prince William. As we’ve previously discussed, the ERA5 reanalysis used in Fig. 5 does not have spatial resolution to fully capture the localized but important extreme precipitation in the Anchorage area. At Anchorage Airport the December to February total of 6.04 inches was more than twice normal and easily the highest winter total on record (since 1953-54), though “only” the fourth highest snowfall. In an measure of how restricted that extreme level of precipitation was, at Palmer, the long term cooperative station at the Matanuska Experimental Farm had above normal precipitation but not in the top ten, and at the more recent cooperative station near Soldotna three month precipitation total was only about 125 pecent of normal in spite of the record high total in December.