
What's Normal in a Changing Arctic Climate?
Depends on your interest

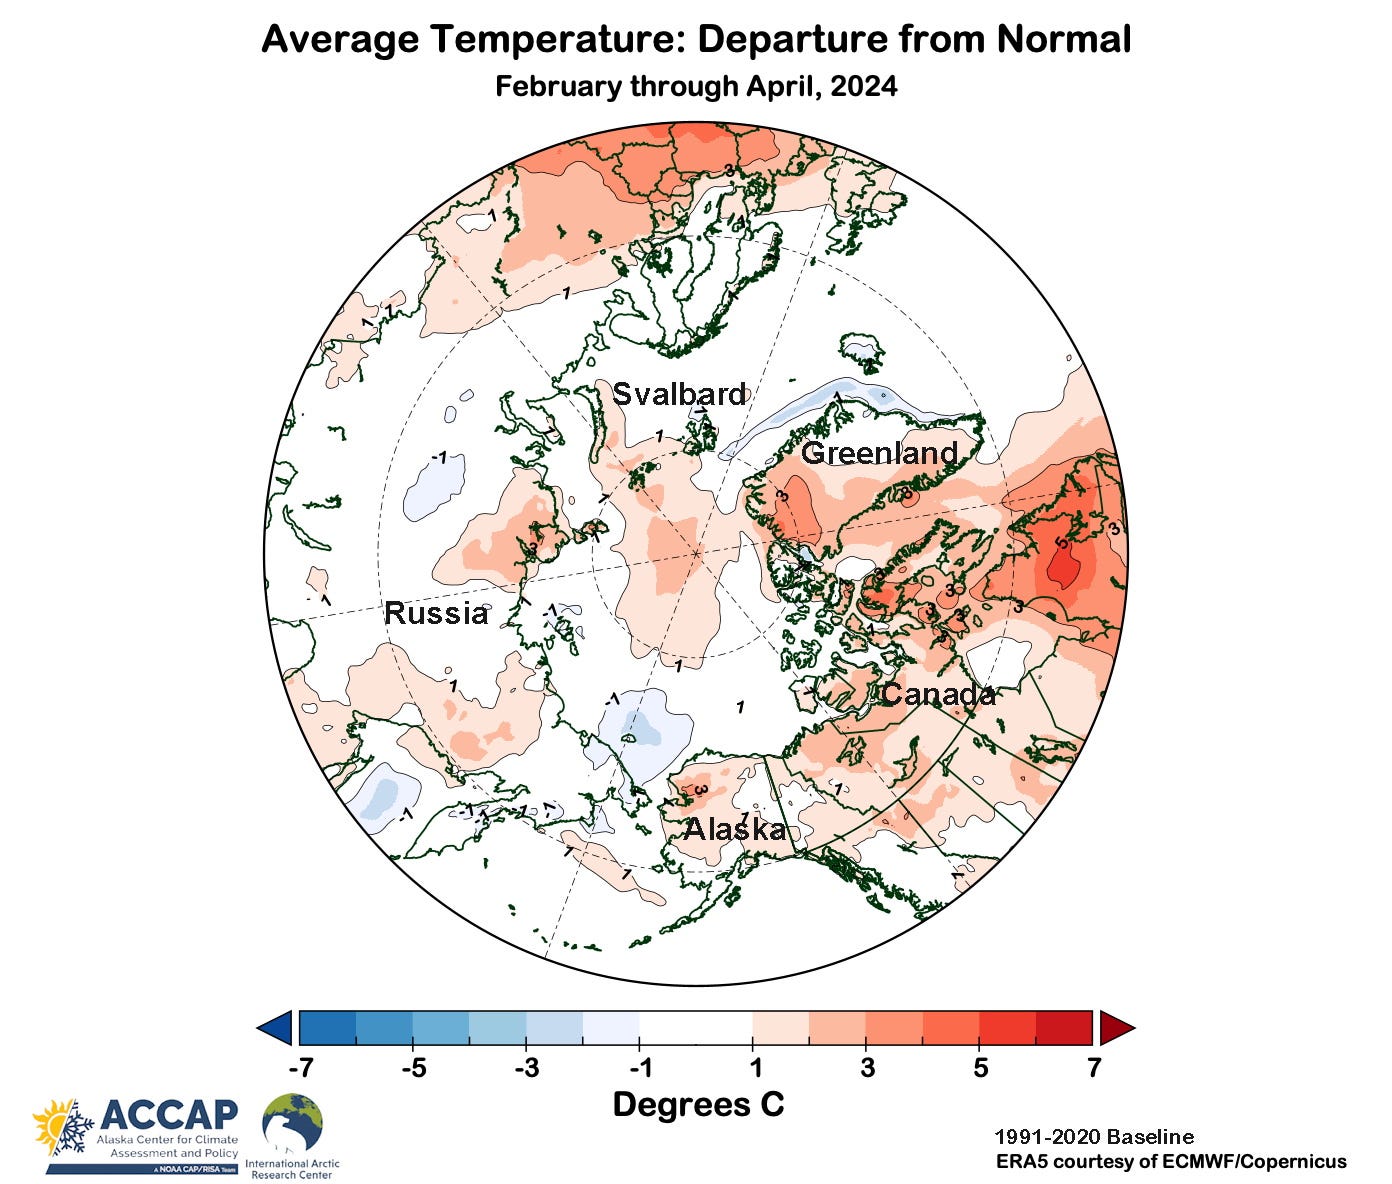
Every month I produce and post graphics like Fig. 1, which shows the early spring (February through April) 2024 average temperature departure from normal for the Arctic. And per good science and science communications practice, I specify what baseline is used to compute the “normal”, which is typically, the mean (as here), though for some elements the median is preferred. For most climate monitoring purposes I use the 1991-2020 baseline, which is the current United States and international standard.
30-Year Climate Normals
A 30-year baseline for calculating climate normals has been in use since the 1930s and from the start was acknowledged as a compromise of many competing factors, including the need to allow locations to be added, the relative easy of computing (in the days/places of long hand arithmetic) and statistical representativeness (in what was assumed to be a largely unchanging long-term climate).
The US and some other countries have long updated the 30-year normals once per decade, with the 30 year baseline ending in a year that ends in “0”. Until very recently, the World Meteorological Organization (WMO) standard was for 30-year climate normals to be updated once every non-overlapping 30-years, e.g. 1901-1930, 1931-1960, 1961-1991 and now 1991-2020, with a once-a-decade update optional. However, in recognition of the global changing climate, the WMO has made the once-a-decade update the standard.
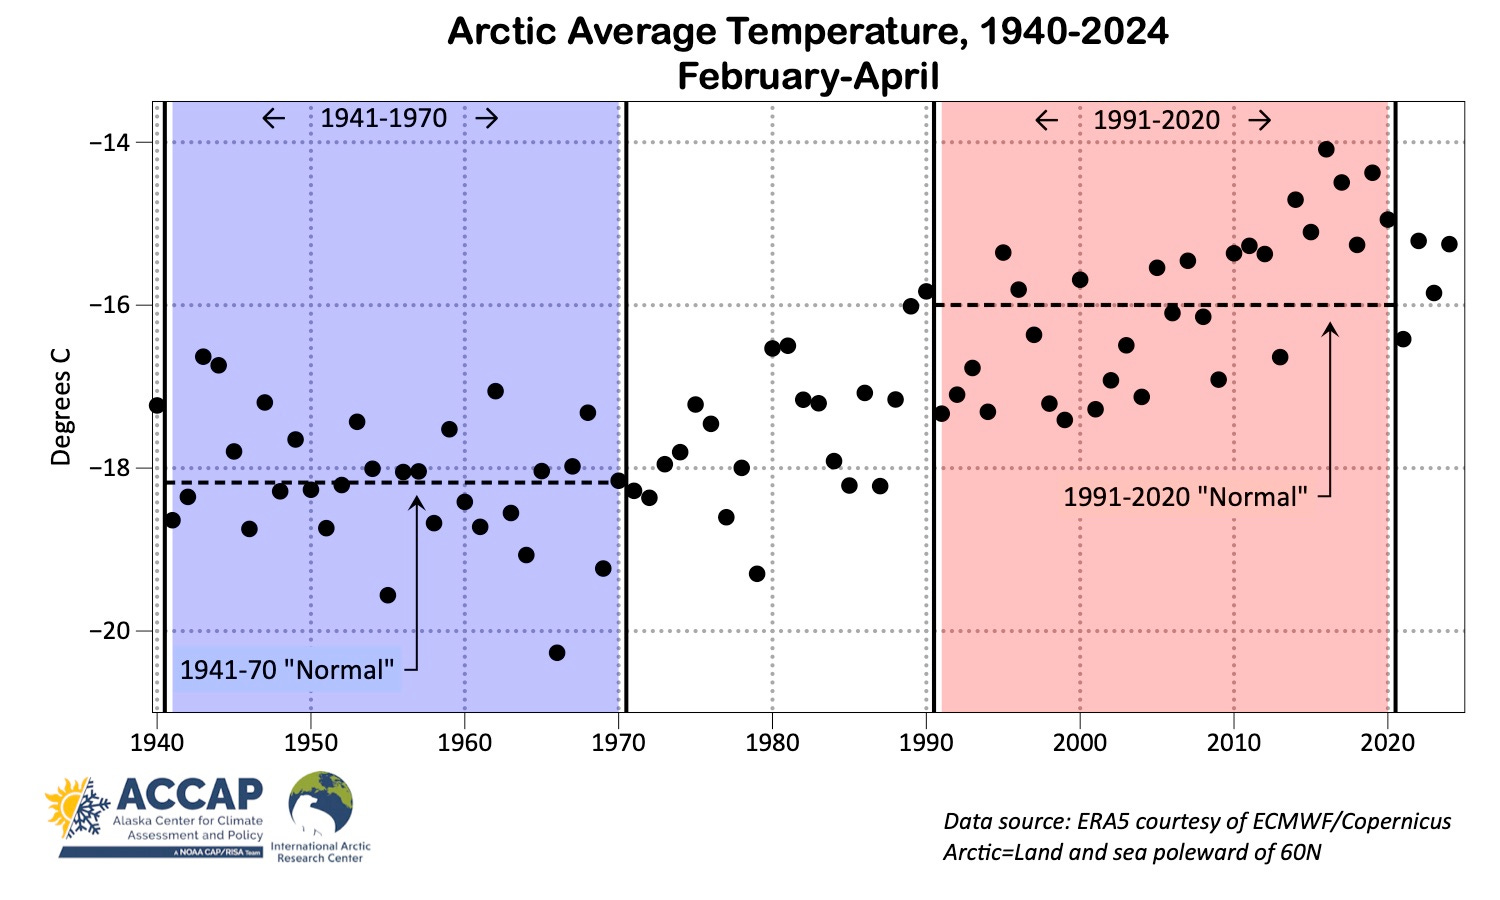
Figure 2 illustrates how this works using the early spring average temperature for the Arctic as a whole from the ERA5 data. Here I’ve highlighted the earliest 30-year normals period in this dataset (1941-70) and the most recent (1991-2020). Once a decade the oldest ten years are removed and the newest ten years added. Each successive baseline have 20 years in common, so changes reflect only the difference in the more recent decade vs. 30 years before. For example, the Arctic 1981-2010 February-April average temperature was -16.67°C, while the 1991-2020 average (-16.00°C). Since both baselines include the years 1991-2010, this increase reflects the difference in average in the 2010s (-15.54°C) compared to the 1980s (-17.27°C).
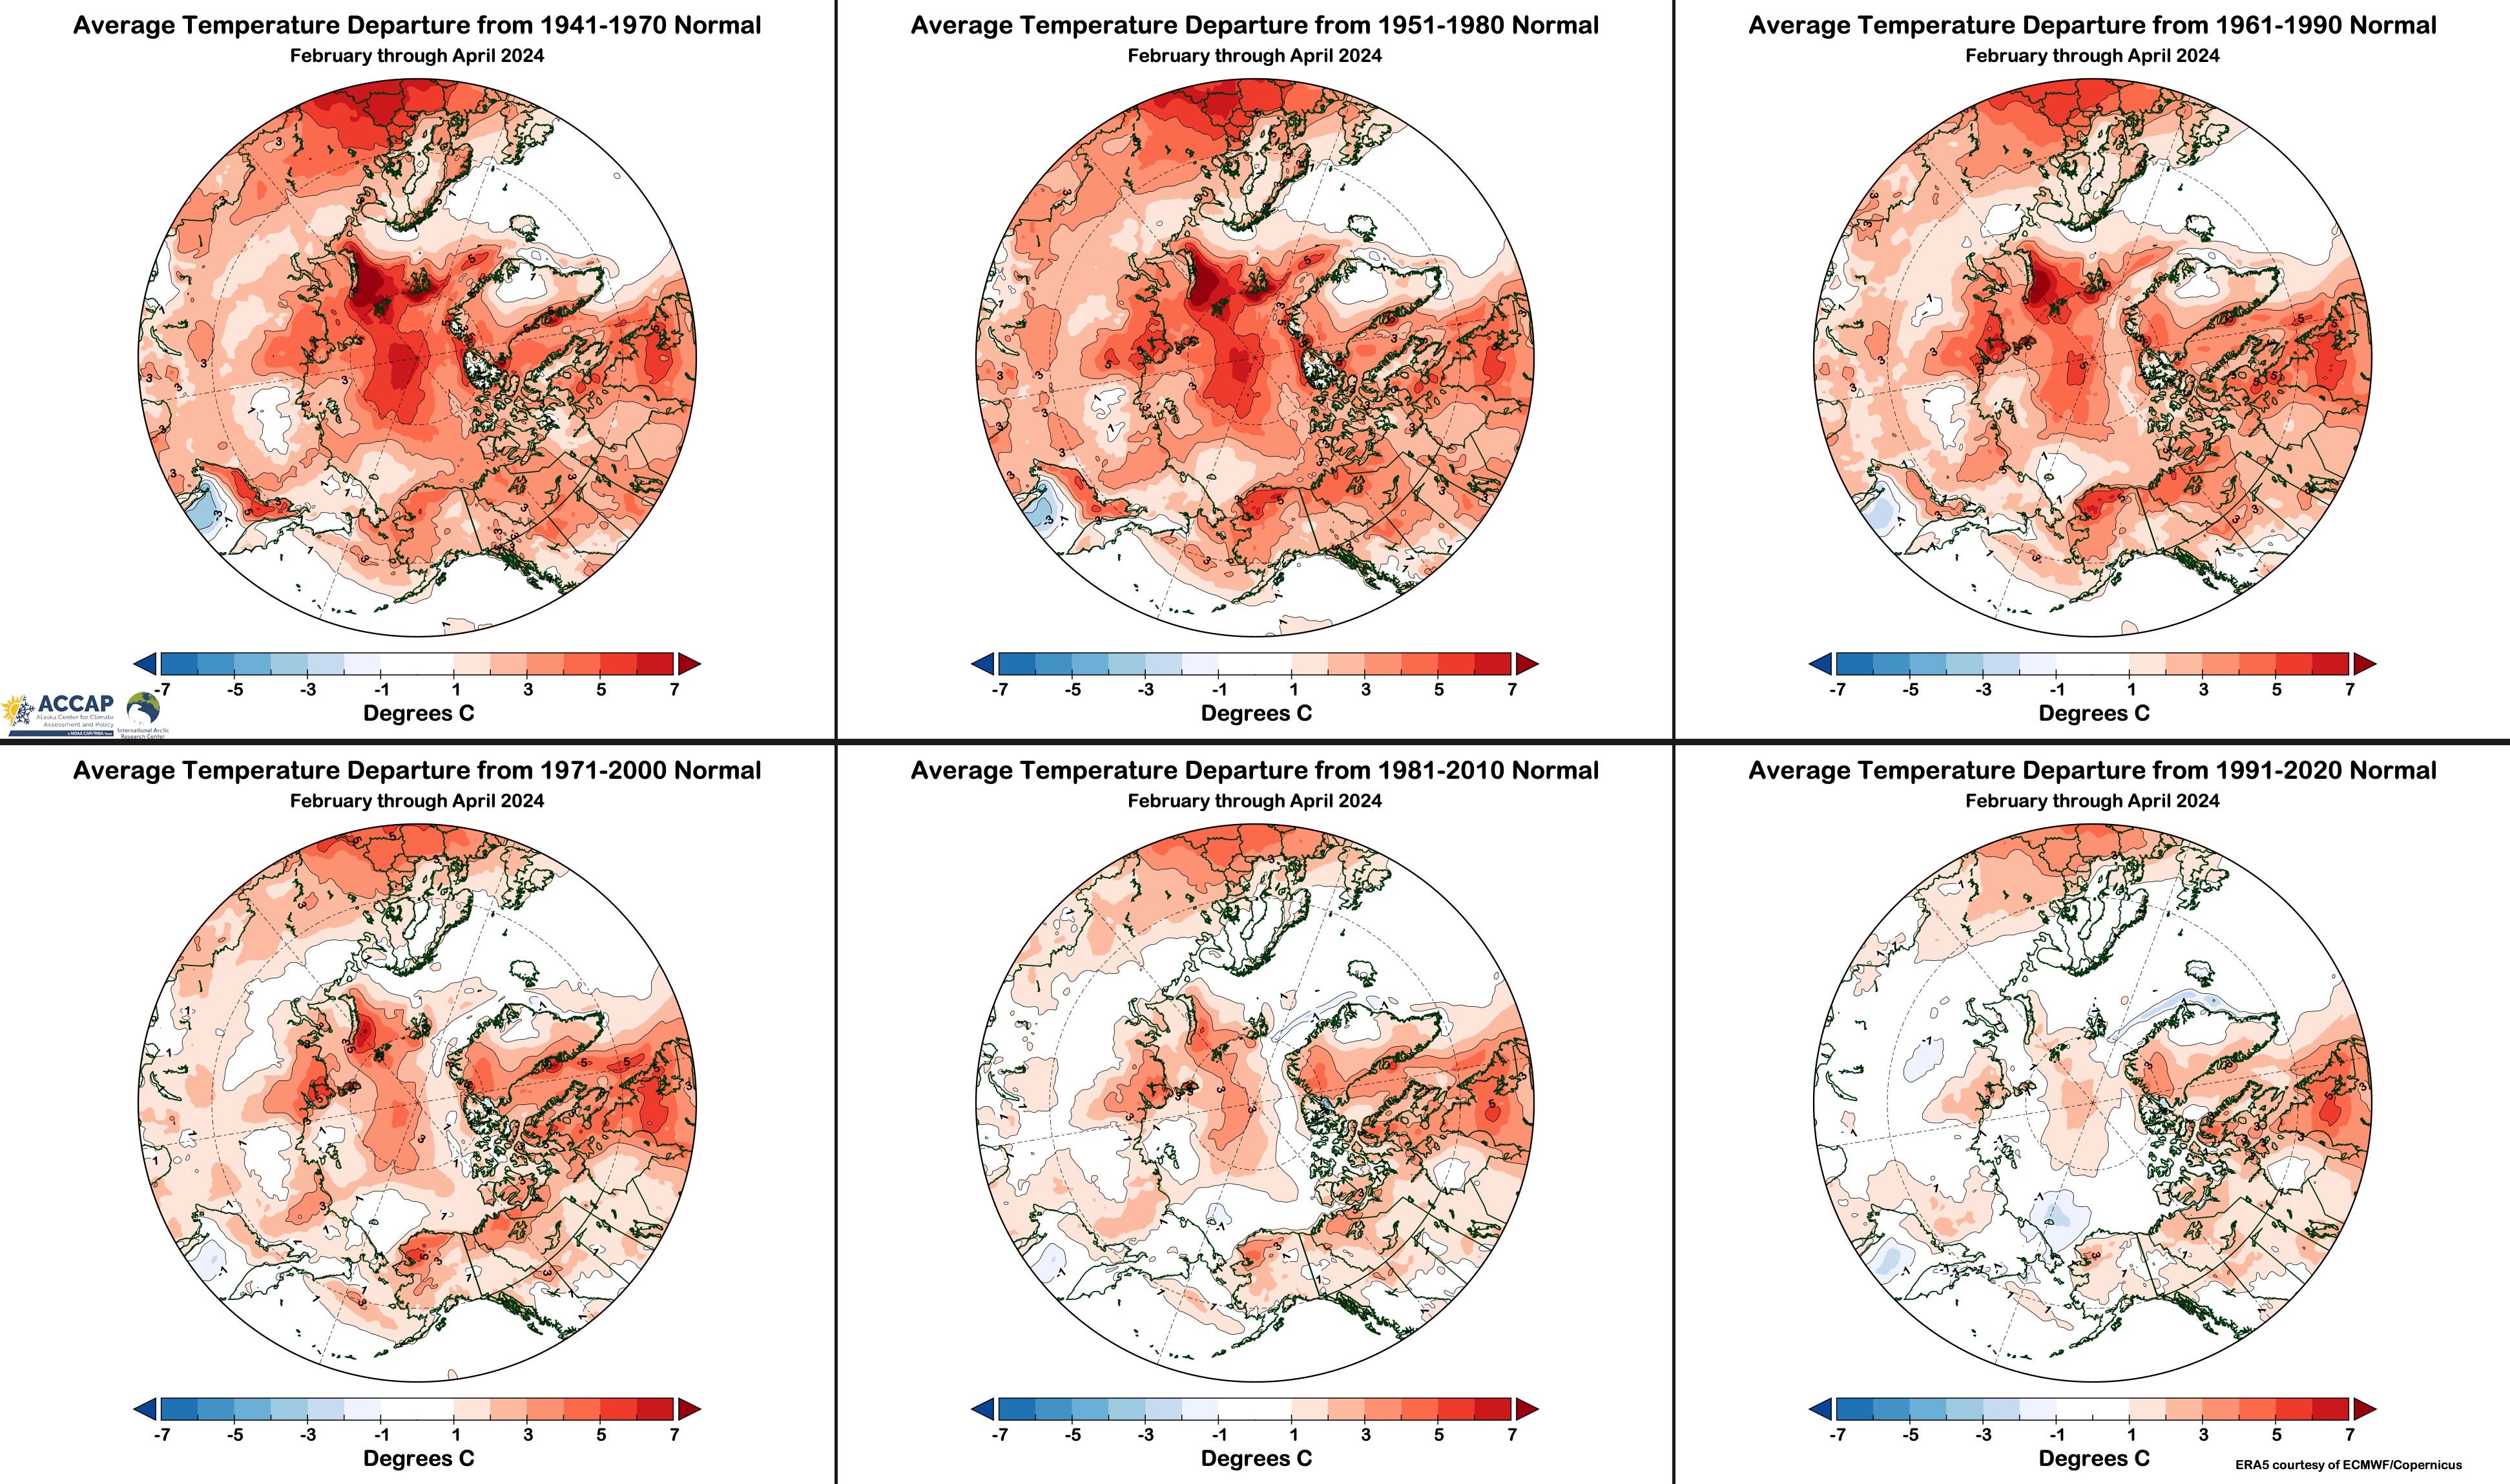
The spatial importance of the baseline is shown in Fig 3. This mosaic shows February-April 2024 data (same as in Fig. 1) but with departures calculated using each of six (overlapping) 30-year baseline periods since 1941-70. While there are small differences in the top row (1941-70 through 1961-90 baselines), the differences using the more recent baselines (bottom row) are far more dramatic, and it’s only using the 1991-2020 baseline that there is any significant area in the Arctic more than 1°C below “normal”.
It’s important to emphasize that none of these are “right” or “wrong”. Rather, the most appropriate depends on your interest and needs. If you want to know how February-April 2024 average temperatures compared to recent years, 1991-2020 is the baseline of choice. If you’re interested in longer term change, then an older baseline would be more appropriate: 1951-1980 is widely used, though the WMO uses 1961-1990.
Is Updating Once a Decade Enough?
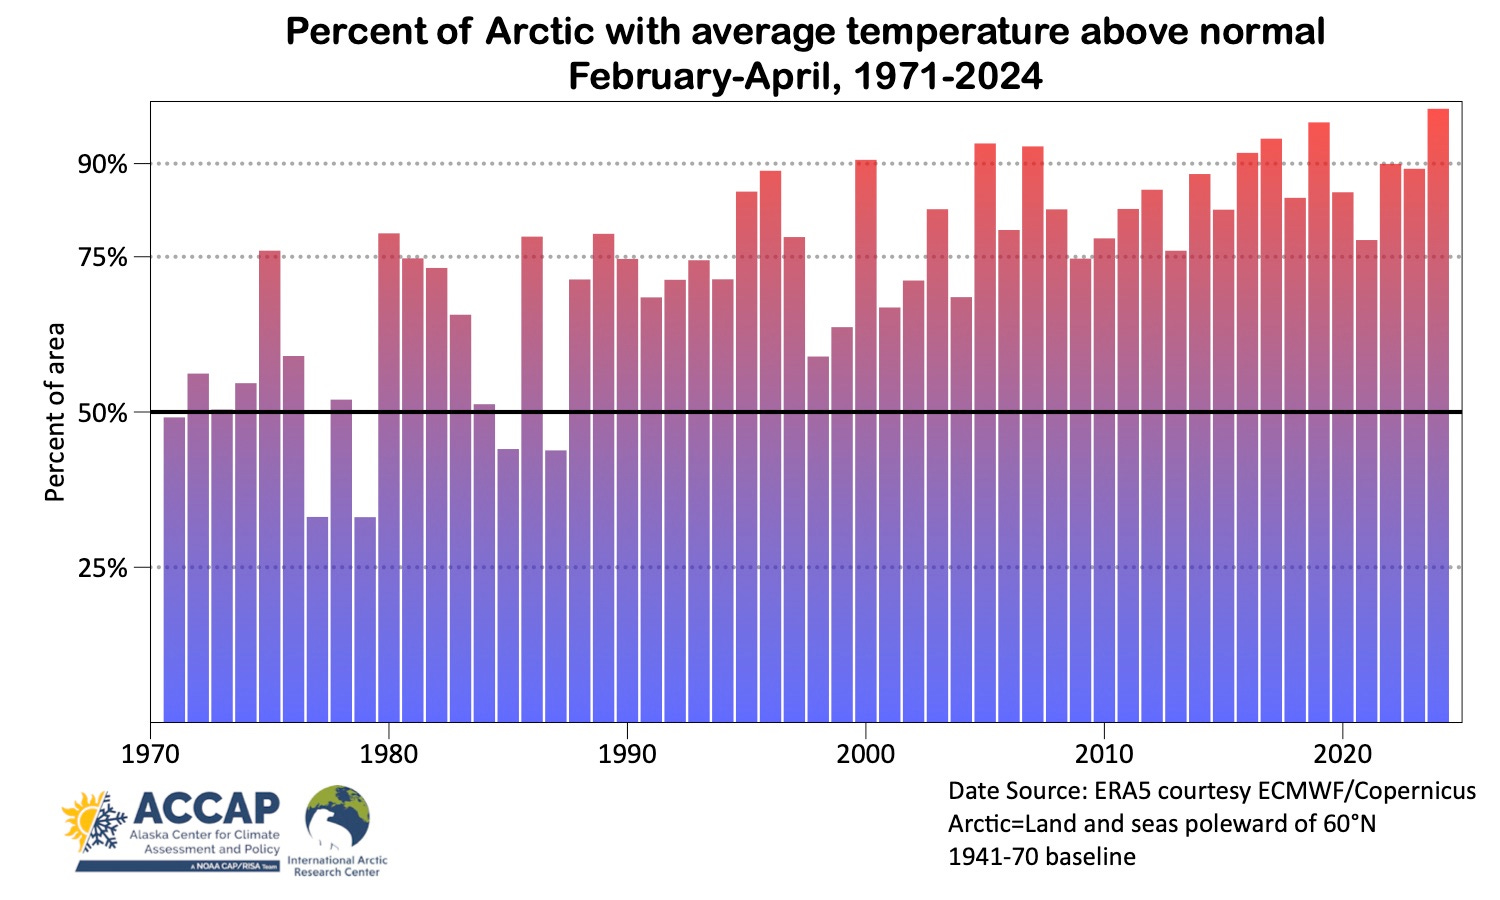
Part of the impetus for updated baseline every ten years is to keep up with the changing climate. The Arctic though is warming so fast that this once-a-decade update is not sufficient to keep up the pace of change. Figure 4 shows the percent of the Arctic area with the February-April average temperature above the contemporary 30-year baseline.
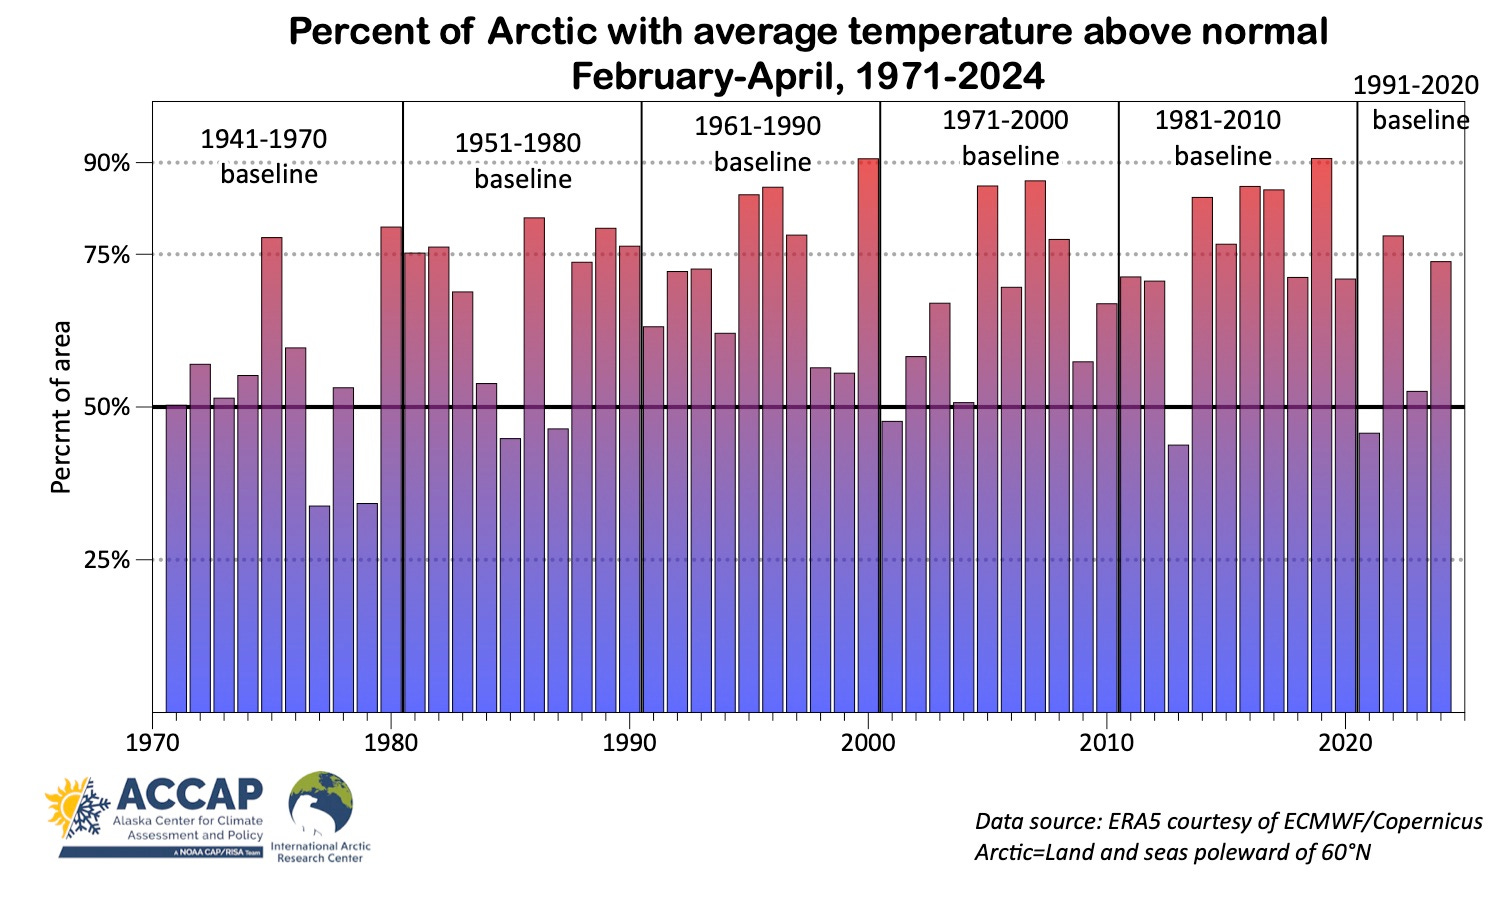
In a stationary climate, or even one that was only slowly changing, the percentage of an area as large as the Arctic with above (or below) normal temperatures in any given season should be centered on 50 percent with some year-to-year variability. That’s not what we see in Fig. 4: the 54-year median for February-April average temperature is 71% of the Arctic is warmer than the contemporary average, and only three early springs since the late 1980s had less than 50 percent of the Arctic warmer than “normal”. This problem is well known, especially in efforts to use climate “normals” as a forecast tool, with the usual approaches to use an even shorter baseline (sometimes called “Optimum Climate Normals) or some flavor of regression. But that’s a topic for another post.
Addendum on May 28: By request, here’s the same data as in Fig. 4 except using the same normals baseline (1941-70 in this case) through time. Thanks to B. Brettschneider for help with the code to quickly generate this.
Thank you, Rick!
Years ago I asked this question about “normals.” Thank you for this article. I know it would really just be playing, but it would be interesting to see the last figure using only the earliest baseline. It might make the changes we are seeing look even more dramatic. Like I said, just playing around, but maybe interesting.