


The Alaska and Arctic Dry Season
When it's Springtime in Alaska…

A under appreciated but significant feature of Alaska and Arctic climate is that many regions have pronounced dry and wet seasons, and with days rapidly lengthening we are headed into the dry season. At the largest scale this is not too surprising: sea ice is at its maximum extent in Spring and so there is less ocean water surface exposed to supply “local” moisture through evaporation. Figure 1 shows the 1991-2020 average percent of annual precipitation that falls March through May. If precipitation amounts were equally distributed over the year, then each 3-month season would have about 25 percent of the total. Poleward of 60°N, most areas from central Siberia eastward across North America to western Greenland fall well short of that level, and there are large areas where spring typically bringing less than 15 percent of the annual total. While this “dry spring” is less widespread on the Atlantic side of the Arctic it still appears in interior Scandinavia.

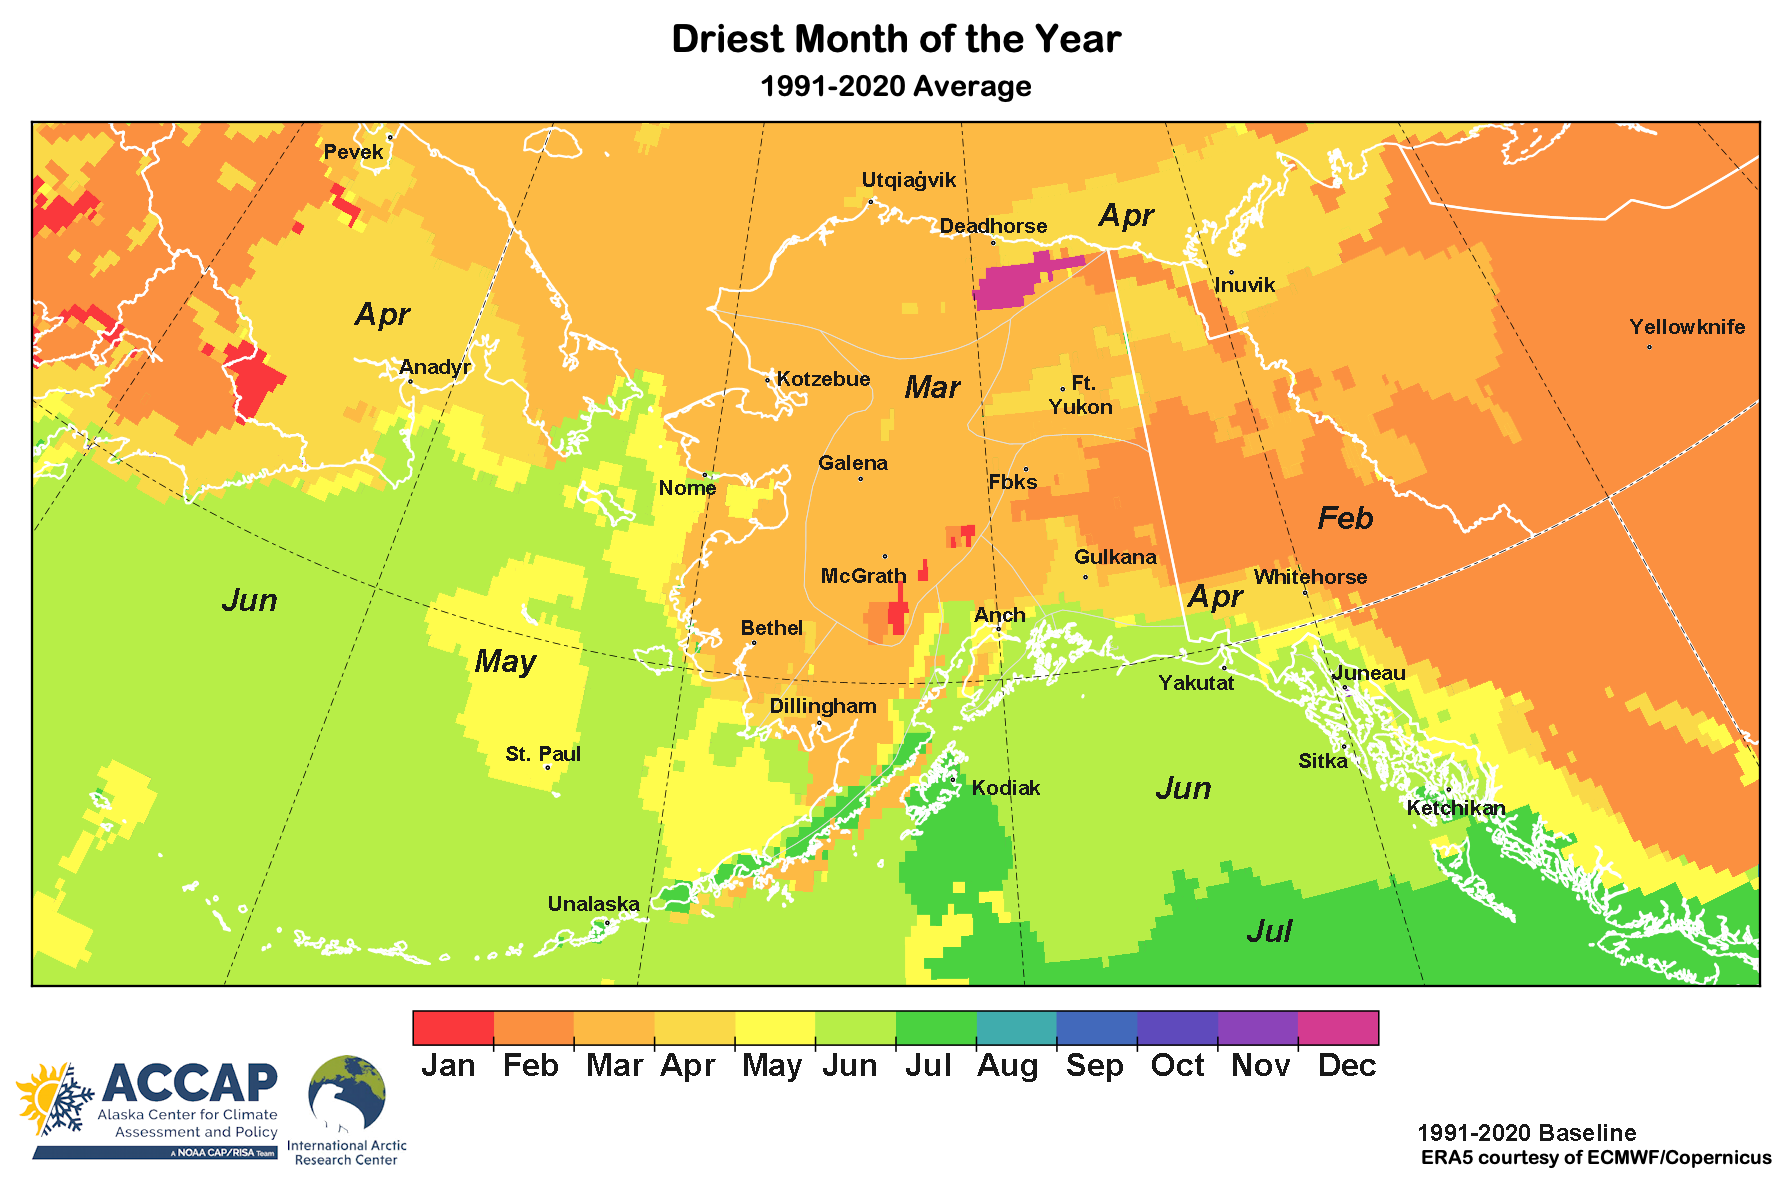
Given these low percentages, it’s not surprising that the driest month of the year occurs in the spring over many land areas. Zooming into Alaska and vicinity, we see in Fig. 2 that either March or April has the lowest average precipitation of any month of the year over a large portion of the region from the Russian Far East eastward into mainland (in some areas there’s hardly any difference), although February is the driest month over parts of southeasten Interior Alaska eastward across the Yukon and Northwest Territories. Over the Bering Sea and Gulf of Alaska the driest month (on average) is later, usually either May or June.
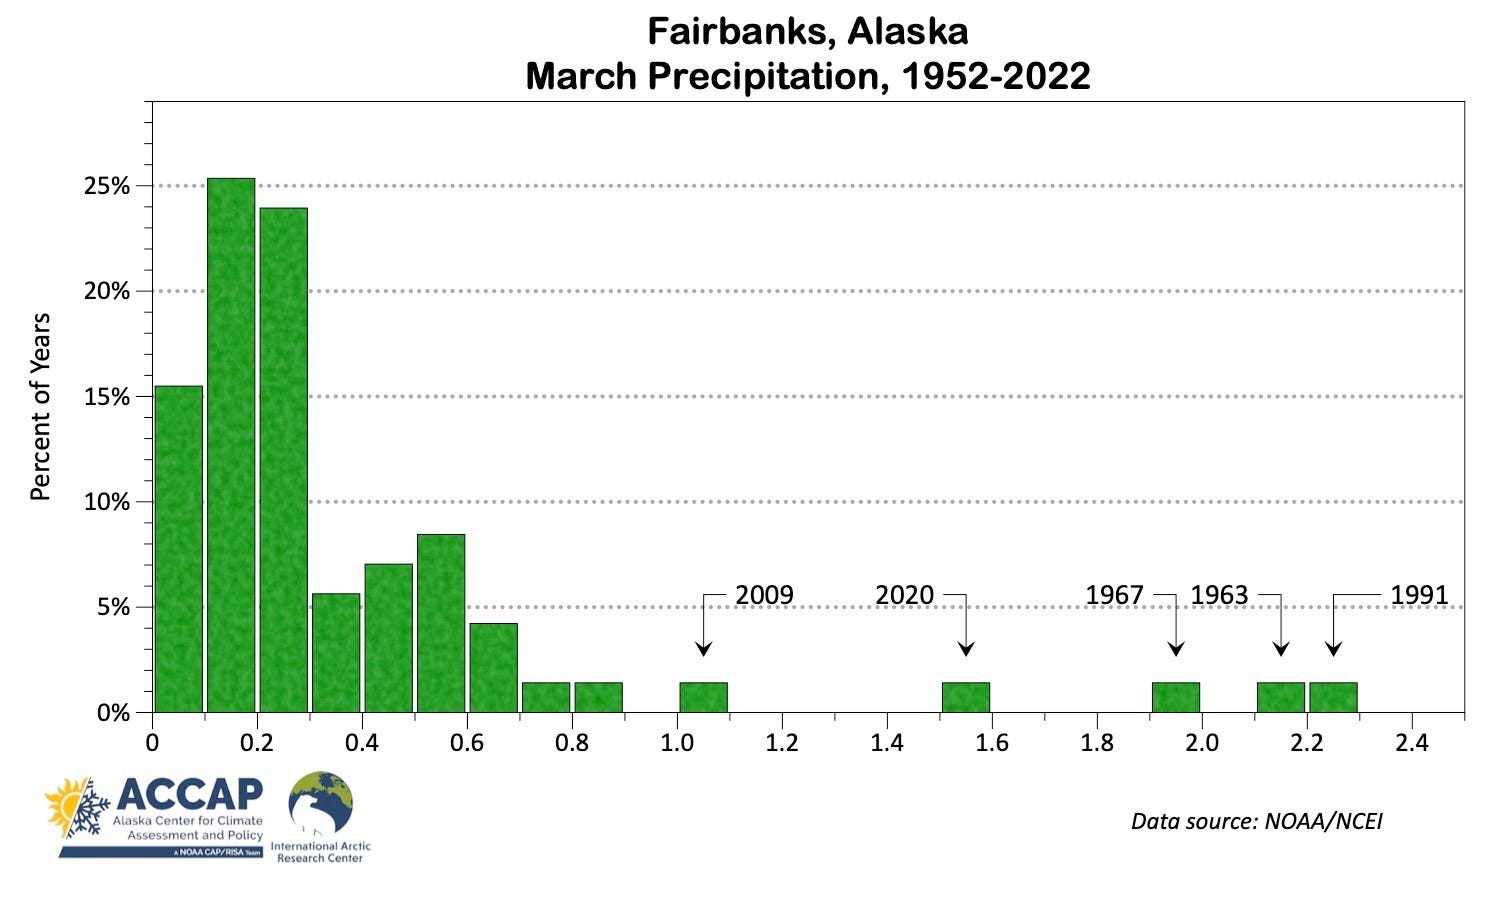
Hidden in the multi-decade averages is the year-to-year variability. Dry months or seasons in Alaska and the Arctic, like other parts of the world outside the tropics that have well defined dry seasons, e.g. western California Oregon, parts of southern European, central Chile and southwest Australia, tend to have many months/seasons with very low precipitation but with infrequent high precipitation occurrences. When we line up many years this leads to monthly/seasonal variability that does not look anything like a “bell” curve, and is illustrated in Fig 3. This histogram of the March Fairbanks, Alaska precipitation for the 71 years 1952 to 2022 shows that almost half the time March total precipitation has been between 0.1 and 0.3 inches and rarely exceed half an inch. However, there a handful of years that have had more than one inch. This produces a spread of values that is often modeled by a gamma distribution, which is well suited to distributions that are limited by zero (like precipitation) and have a “long right tail”.
Now this is of some practical relevance. Because the typical precipitation totals are not very much above zero, it’s not generally meaningful to talk about drought conditions developing during the spring for much of Alaska and northwest Canada. On the other hand, if snowpack is unusually thin at the end of February, chances are low that spring snowfall will improve that situation very much. Also, by convention at least in the US, standard climate normals are calculated as the average (mean) of the baseline period, but in situations like this the mean is strongly influenced by one or two outliers (this is also an issue with shoulder season snowfall). A non-Arctic example would be July rainfall at San Diego, CA. The NOAA 1991-2020 normal precipitation is 0.08 inches. However, only four times in the 30 years has rainfall been above 0.08 inches. This is because a couple of Julys with significant rain strongly skew the average. The median (half the years more, half less) San Diego rainfall in July is a trace. For parts of central and eastern Interior Alaska in March and April it’s not quite that extreme, but the normal (mean) precipitation is 50 to 75 percent higher than the median.
Is it a safe corollary that Alaskan springs are sunny? It would certainly boost shoulder season PV potential.