Spring 2023 Arctic Climate Summary
High Regional Variability

Spring at the high latitudes is highlighted by the return of the sun and, except at the northernmost latitudes, the start (and possibly finish) of the melt season. As usual, I use the term “Arctic” to refer to areas (land and sea) poleward of 60N and throughout “normals” or “average” based on the 1991-2020 baseline.
Temperatures
Spring 2023 average temperature for the Arctic as a whole was 0.3°C above average in the ERA5 reanalysis. This was a slightly below the average temperature last spring and slightly above Spring 2021. Figure 1 shows the regional variability. Much of Arctic Canada except for the Yukon Territory was exceptionally mild. Similar departures occurred in southwestern-most Siberia. Much of mainland and northeastern-most Russia were significantly cooler than average, as was an area from the Taymyr Peninsula, Russia northwestward to north of Svalbard and then south along the east coast of Greenland.

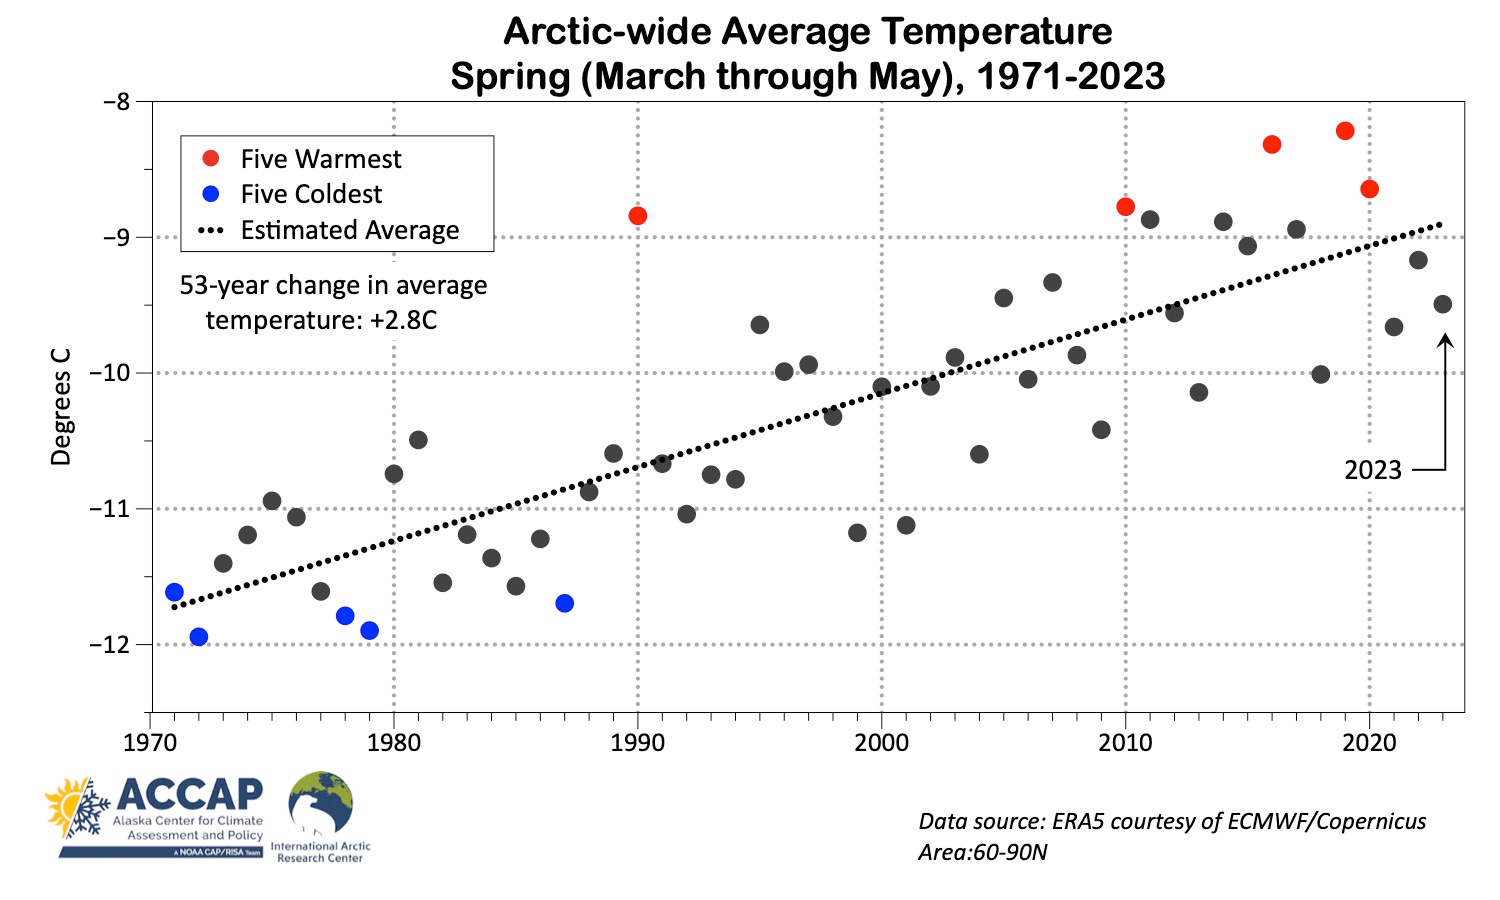
Spring temperatures are trending rapidly upward in the Arctic, as seen in Fig. 2. This spring was almost 1°C below the 1971-2023 trend line, but prior to 2005, only one year (1990) had a higher spring average temperature. This is a clear example of changing climate; what used to be unusually mild is now cooler than expected.
Precipitation
Spring is the driest season of the year across a large swath of the North. Figure 3 shows the March through May total precipitation as a percentage of the average annual total. Spring is (typically) especially dry from central Siberia eastward through Alaska and into northwest Canada, but dry areas are also found in Scandinavia. Note too that there are hardly any areas where Spring precipitation typically makes up 25 percent of the annual total: if precipitation were evenly distributed throughout the year then each season would have 25 percent of the annual total.

With that background, the percent of average total precipitation that fell in Spring 2023 is shown in Fig. 4. Overall the Spring precipitation was 103 percent of average, with most of northcentral Canadian Arctic and southwest Siberia drier than average (same basic regions that were much warmer than normal). Areas that were significantly wetter than average include much of Alaska, the Canadian Arctic Islands and the Svalbard area.

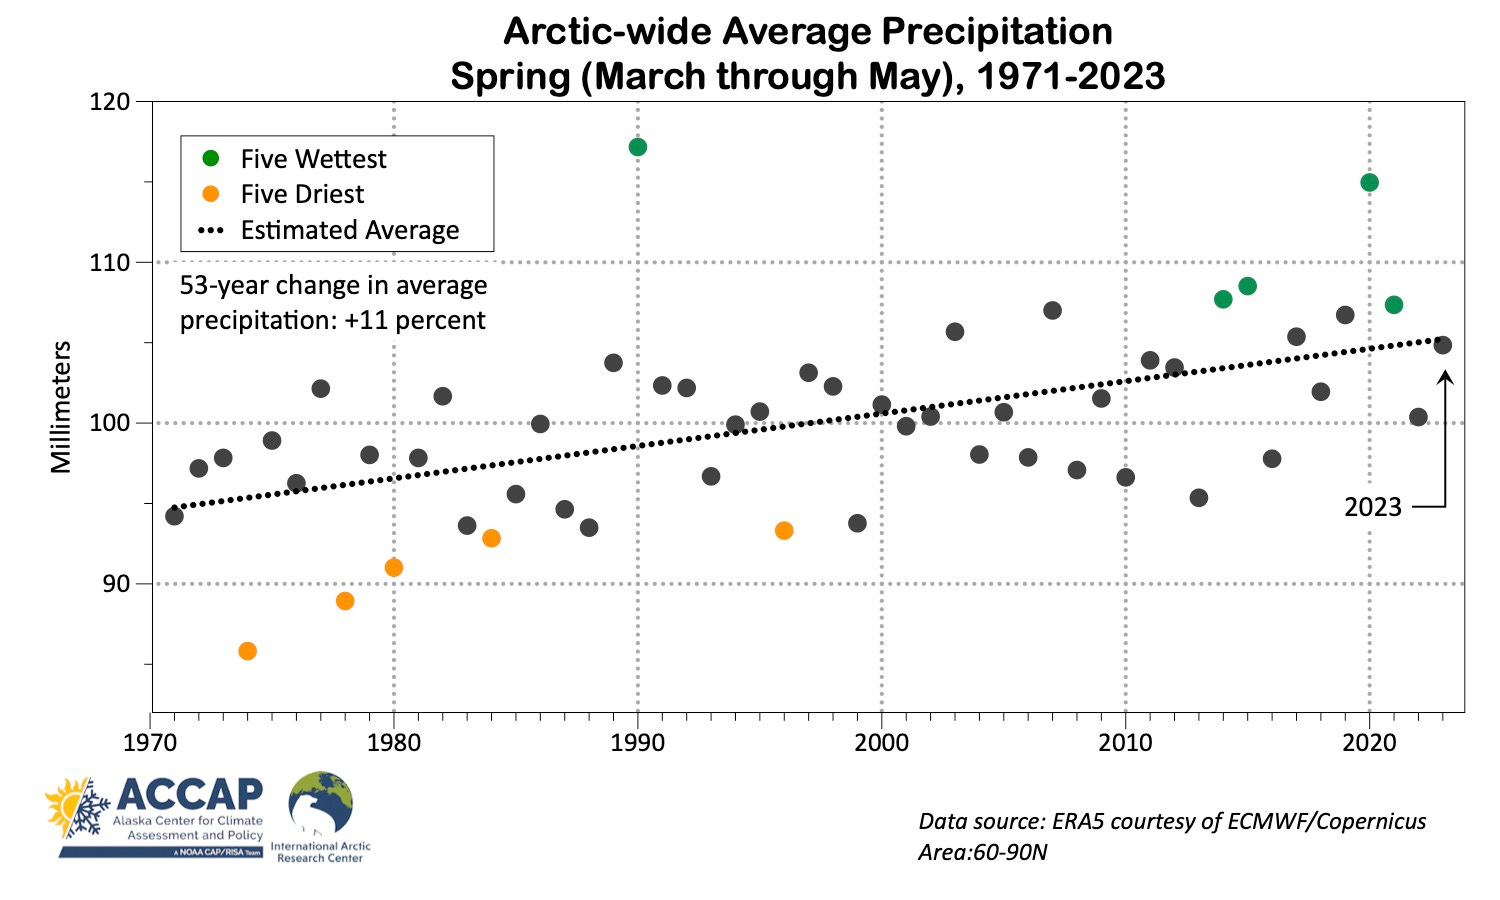
At least for me, the absolute value or difference from average of the seasonal precipitation at this scale, ~34 million km², is much less meaningful than the multi-decade trend. Figure 5 plots the average precipitation each spring since 1971. Like temperatures, there’s a clear increasing trend, which is exactly what we expect in a warming environment.
Ice and Snow
Northern Hemisphere sea ice reached the maximum extent for the 2022-23 on March 6th in National Snow and Ice Data analysis, but only slowly decreased until early May when the rate of melt increased. Spring extent this year was close to 2022 but mostly lower than 2021.

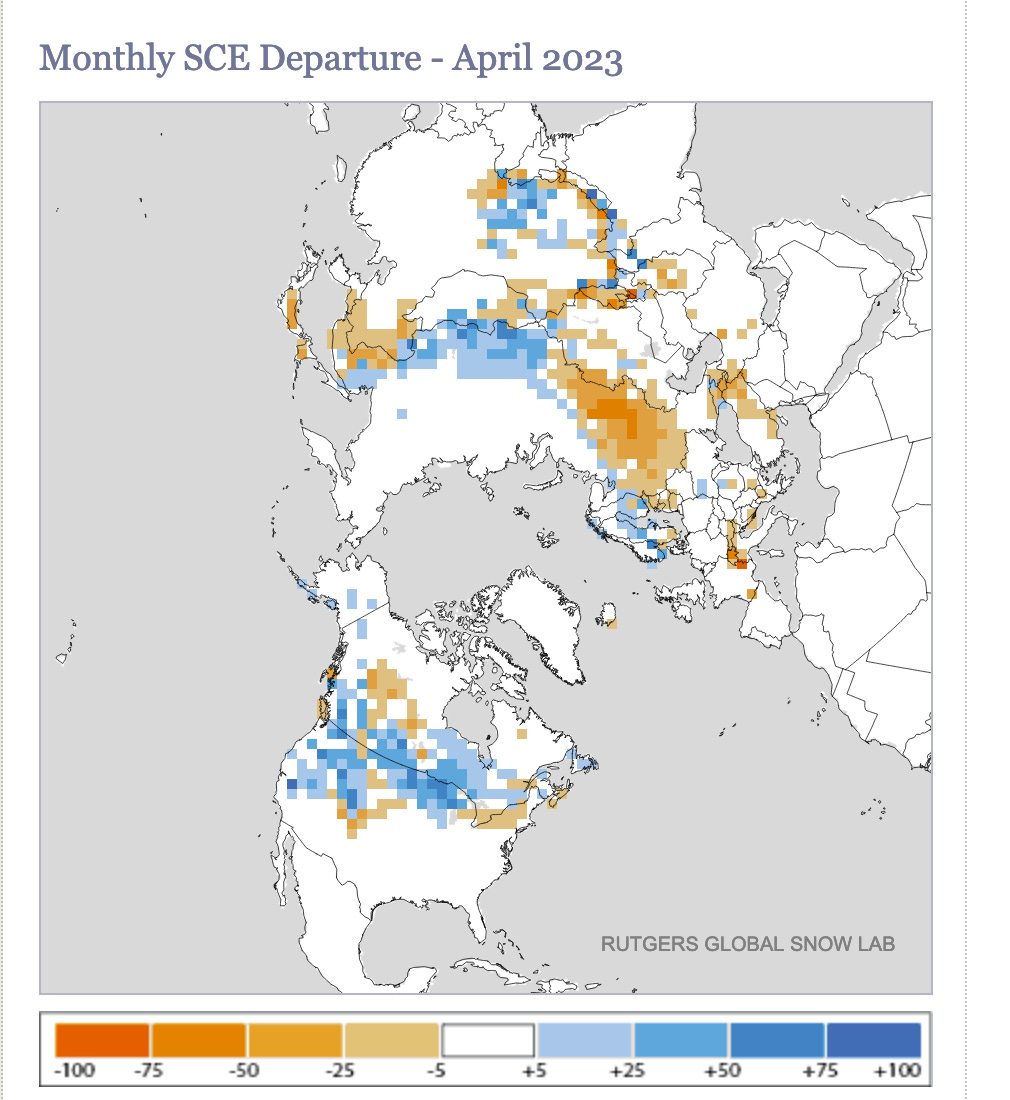
Snow cover (just the presence or absence of snow, regardless of the amount) typically remains through the Spring in much of the Arctic north of 70N and in areas further south with cold sea ice influence (e.g. the Bering Strait region). On the continents though, the winter snowpack is often lost in April or May. Figure 7 shows the April snow cover extent departure from the 1981-2010 baseline from the Rutgers Global Snow Laboratory. In and near the Arctic, the most notable departure is the below normal area in northcentral Canada and in southwest Siberia.