


September 2024 Alaska Climate Summary
Not as extreme as the late summer

This is the Alaska climate summary for September 2024. The Arctic-wide summary for September is here.
****Site-specific temperature and precipitation data for September has been impacted by the devastation from Hurricane Helene in western North Carolina: NOAA’s National Centers for Environmental Information is located in Asheville, NC. This is in addition to the usual vagaries of missing and/or poor quality automated station data. So if the station-based graphics look a bit sparse this month, that’s why.***
Temperature
Temperatures averaged above normal over most of Alaska, but especially across the North Slope and Brooks Range (Fig 1a). The main area with below normal temperatures was over western Alaska. Overall, in ERA5 reanalysis, 84 percent of Alaska land area was warmer than the 1991-2020 average, a dramatic change from August, when 69 percent of the state was cooler than average.

Site specific September average temperature departures from normal are shown in Fig. 1b. Utqiaġvik Airport reported a September average temperature of 38.7F (+3.7C), 5.0F (2.8C) above the 1991-2020 baseline normal. That is the second highest September average temperature in 104 years of climate observations, exceeded only in 2019. September temperature extremes ranged from 72F (22.2C) at several reporting sites in the Fairbanks area on the 5th to 11F (-11.7C) at Chicken (eastern Interior, Fortymile country) on the 30th.
Precipitation
The September precipitation pattern from ERA5 (Fig. 2a) was very different from July and August, when much of mainland Alaska saw well above normal totals. Much of western Alaska had below normal totals, which coming after the soaking rains of late summer rains gave the ground a chance to dry out a bit before winter freeze. Areas in the southeast Interior that had well above normal precipitation in September largely coincided with areas that had below normal rainfall in late summer.

The site-specific percent of normal precipitation for September is shown in Fig. 2b. There were no near record totals, though Bettles reported the lowest September precipitation since 2010, while the Whitestone Farms cooperative station east of Delta Junction reported the highest September total since 2007. The highest September total reported in Alaska was 29.38 inches (746mm) at the Snettisham Power Plant cooperative site southeast of Juneau. That sounds like a lot of rain, and it is, but it is only about 2 inches (50mm) above normal.

Snowfall
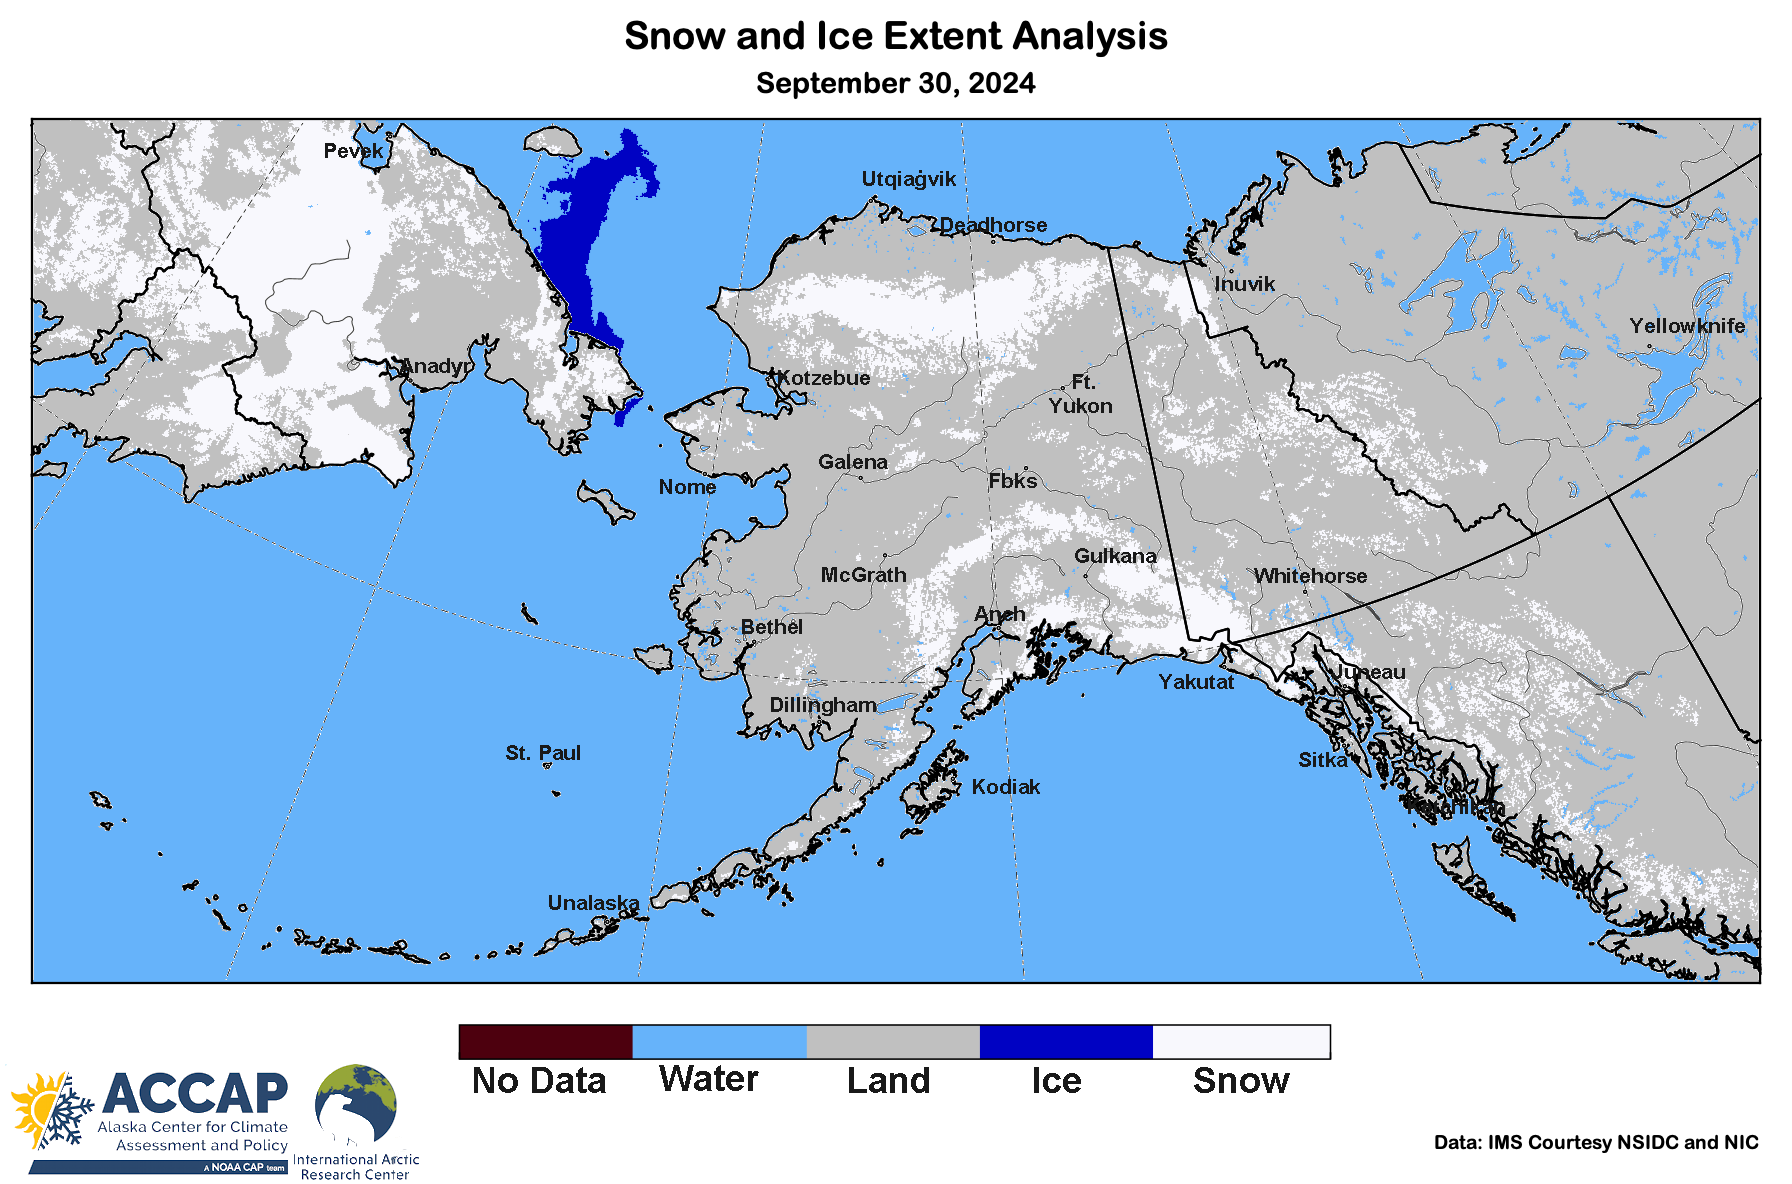
Accumulating snow was mostly limited to mountain areas and the North Slope in September, and that is reflected in the National Ice Center’s Interactive Multisensor Snow and Ice Mapping System (IMS) analysis for September 30, shown in Fig. 3. The UAF Toolik Lake Research Station, on the north side of the Brooks Range at 2500 feet (760 m) MSL reports daily precipitation and snowfall through the CoCoRaHS network, and in September reported 9.8 inches (24.9cm) of snow, most of which fell September 21-22. There were small, short-lived accumulations at moderate elevations elsewhere over mainland, including above 1500 feet (460m) MSL in the hills north of Fairbanks and above 2000 feet (610m) MSL on the Anchorage and Eagle River hillsides. Reminder: in mainland Alaska there are hardly any daily snowfall observations at places not on the connected road system.
Sea surface temperatures
High resolution sea surface temperature data availability has also been impacted by the flooding in North Carolina, as this data is routed through NCEI. Figure 4 shows the SST departure from the 1991-2020 baseline for the first 25 days of September. Much of the eastern Gulf of Alaska was slightly warmer than normal, as was the near-shore Beaufort Sea. However, the Chukchi and the eastern Bering Sea remain cooler than normal, though the departures were generally less than in August.
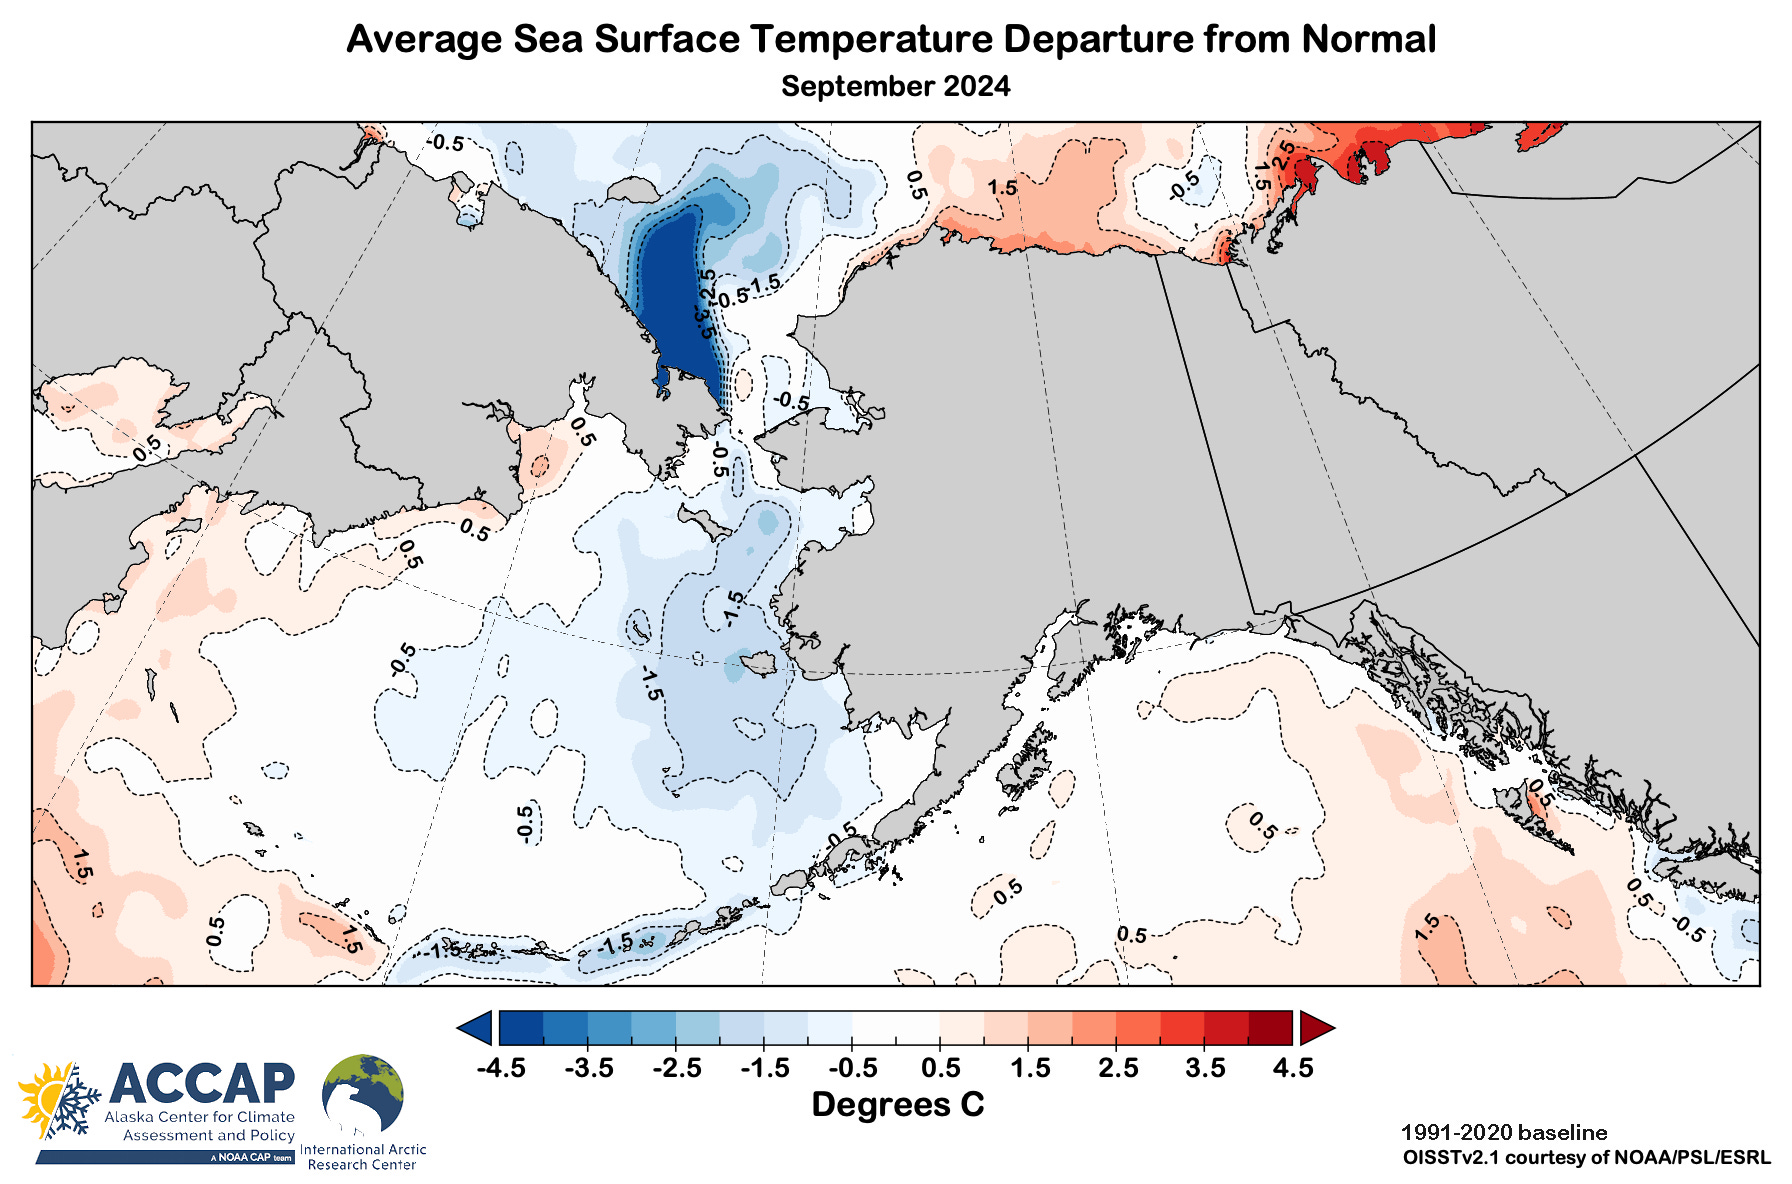
A mixed bag as would be expected. A jumbled year in many ways. No trend lines evident to me except ongoing support for sea surface temp rise (excepting the anomalous situation this year in the Chukchi sea.)