Seasonal sea ice extremes
No Virginia, they are not correlated

The maximum Arctic-wide sea ice extent of 2025 was reached on March 22 in National Snow and Ice Data Center data, and at 14.33 million km² (5.53 million miles²) was the lowest maximum in the 47 years of (near) daily satellite observations. This was reported in the media, NISDC’s Sea Ice today reported on it here and I posted about here. I mentioned that this does not mean much as to whether the September ice extent will be unusually low since the Arctic sea ice maximum and minimum involve ice extent in different parts of the Arctic system. However, not everyone got the message, and some media reports suggested that this was a potential indicator of upcoming record summer ice extent. However, the parts of the Arctic where ice was less extensive than usual this spring (Bering Sea, Sea of Okhotsk, Barents Sea) will be at or nearly ice free come September. The September minimum will be determined by what happens in parts of the Arctic that have near complete ice cover in the spring.
Arctic Ice Extent Trends
Arctic sea ice extent has a strong multi-decade trend. Figure 1 plots the annual maximum and minimum sea ice extent 1979 through 2024 (note the break in the vertical axis) along with the simple linear regression. In this time series content, the linear regression represents an estimate of the (time varying) average of the maximum and minimum extent.
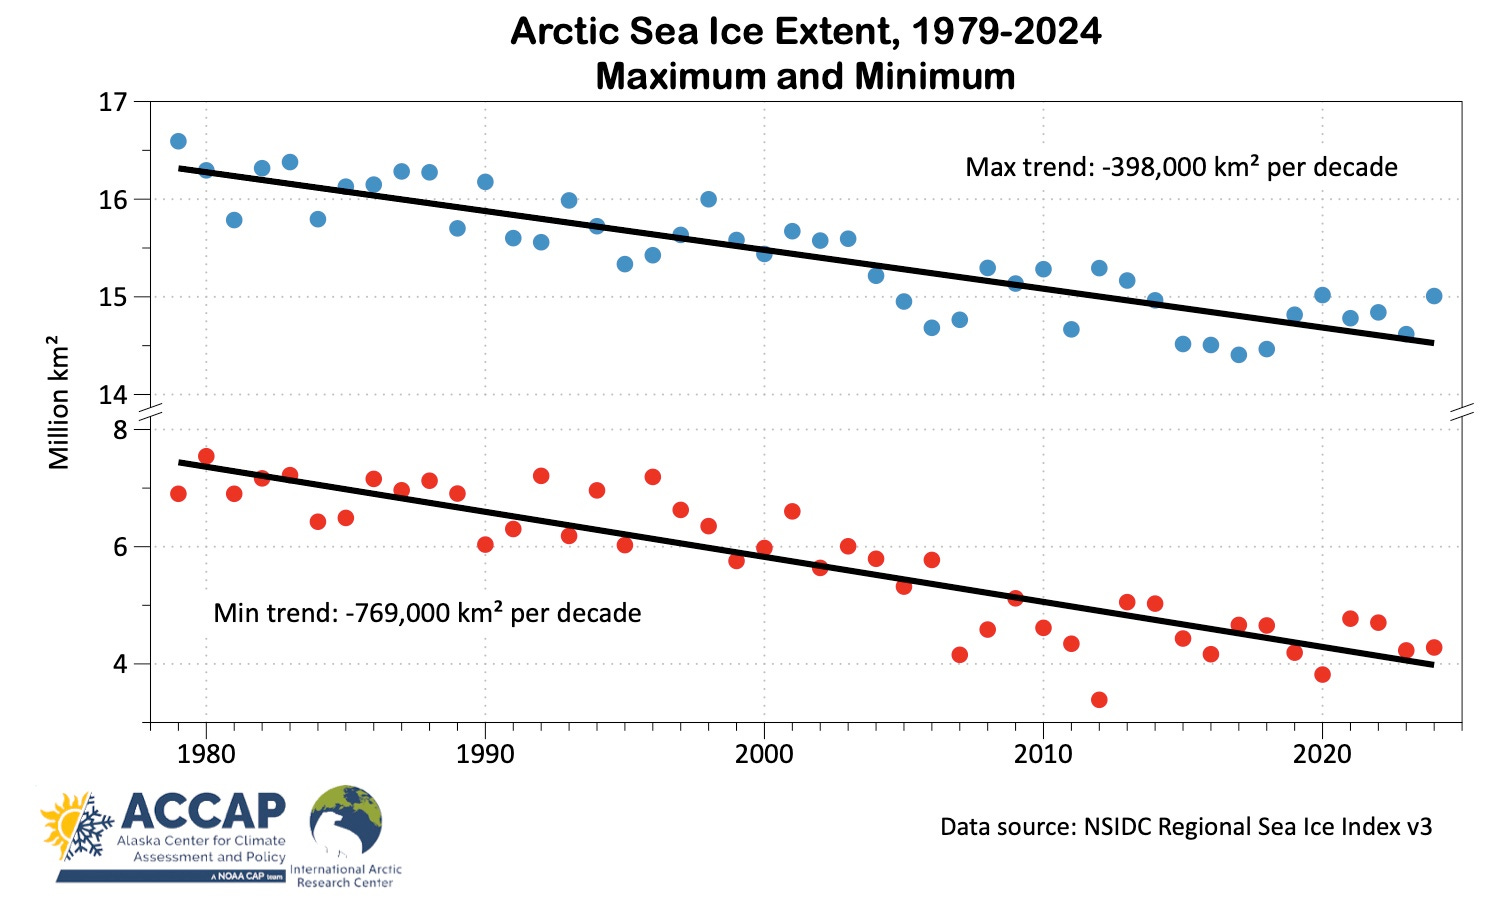
Because of the strong trend and modest year-to-year variability, it's trivial to predict that the September 2025 minimum extent will be lower than the long term average and lower than the minimum every year before 2007. Indeed, based on nothing but the 46-year ordinary linear regression of the seasonal minimum, there’s about a 15 percent chance that the 2025 minimum extent will be lower than the 2012 record low extent. So the question is: does the occurrence of a record low maximum extent in March change those trend odds?
Seasonal Correlation
A standard way to assess the correlation of two physical variables when there is a significant trend over time is to compare not the absolute values of the maximum and minimum extent, but rather how each year differs from the expected values. In this case, this is just the difference between the linear regression values and the actual (for those of a statistical inclination, the residuals of the regression). I’ve plotted these in Fig. 2 below.
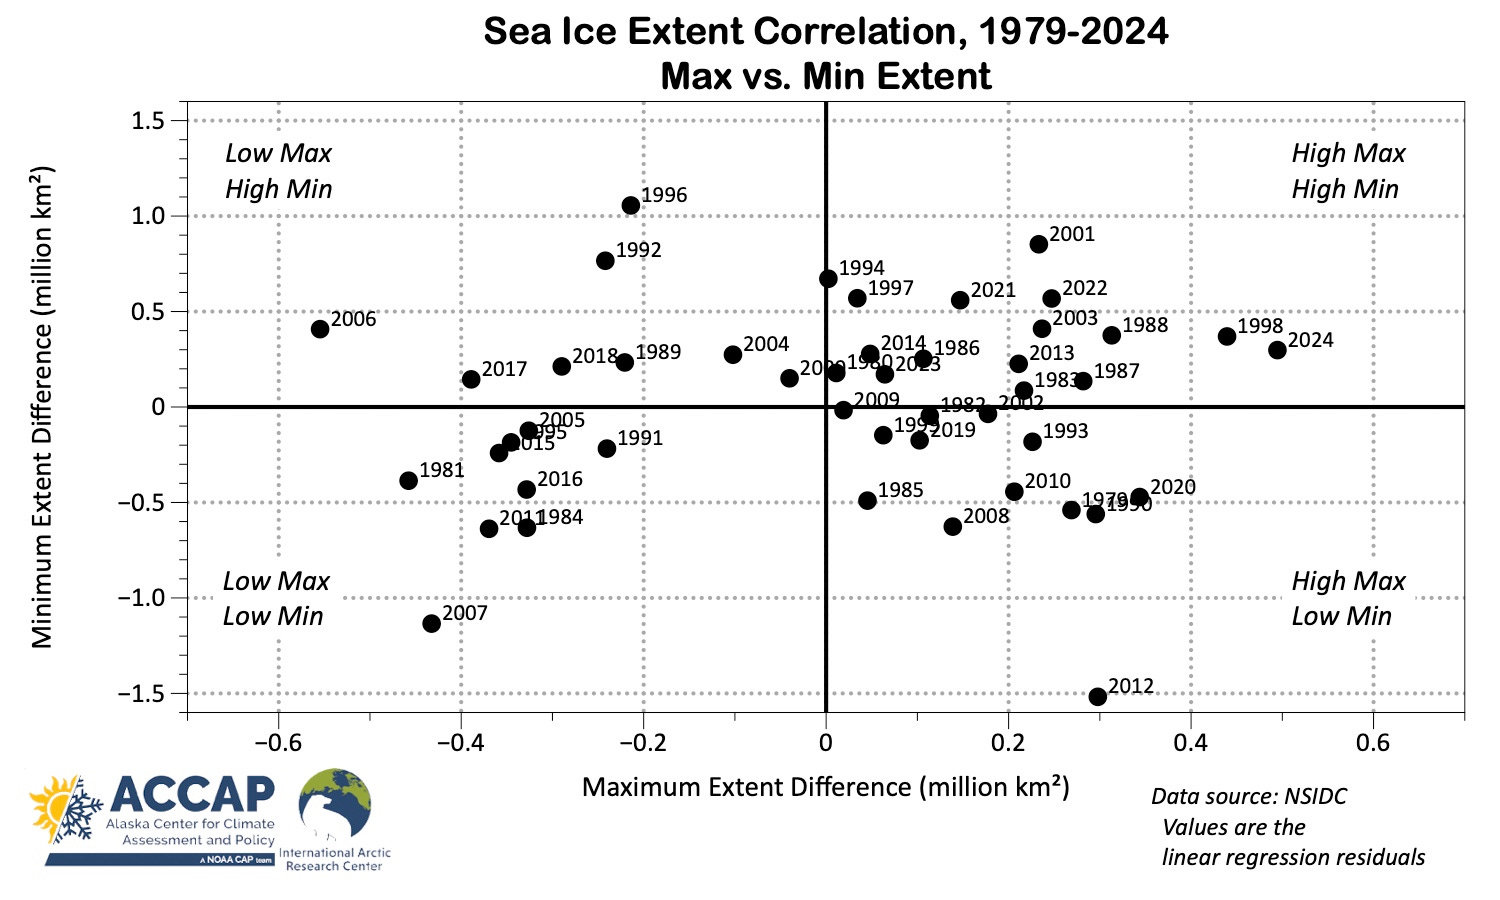
This shows the difference from the linear regression of the maximum ice extent on the horizontal axis and the difference in the minimum ice extent the following September on the vertical axis. As is obvious at a glance, after we take account of the significant trend in both maximum and minimum extent, there is no correlation between the spring maximum and the following September minimum. Relative to the trend, two of three highest September minimums occurred in 1996 and 1992, both of which were years the spring minimum was lower than the trend. Again, relative to trend, the lowest September extent was 2012, which had the second highest spring extent, while the second lowest September extent, 2007, followed a very low March extent. However, one year prior, March 2006, had a very low extent but the September minimum was above the long term trend.
Postscript
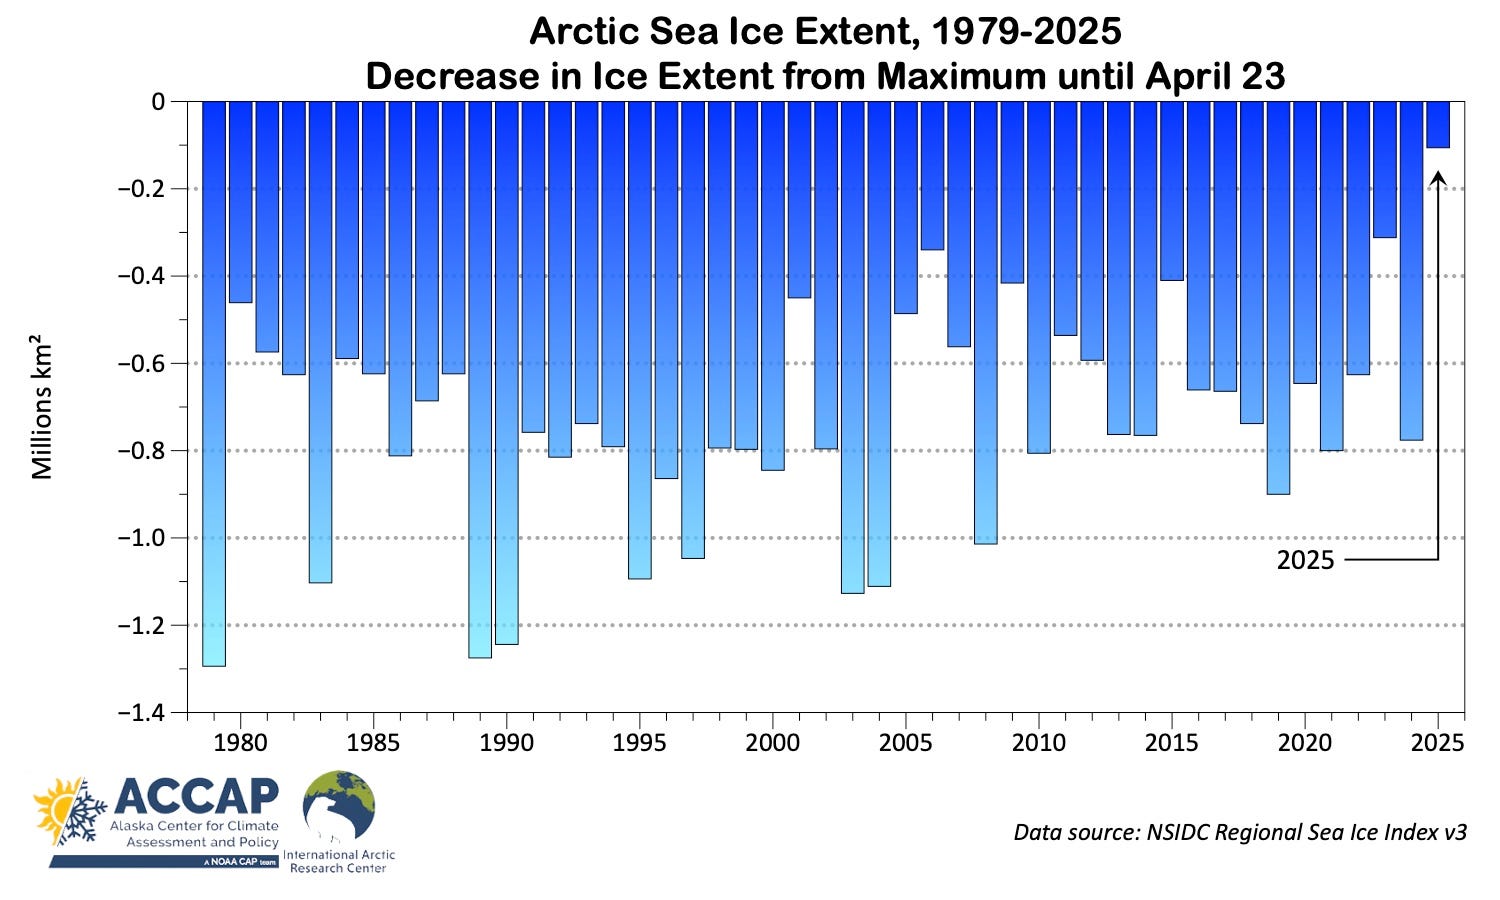
In the month since the 2025 maximum ice extent was reached, theArctic sea ice extent has only declined about 100,000 km². Figure 3 shows that in the 47 years of satellite data, there hasn’t been a spring with anywhere close to so little decline from the maximum extent to this point in the season. As of April 23, the Arctic-wide ice extent was “only” the 13th lowest for the date after having been the lowest for most of February and the first half of March.