The difficulties with constructing global scale temperature data sets that extend back into the 1800s are daunting and well documented. However, over the past 50 years, an immense of work at institutions around the world has gone into finding robust solutions to the many problems. The Arctic temperature record offers its own challenges. Some are shared with some other parts of the world; for instance the sparse land observational record, like, say, central Africa, and some that are uniquely polar, e.g. an ocean with effectively no observations most of the year, much like the Southern Ocean around Antarctica, or temperatures lower than some widely used thermometers were able to measure.
Multiple Arctic Temperature Reconstructions
It is a testament to the all work that has been done that there are now many separate data sets that reconsruct global temperatures at multi-decade to century time scales using different inputs and methodologies. And happily, there is very high agreement between the different data sets at both the global and regional scales.
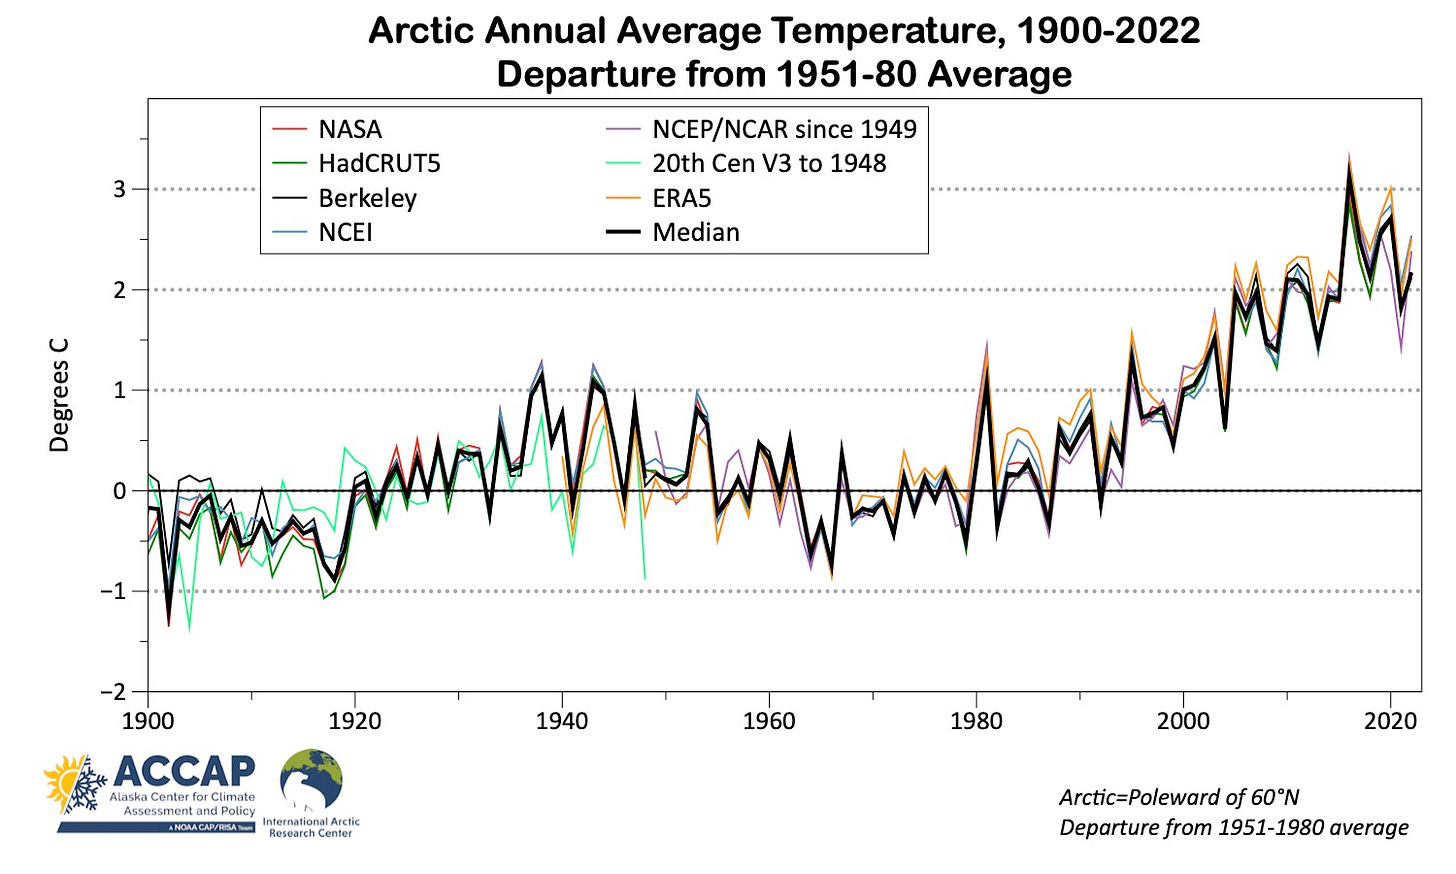
Figure 1 plots the annual average temperature for the Arctic (land and ocean north of 60°N) as the difference from the 1951-80 average from seven different data sets plus the median. There are many other data sets available, especially for the post 1979 period, but this gets the point across. To appreciate just how amazingly good this agreement is, keep in mind that the horizontal resolutions of these data sets varies from a latitude/longitude grid spacing of 5°x 5°for the famous NASA GISS data set down to 0.25°x 0.25° for the ERA5 reanalysis: that means ERA5 has 400 times the number of grid points as NASA GISS.

It is perfectly clear that different data sets with different methodologies and widely varying spatial resolutions are virtually in lock step with temperatures at the Arctic-wide scale since the 1950s and are generally in good agreement earlier in the 20th century. This is very good news when we need to quantify the changes we’re experiencing.
Arctic Temperature Changes
Zeke Hausfather, climate research lead at Stripe and a research scientist at Berkeley Earth, published an opinion piece on October 13, 2023 in the New York Times titled “I Study Climate Change. The Data Is Telling Us Something New” (available without paywall blocks here). Unsurprisingly, this has generated considerable media interest. In a nutshell, Zeke makes the case that at the global scale, warming is accelerating based on three lines of evidence: 1) the rate of increase of global average air temperatures is higher in the past 15 years than since the 1970s, 2) the rate of increase of the total heat content in the worlds oceans is increasing and 3) satellite measurements of the energy imbalance between the amount of solar heating received and the amount of heat leaving the atmosphere is increasing (that’s greenhouse gases in action).
Here I want to look at the air temperature component of Zeke’s evidence in relation to the Arctic and based on Fig. 1, I have complete confidence in using the ERA5 reanalysis for this purpose. Figure 2 plots the ERA5 12-month running average temperatures, again as the difference from the 1951-80 average, since 1941, and two difference estimates of the time varying average. The 12-month average removes the annual cycle and is simple way to account for the typically much great temperature variations that occur in winter vs. summer.

On the left, this is how I would model the long term (multi-decadal) average; a piece-wise linear regression removes the shorter duration variability while minimizing the difference from the fit. On the right I show a 10-year centered moving average. This allows some of the shorter term (few years) variability to be depicted but without too much noise. Obviously, neither is “better” than the other: it all depends on the purpose and use of the analysis.
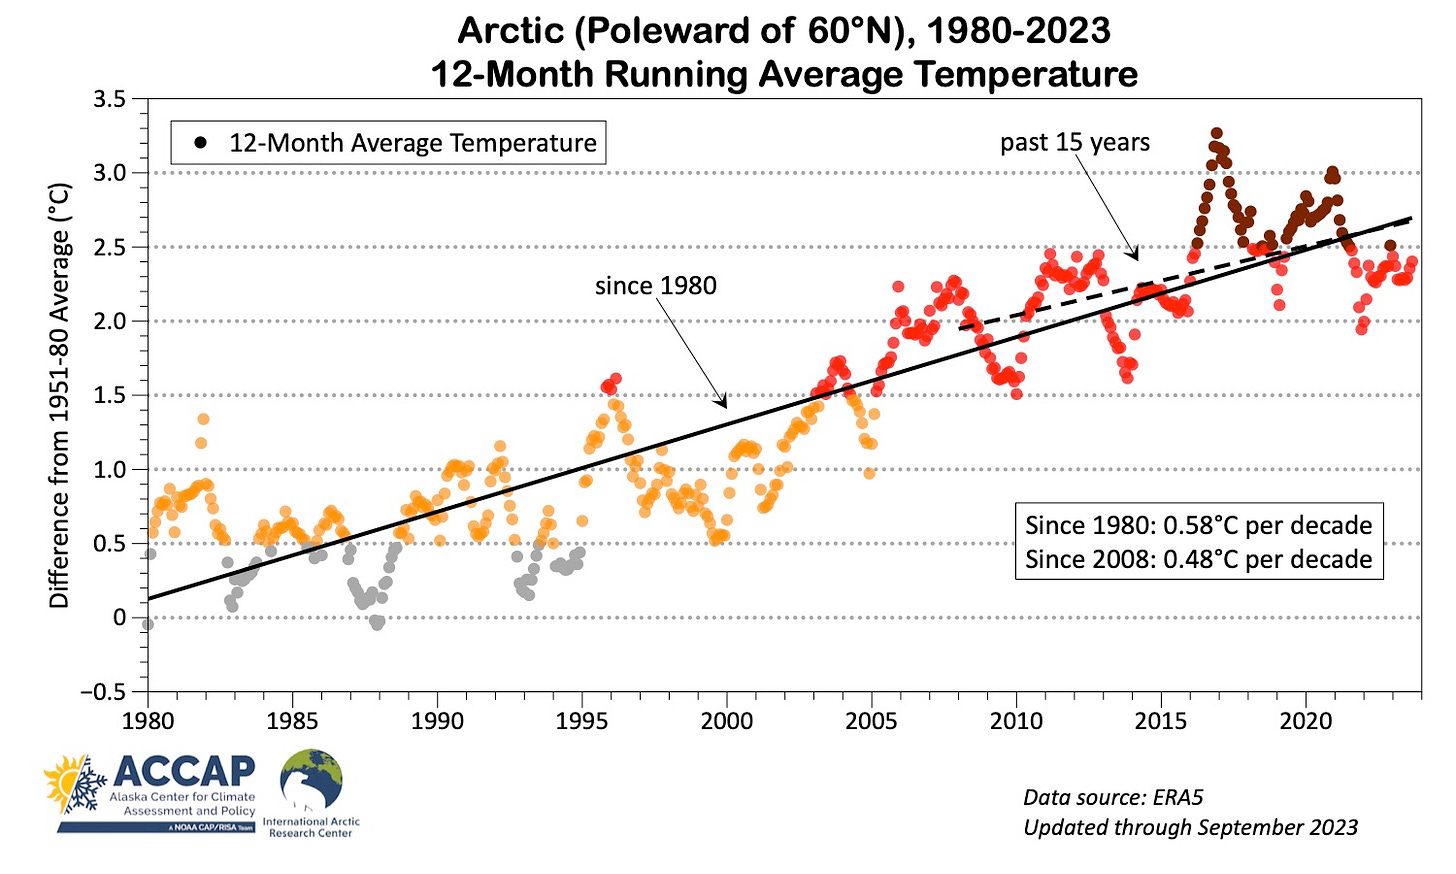
So in conversation with Hausfather’s analysis of global temperatures, Fig. 3 shows the same 12-month running average temperatures for the Arctic as in Fig. 2 but only since 1980. I’ve added a linear regression estimate of the average for 1980 to 2023 and one for 2008-2023. Note: this is NOT a recommended analysis practice: rather, this is simply to give a fair comparison with Hausfather’s piece. Of course, we did not need any statistical analysis to see that warming in recent years for the Arctic has not accelerated: in fact, the past 15 years the rate of change by this method (again, not a best practice) is lower than the 44 years since 1980. Rather, temperatures in recent years peaked in late 2016 and early 2017 and have declined slightly since then, though are still mostly at values higher than was typical in the preceding decade.

The fact that Arctic temperatures have has not increased quite as much in recent years relative to the longer trend means that “Arctic Amplification”, the difference between Arctic warming and that at low and middle latitudes is likely slightly lower now than it was a decade ago.
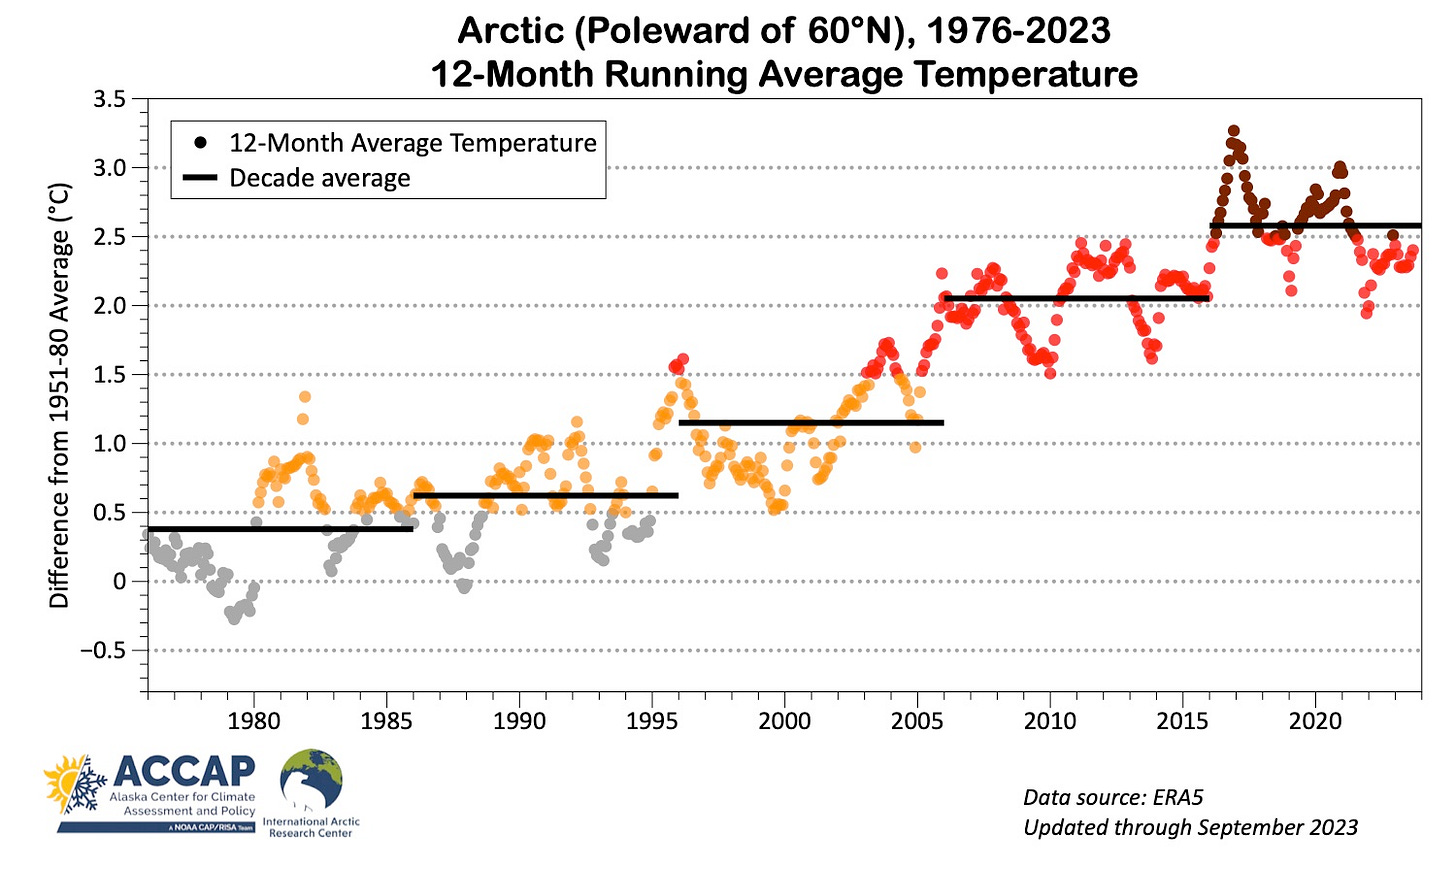
Figure 4 shows the same ERA5 12-month running average, but here since 1976 and I’ve added decadal averages, which shows a step-like increase of average temperature increases since 1976 (the increase between1976-1985 and 1986-1995 is not significant). Of course the most recent period is not a decade, and it’s quite likely that the 2016-2025 decade will wind up with an average temperature higher than the 2.6°C January 2016 to September 2023 value.

This “step-like” change is quite common in many environmental variables: in and near the the Arctic that includes sea surface temperature and sea ice extent and sea ice age.


