


June 2024 Climate Summary
Atmospheric Circulation, Temperature and Precipitation

This post covers June 2024 temperatures and precipitation in the Arctic and Alaska. For the June update on sea ice, Greenland ice sheet melt and wildfire, see my post here.
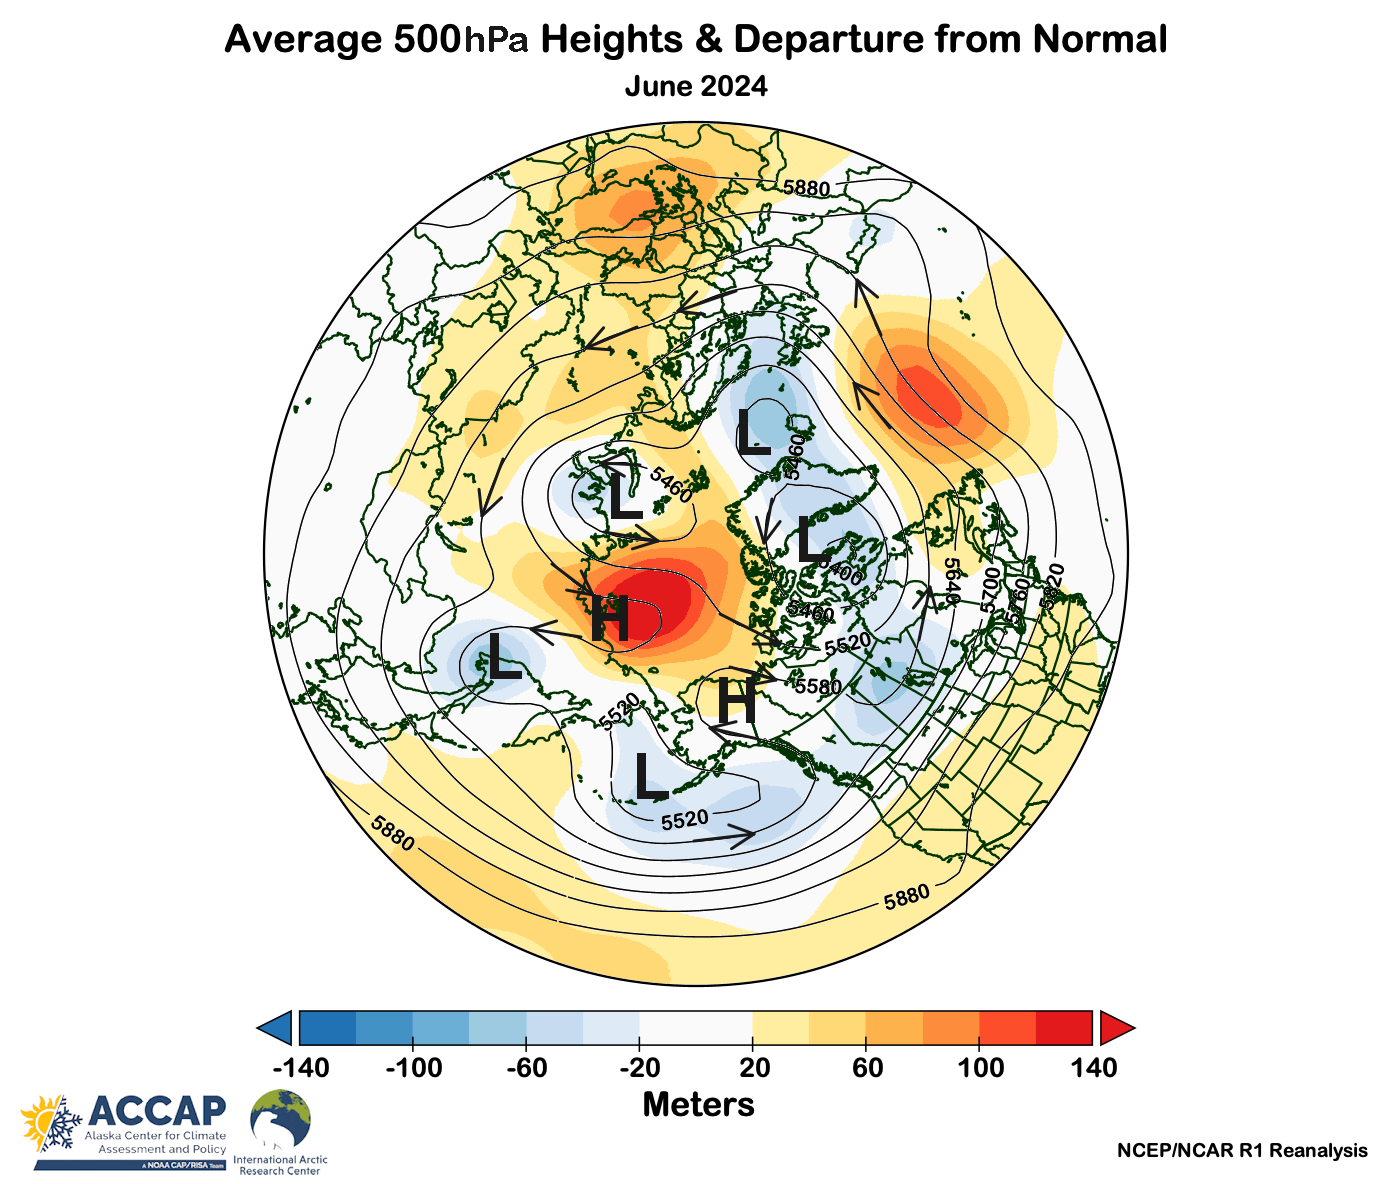
Arctic Circulation
The mid-atmosphere circulation pattern around the Arctic during June is shown in Fig. 1 and explains many of larger scale temperature and precipitation anomalies. The month featured strong high pressure centered near the New Siberian Islands and a weaker high over the Yukon Territory and northeast Alaska. Low pressure prevailed over the Kara Sea, the southern Bering Sea and Baffin Bay.
Arctic Temperatures
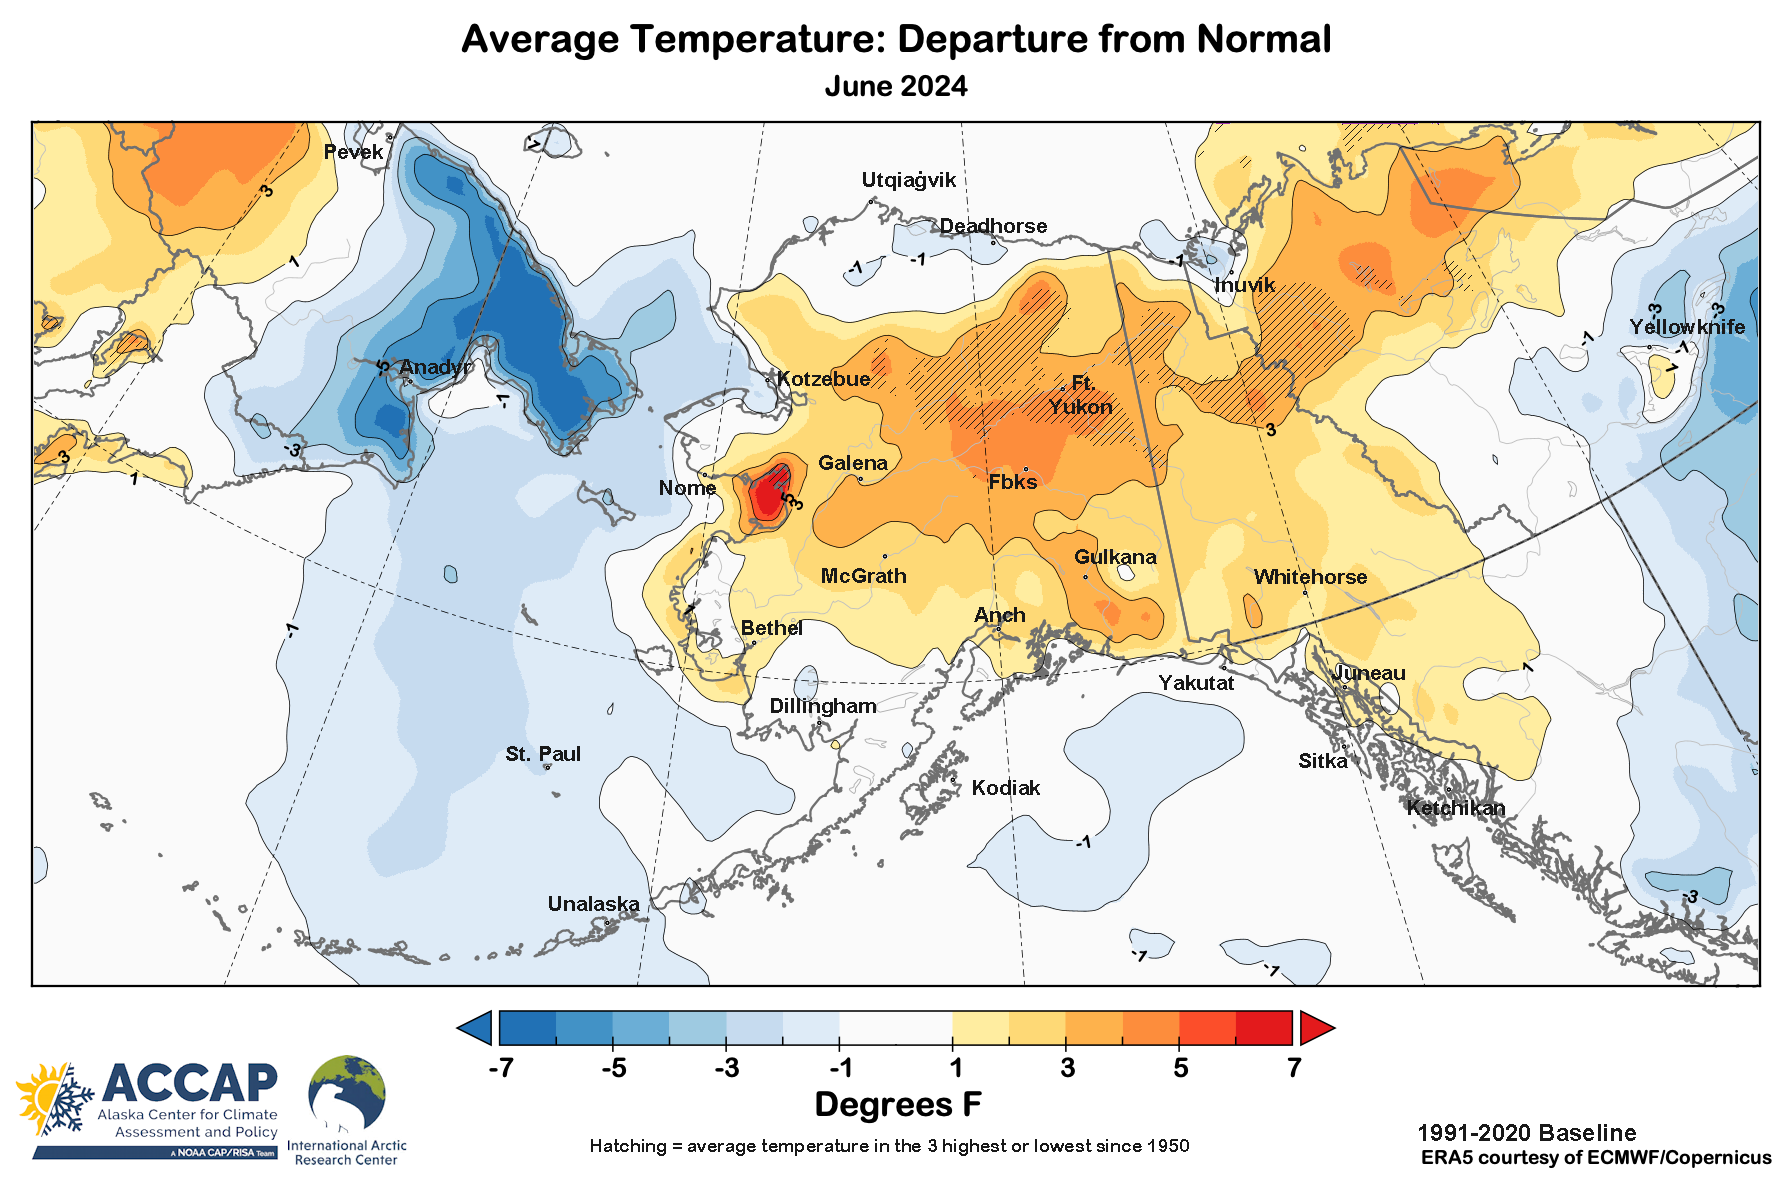
June temperature departures from the 1991-2020 baseline normal are shown in Fig. 2. A fairly large area in north central Siberia saw temperatures average more than 5°C above normal and at the same time well below normal rainfall (see below), so unsurprisingly this is the same area that has seen a lot of wildfire. The vast Sakha Republic had the fourth warmest June (since 1950), with only 2019, 2020, 2021 warmer (these were also big wildfire years). Although not as dramatic, the Nordic Arctic, much of Alaska and parts of northwest Canada were also significantly warmer than normal. Overall, about 11 percent of the Arctic had a “top three” warmest June.

The most notable area with below normal temperatures was on the west side of the Bering Strait, where the Chukotka Peninsula (180°W to the Bering Strait) had the coolest June since 1985, thanks to persistent sea ice in the western Chukchi Sea and north to northeast winds. However, nowhere in the Arctic had a “top three” coolest June.
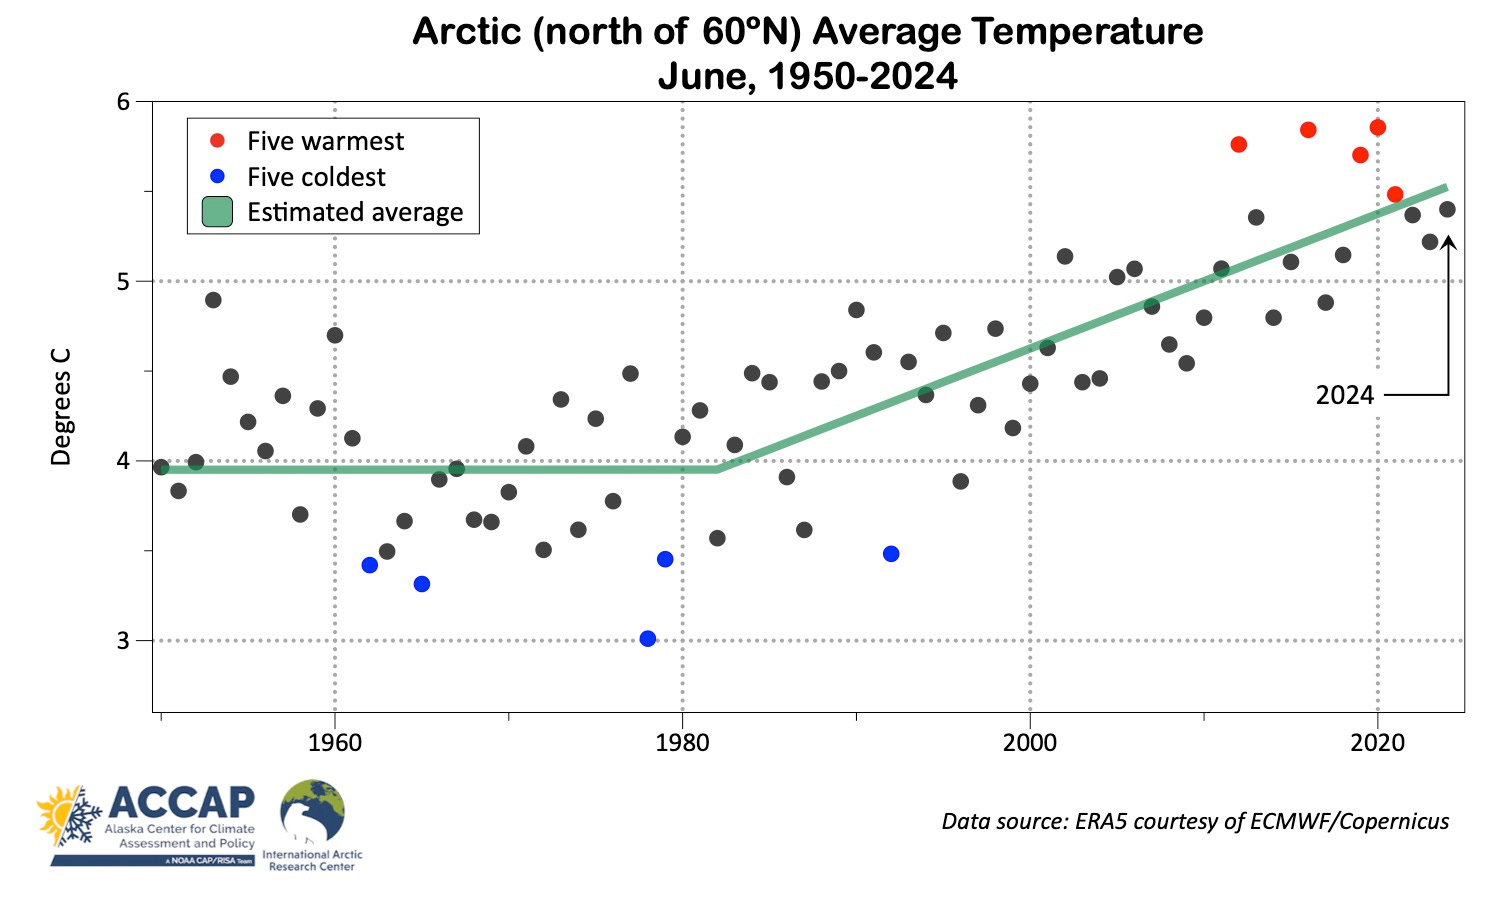
The June time series of Arctic average temperatures since 1950 (Fig. 3) shows no surprises, with this June average temperature ranking as the sixth highest in the ERA5 reanalysis data. Arctic lands were similar, with June ranking as the seventh warmest.
Arctic Precipitation
Just over 60 percent of the Arctic had below normal precipitation in June, the highest fraction below normal since 2005. Central and eastern Siberia (Sakha Republic) was very dry: June precipitation in ERA5 ranked as the second lowest since 1950 (only 1959 drier) On the flip side, much of Greenland was exceptionally wet. More than twice the normal precipitation over southern and eastern Greenland more than compensated for below normal totals over the northeast, so overall this was the third highest June total for Greenland since 1950 (June 2023 was the highest).

Alaska Temperature
From Fig. 5, most (82 percent) of Alaska was warmer than normal for June, with portions of the northern Interior especially warm. In contrast, parts of the Bering Sea coast and southwest Alaska were unusually cool. Reported temperatures around the state ranged from 20°F (-6.7°C) on the 3rd at the UAF Toolik Field Station in the Brooks Range to 90°F (32.2°) on the 26th at Whitestone Farm near Delta Junction. There were a handful of daily record high temperatures set during the month at long-term climate stations, most notably the 77°F (25.0°C) at Nome on June 10th that broke a 96 year old record by 3°F.
At the monthly scale, Bettles average temperature of 63.2°F was the second highest June average temperature in the past 80 years (only 2004 higher), while Fairbanks had the third warmest June. In contrast, Cold Bay had the coolest June since 2012 and St. Paul Island had the coolest June since 2013.
Alaska Precipitation
June was drier than normal over most of the state but with high variability over short distances. Figure 6 uses the large network of automated stations from the Alaska Fire Service and National Park Service (RAWS) that reliably report summer rainfall (but are not widely used in precipitation monitoring) to supplement other sources, as well as other available observations. While the overall impression is “dry”, there are some local exceptions. For instance, the Palmer area in Southcenral was an island of “near normal”, and Kodiak, the upper Tanana valley and northwest Interior/Brooks Range also saw places with near or even above normal totals.
The ERA5 version of June precipitation is shown in Fig. 7 and also highlights the high variability in Alaska. In northwest Canada, the low precipitation north of 65°N is notable, with a large area, mostly east of the MacKenzie River, having a “top three” driest June (since 1950). Some of the small areas with above normal precipitation in southwest Alaska are traceable to single storms. For instance, at Kodiak, more than half the precipitation for the month fell in a wet storm June 8-9.

Alaska Snow
There was some unusual snow in June. On June 4th a cold low aloft brought snow to portions of the southwest Alaska coast from Hooper Bay all the way south to Unalaska, including at Bethel. Most places had little or no accumulation but social media posts did show about an inch of snow at Toksook Bay. There was repeated light snowfall in the Bering Strait the first half of the month, especially at Little Diomede, and even a slight accumulation at Shishmaref (northern Seward Peninsula) on the 18th. The Toolik Field Station CoCoRaHS station in the Brooks Range at 2500 feet (760 meters) elevation reported 11.3 inches (28.7cm) of snow between the 2nd and 4th. While some snow is not unusual at Toolik in early June, this much accumulation is notable.
Thanks Rick, always look forward to your posts
Our neighbors had a package tour to Alaska cut short when the Denali park was closed due to fires. I understand that the fire season in Alaska is lengthening and increasing in severity. UA Fairbanks Intl Arctic Research Center has an article about what they're tracking
https://uaf-iarc.org/alaskas-changing-wildfire-environment/
Question do we have data indicating that Alaska's experience is circumpolar?