


January 2025 Arctic & Alaska Climate Review
Once again warm and wet

To no one’s surprise, January was another very mild month in the Arctic and Alaska, and in Alaska especially there was excessive precipitation.
Arctic
Temperatures
The January 2025 average temperature departure from the 1991-2020 baseline average from ERA5 reanalysis is shown in Fig. 1. Just over 70 percent of the Arctic (land and sea poleward of 60°N) had an average temperature above that baseline. That jumps to 90 percent using the 1951-1980 baseline. However, only a few areas, principally in parts of northeast Canada and the Russian European Arctic, had the warmest January since 1950. Areas colder than average were primarily found in the Asian Arctic, Iceland and eastern Greenland. Nowhere in the Arctic had a “top three” coldest January.
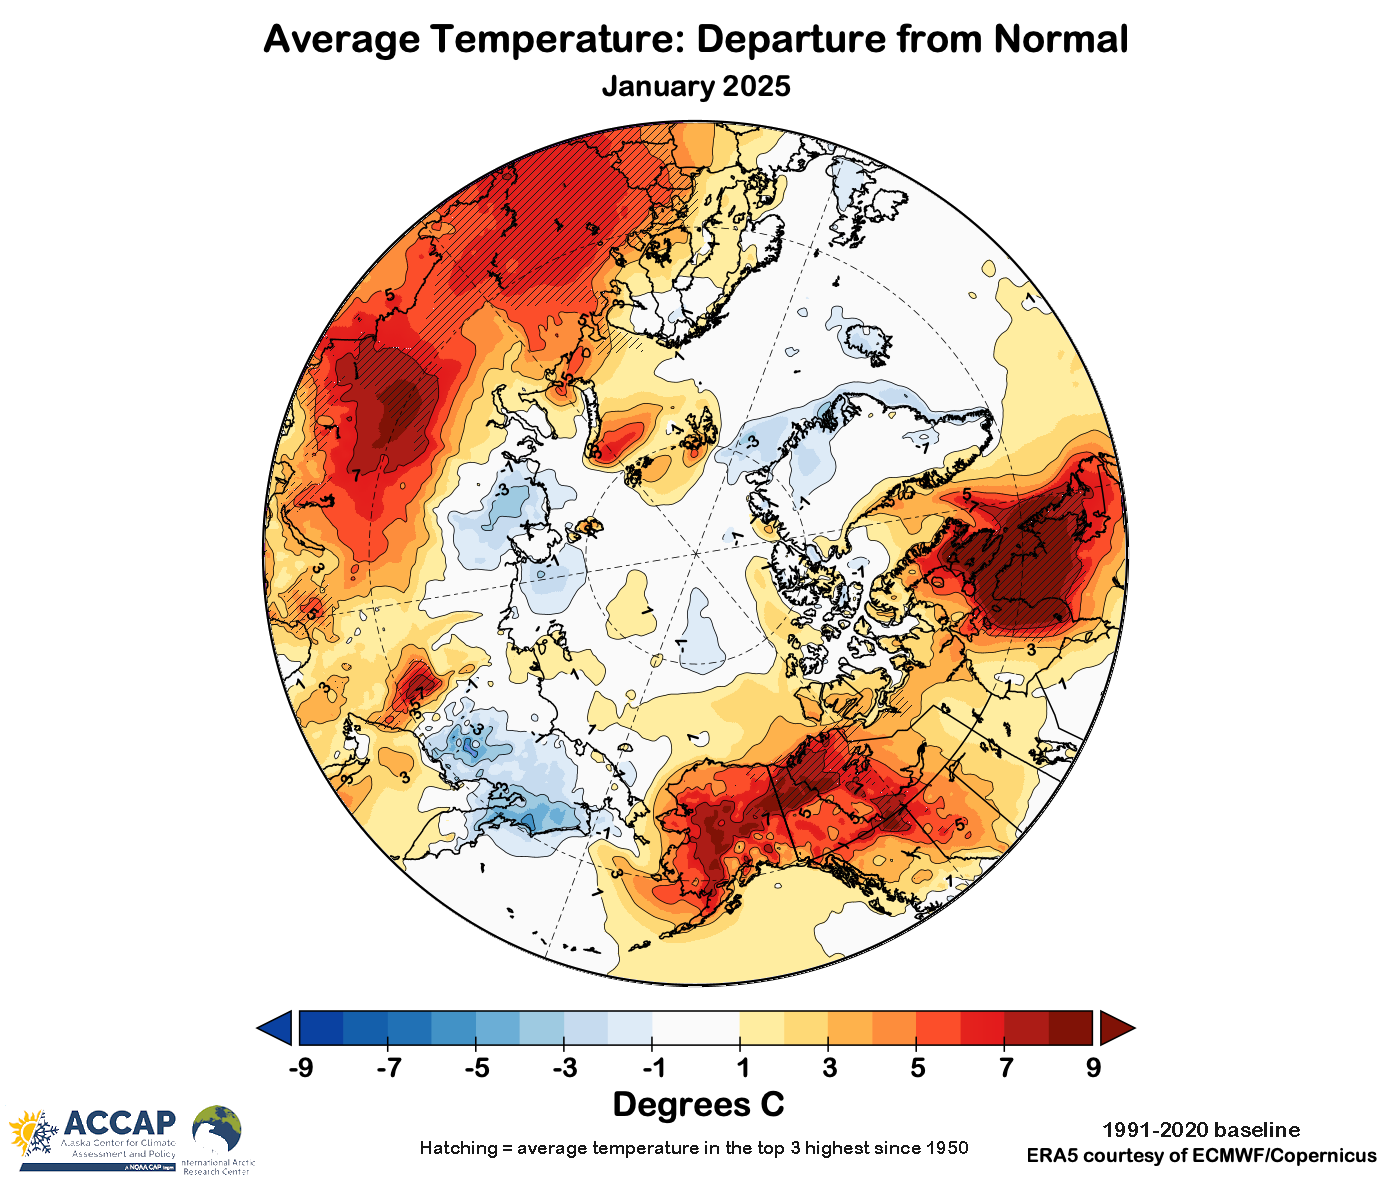
The lowest reported temperature in the Arctic (outside of the Greenland Ice Cap) was -56.8°C (-70°F) Volochanka (north-central Siberia) on January 22nd. Perennial cold spot Oymyakon, in eastern Siberia, reported a January low temperature of -56.0°C (-69°F) on New Year’s Day. I don’t have a comprehensive list of highest temperatures in the Arctic in January, but do note that Nenana, Alaska (64°N) reached 11.7°C (53°F) on the 12th.
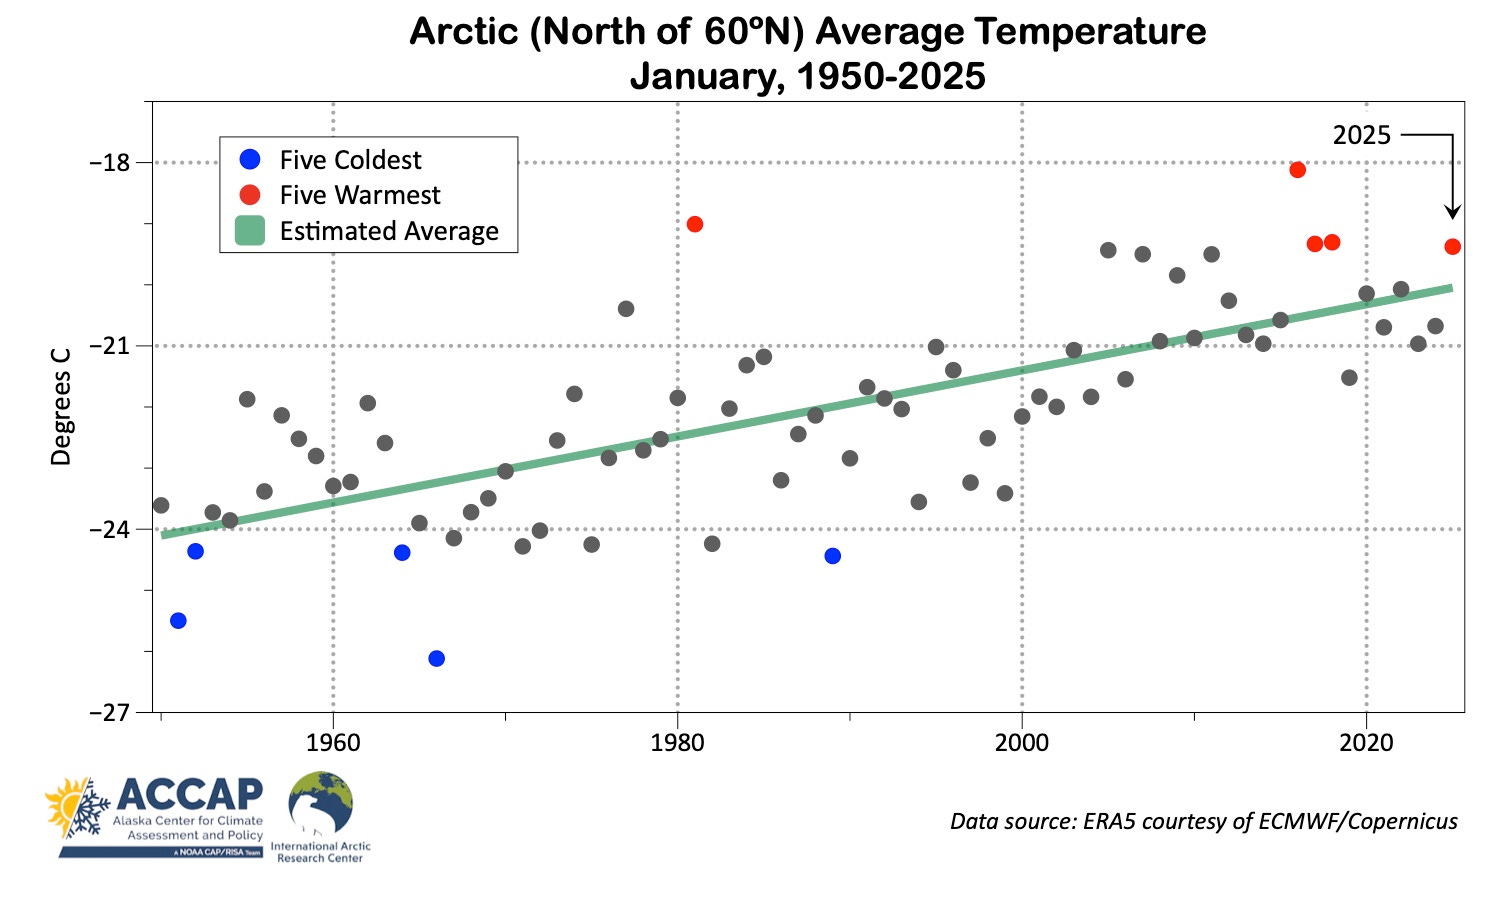
For planet Earth, the January 2025 average temperature was the highest for the month on record. For the Arctic, this was the fifth mildest January. For Arctic land areas, this was the fourth mildest. The trend since 1950 is as dramatic as it is unambiguous: about a 4°C increase in the average temperature.
Sea ice
The Arctic-wide average daily sea ice extent in January of 13.13 million km² was the second lowest in the 47-year NSIDC satellite record. The only January with lower average ice extent was in 2018. Figure 3 shows the average January sea ice concentration, with the ice well behind the 1981-2010 median on both the Pacific and Atlantic sides of the North Pole. The lower concentration ice in eastern Hudson Bay is a reflection that it took most of the month to freeze, while in the central Bering Sea the lower concentrations reflect the average outcome of episodes of ice advance and retreat.

The daily sea ice index (which is a 5-day running average of ice extent) was in the top five lowest every day of the month and lowest of record January 3-9.
Alaska
I posted some of the details of the daily level extreme temperatures and precipitation during January here. In this post I’ll focus on the monthly scale.
January was very mild in Alaska, though large as these departures are, it doesn't appear that any of the long term climate sites had a "top five" mildest January. This was primarily due to cooler weather at both the start and end of the month, bookending an otherwise prolonged exceptionally mild weather. Over mainland Alaska, for most places this was the mildest January since 2014 and/or 2016. For Southeast, January 2023 was generally milder.

Reliable site-specific temperatures in January around the state ranged from 54°F (12.2°C) at Sitka Airport on the 6th to -57°F (-49.4°C) at Chicken on the 4th.
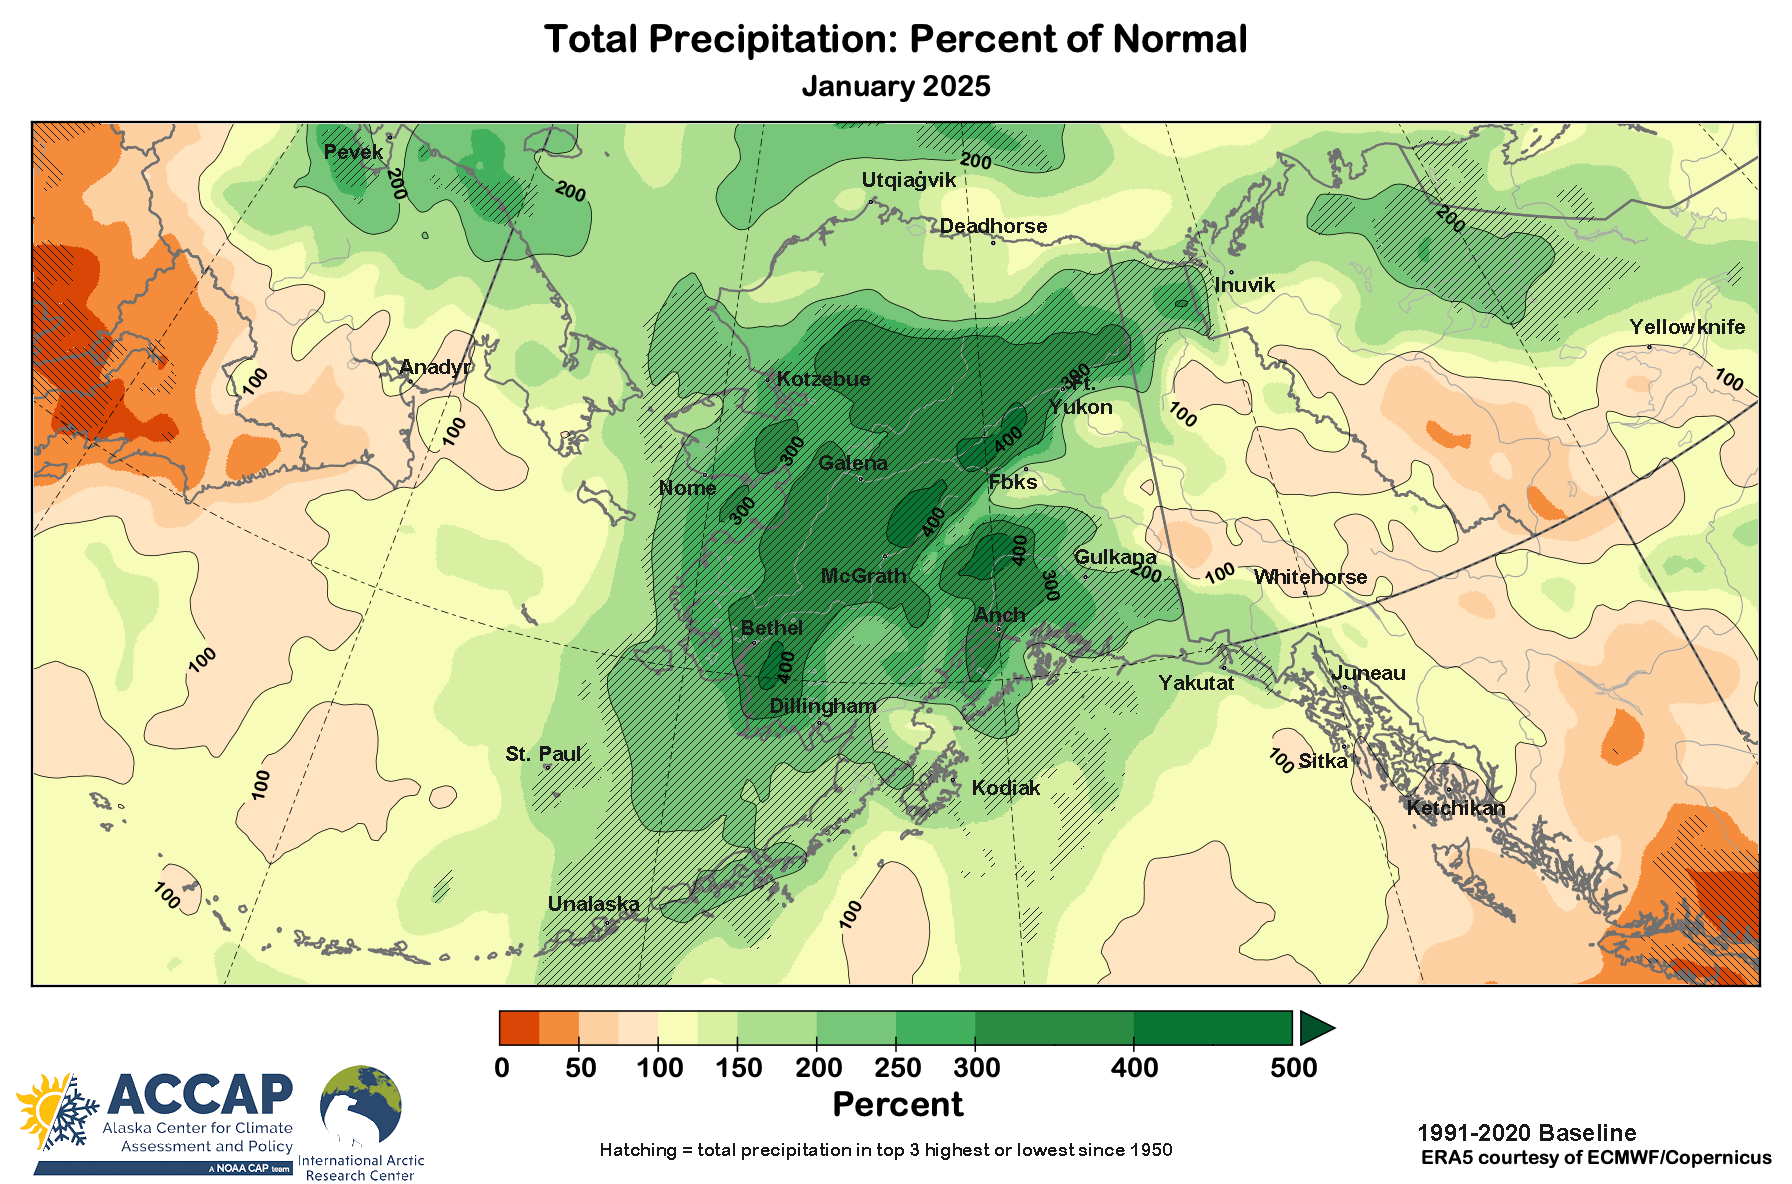
Figure 5 shows that precipitation for January was incredibly high over most of mainland Alaska. In ERA5 reanalysis, over 40 percent (!!) of Alaska had the highest January precipitation since 1950 and this was by far the highest January total in that time, more than 25 percent above the previous highest (in 2001). Prior to 1950, the only potentially higher precipitation January was in 1937. A close inspection of Fig. 5 shows some interesting small-scale mountain rain shadow effects, including one near Fairbanks and another south of Fort Yukon, and larger areas in the upper Tanana Valley into the Yukon Territory..
Snow
Snowfall in January is especially hard to assess due to the lack of on-the-ground observations in areas that received excessive precipitation. That said, north of the Yukon River, the few available observations show January snowfall two to four times normal. The highest reported total was 53.0 inches (134.6cm) at Wiseman (northern Koyukuk valley). South of the Alaska Range, low elevation snowfall was mostly below normal. Anchorage airport had only 2.4 inches (6.1cm), less than 20 percent of normal and the fifth lowest January total on record (since 1954). In Southeast Alaska, low elevation areas generally had around half of normal snowfall.
The January snowpack snow water equivalent analysis from ERA5 is shown in Fig. 6. This of course includes snow that fell earlier in the season (if it hasn’t melted away) and highlights the prevailing low (to non-existent) snowpack in southwest Alaska, while much of the central and northern Interior and central Brooks Range had well above normal snowpack.

As is often the case in southcentral Alaska, snowpack relative to the long-term median is highly variable over fairly short distances, e.g. ranging much below to above median on the western and southern Kenai Peninsula as well as in the greater Anchorage area.
Why so warm and wet?
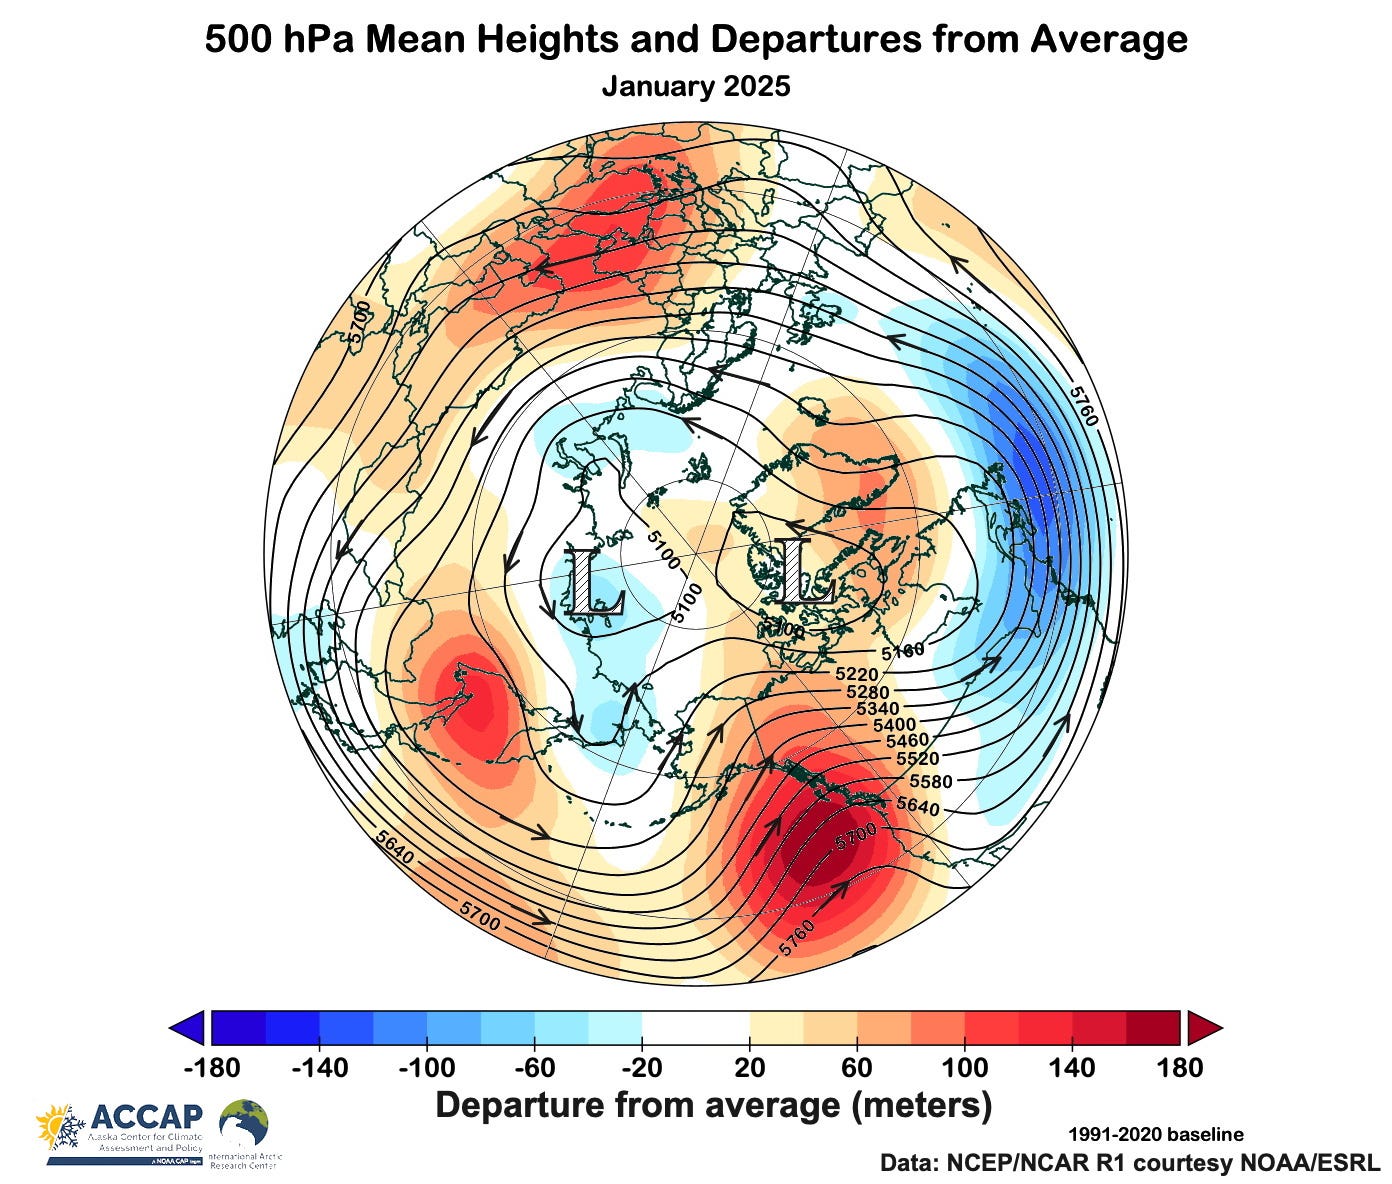
Of course the obvious question is “why so warm and wet”. Figure 7 shows the January mean 500 hPa heights and departures from normal, along with arrows indicating the wind flow. Southwest winds aloft brought multiple rounds of warm and moist air from the Pacific Ocean into Alaska and northwest Canada, while low pressure centered near the New Siberian Islands kept parts of the Russian far northeast colder than average.
This is all fascinating! What always surprises me is how very opposite the trends tend to be from the west side of Beringia (Chukotka) and the east side (Alaska). Can you provide some explanation for why this is often true? Thanks, Rick!
The effects of the “stuck” January 2025 pattern in the Arctic extended further south also. It seems that February has changed to a different pattern, at least in California.