


February Climate Summary, Part 2
Precipitation and Snowfall/Snowpack

There were some notable station level precipitation and snowfall statistics in February. Anchorage Airport had the fifth highest February snowfall (since 1953) and Juneau the third highest snowfall (since 1942). Ketchikan’s precipitation of 23.22 inches ranks as the fifth highest February total since 1911 (though with multiple gaps).
Precipitation
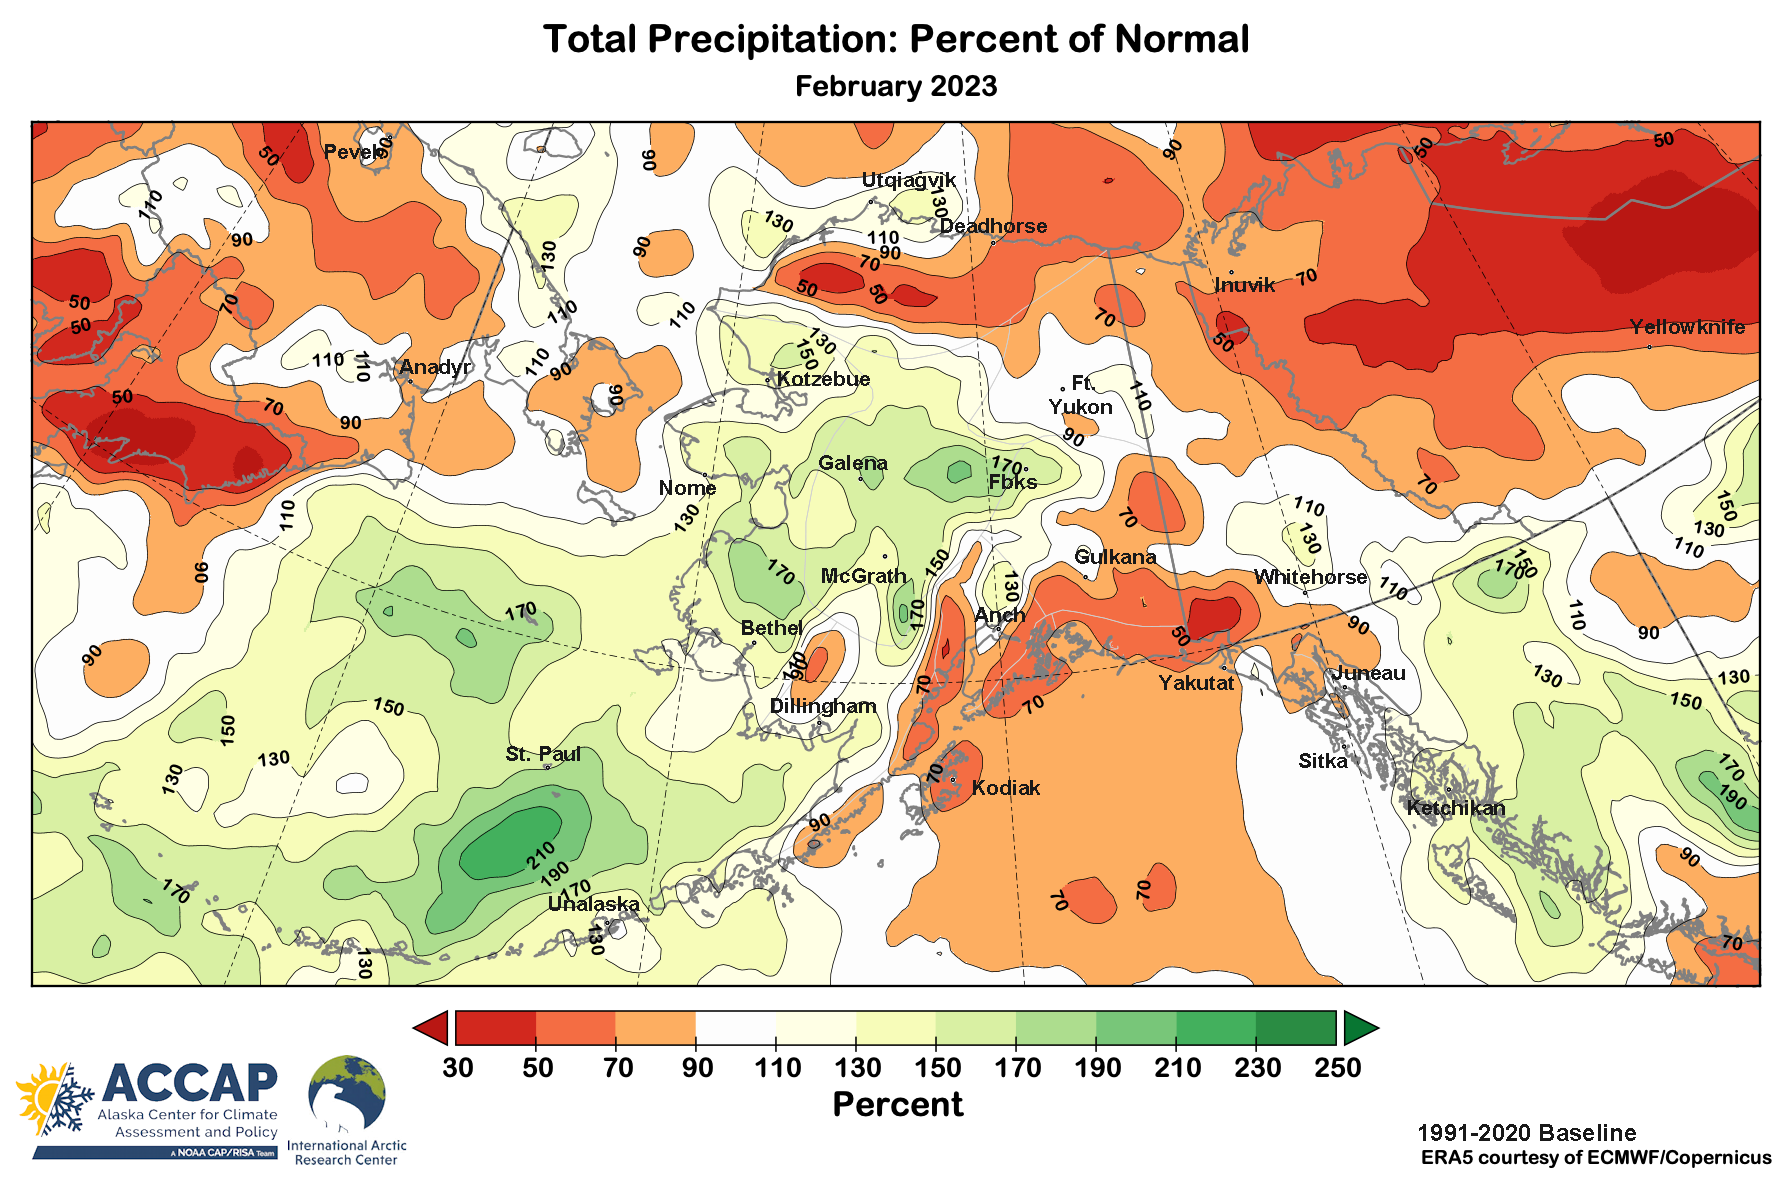
Looking across the region, February 2023 precipitation (the liquid total of melted snow plus any rain) as a percent of the 1991-2020 average is shown in Fig. 1. Totals were well above normal from the Bering Sea northeast into Interior Alaska. In contrast, the northern and western Gulf of Alaska, parts of the North Slope the southeast Interior were drier than normal. This pattern reflects a prevailing storm track through the southern and central Bering Sea and less storminess in the Gulf of Alaska.
Snowfall and Snowpack
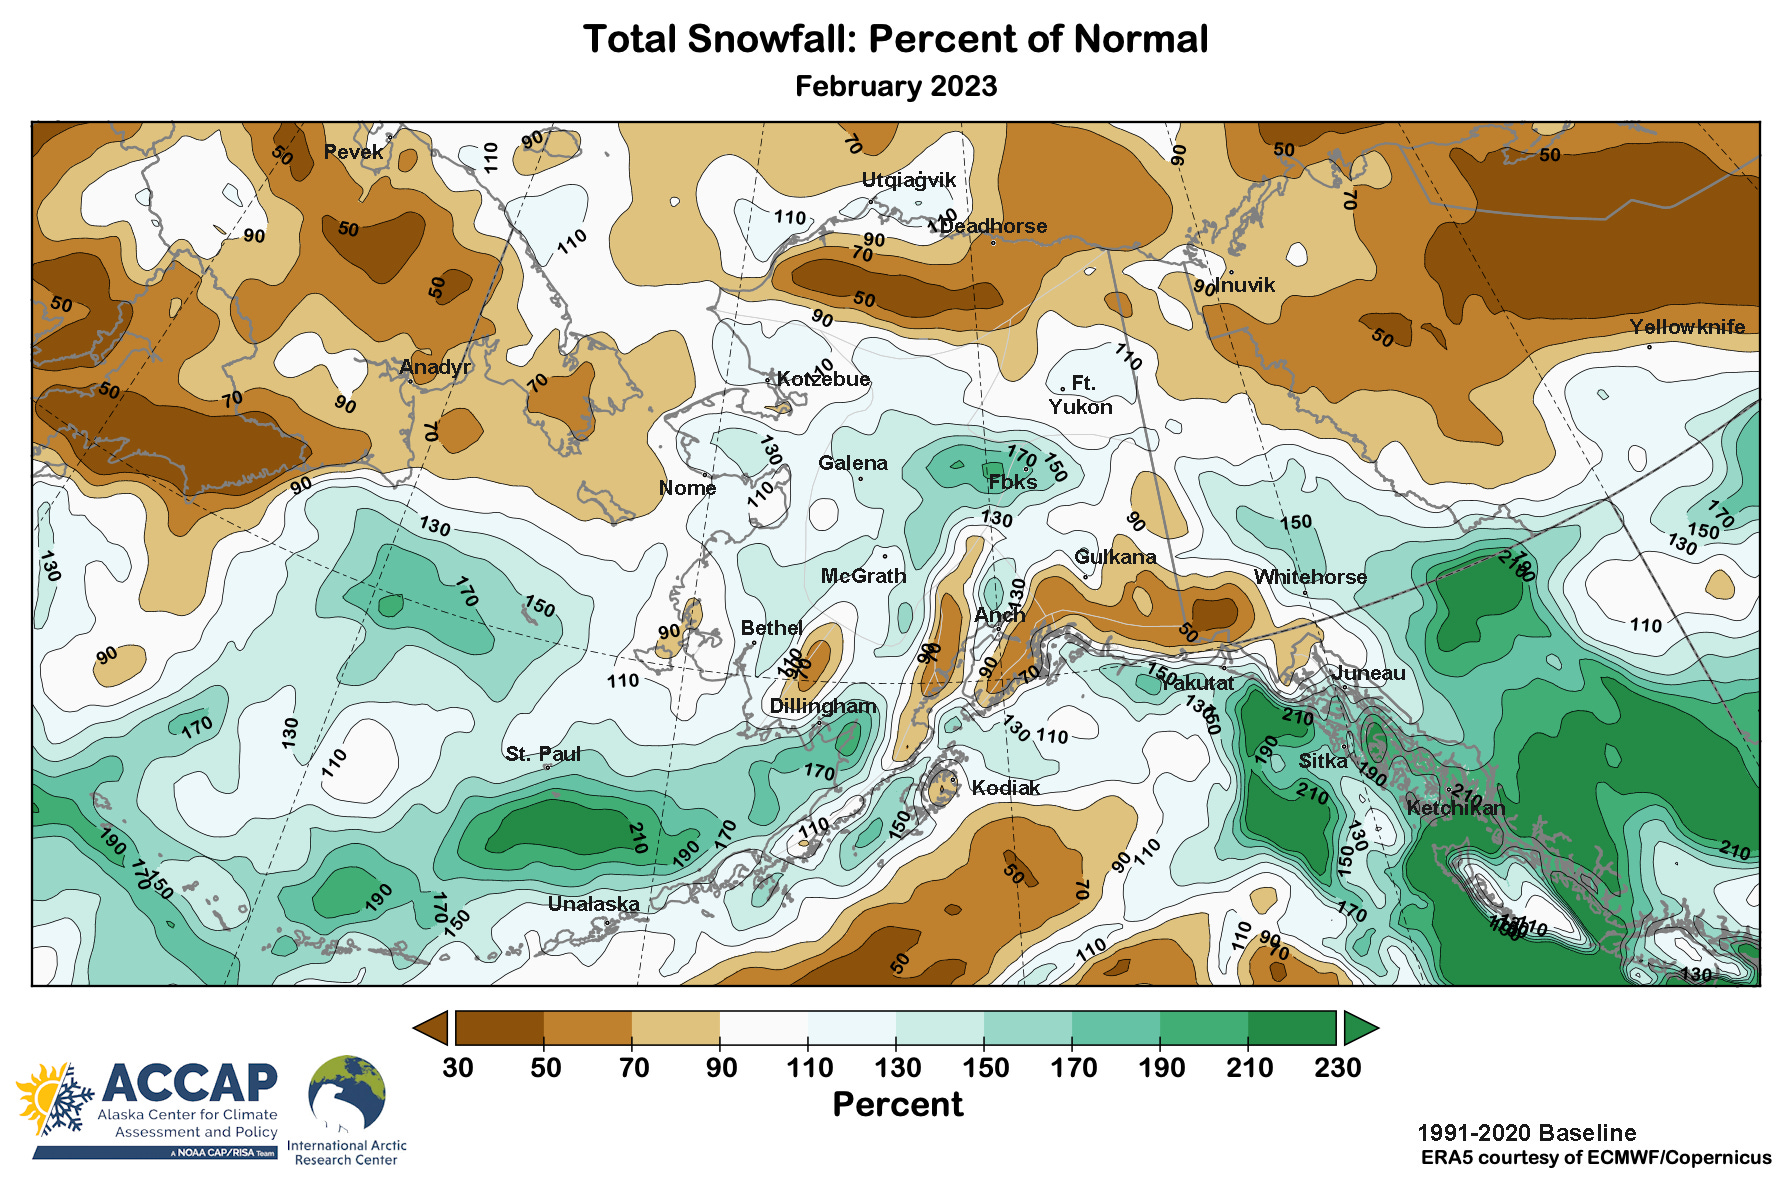
February snowfall (snow water equivalent) departures over mainland Alaska look a lot like the precipitation departures since nearly all February precipitation falls as snow. Snowfall was above normal from upper Bristol Bay NE into the southern Interior. Departures in Southcentral were mixed, with below normal totals over western Prince William Sound and eastern Kenai Peninsula but above normal snowfall from the northwest Kenai Peninsula north into the Susitna valley. There are clear differences between precipitation and snowfall departures in areas where both rain and snow are a regular part of the February climate, mostly noticeably over central and southern Southeast Alaska and the Alaska Peninsula. As always with Alaska climate, multiple mountain ranges interacting with winds aloft create big differences in short distances.
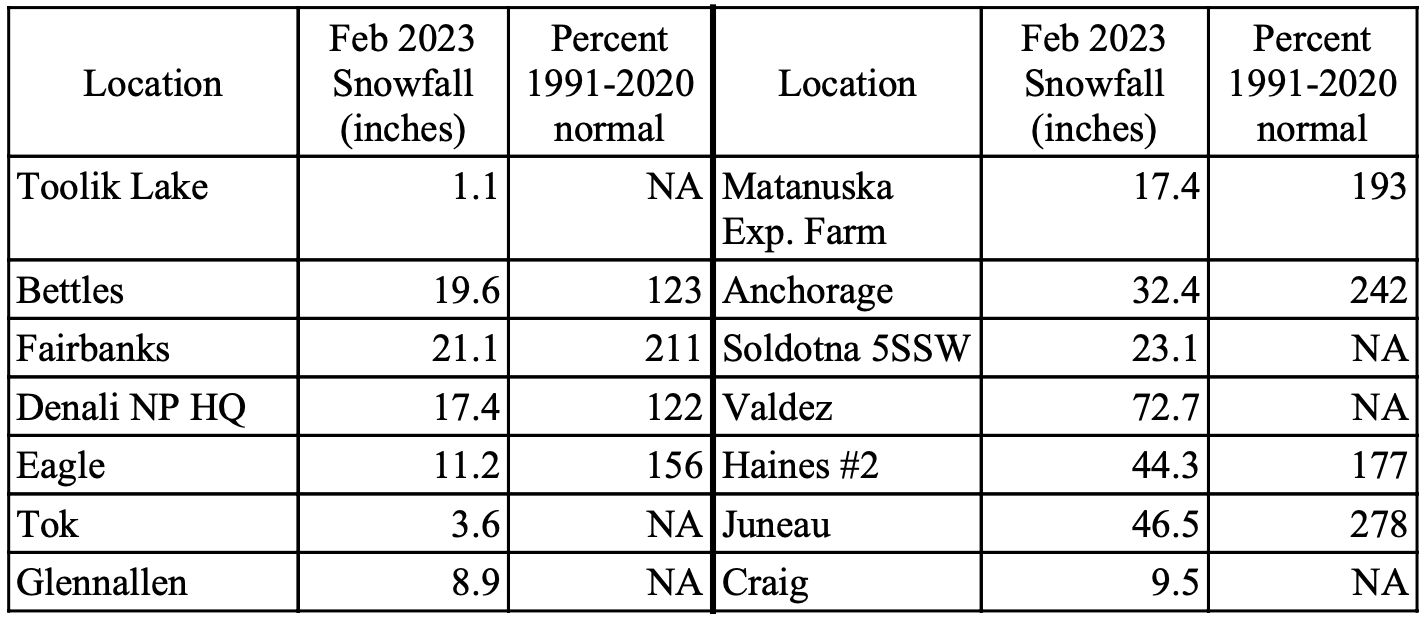
Usually when we think of snowfall we think of the depth of solid accumulation, that is, “how much snow do I have to shovel today?” This is something that automation is not well suited to measure and isn’t well modeled by reanalysis products. And to make matters worse, daily snowfall (as opposed to instantaneous snow depth) is measured at far fewer places in Alaska than 30 years ago. So, by popular demand (okay, one person), Fig. 3 gives a sampling of February total snowfall as reported by NWS forecast offices and volunteer observers.
Lastly, Fig. 4 shows the modeled snow water equivalent (SWE) of the snow pack at the end of February as a percent of the 1991-2020 median (by convention, SWE departures are often referenced to the median baseline values). Much like last year, late winter snowpack is well above normal over much of the southern Interior. However, SWE in the uppermost reaches of the Yukon River drainage in the Yukon Territory and northwest British Columbia is no where near as high as February 2022. And while the magnitude isn't right, the ERA5 reanalysis correctly depicts higher SWE (relative to normal) in a narrow band from the western Kenai Peninsula across Anchorage and northward into lower Susitna Valley. Significant snow on the ground is usually a transient feature of the winter climate at low elevation on the outer coast of Southeast Alaska from Sitka southward. However, cold weather at the end of the month produced generally above normal snow pack.
