


February 2025 Arctic Sea Ice Update
Ice extent at record low level for this point in the season

Since the end of the 2024 melt season, Arctic-wide sea ice extent has remained low relative to not only the full satellite era record (since 1978-79), but even compared to recent years. Figure 1 plots the daily ice extent every season since 1978-79 November through late February. Note that the Arctic ice extent in almost every season thus far in the 21st century (orange and red lines) is below almost every season in the late 20th century (blue lines). Since November 1, this season’s daily total ice extent in the National Snow and Ice Data Center’s Sea Ice Index has been mostly in the “top three lowest”, with some days lower than any other year in the satellite record.
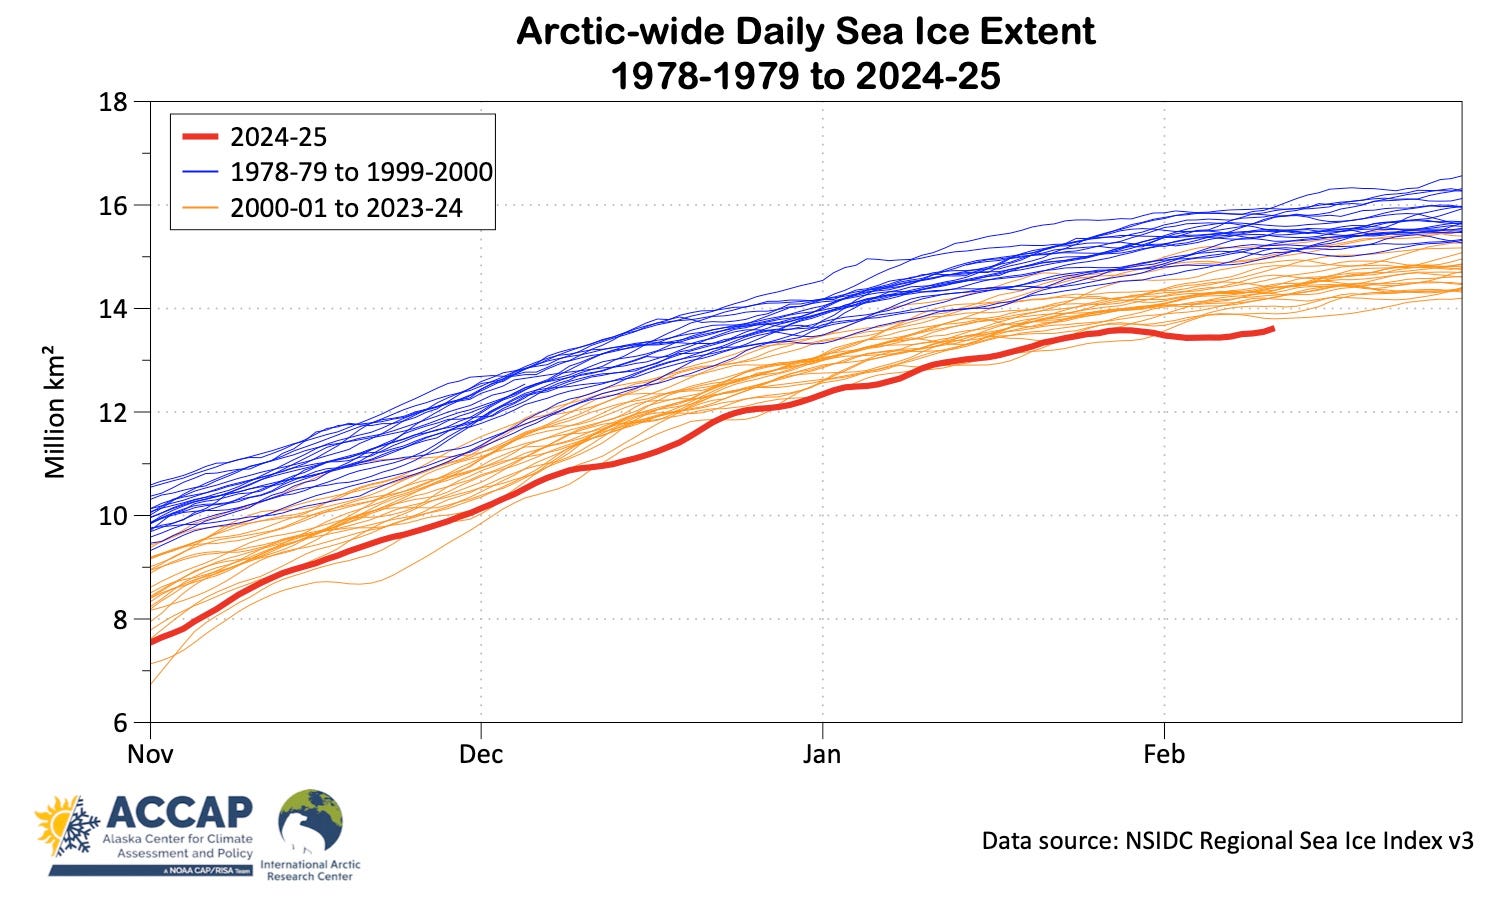
Figure 2 plots the minimum daily sea ice of any year 1978-79 to 2023-24 against this winter's daily extent, with dates with new record lows highlighted. As of February 11, the 2024-25 extent has been the lowest on record on 33 days, and that’s sure to increase.

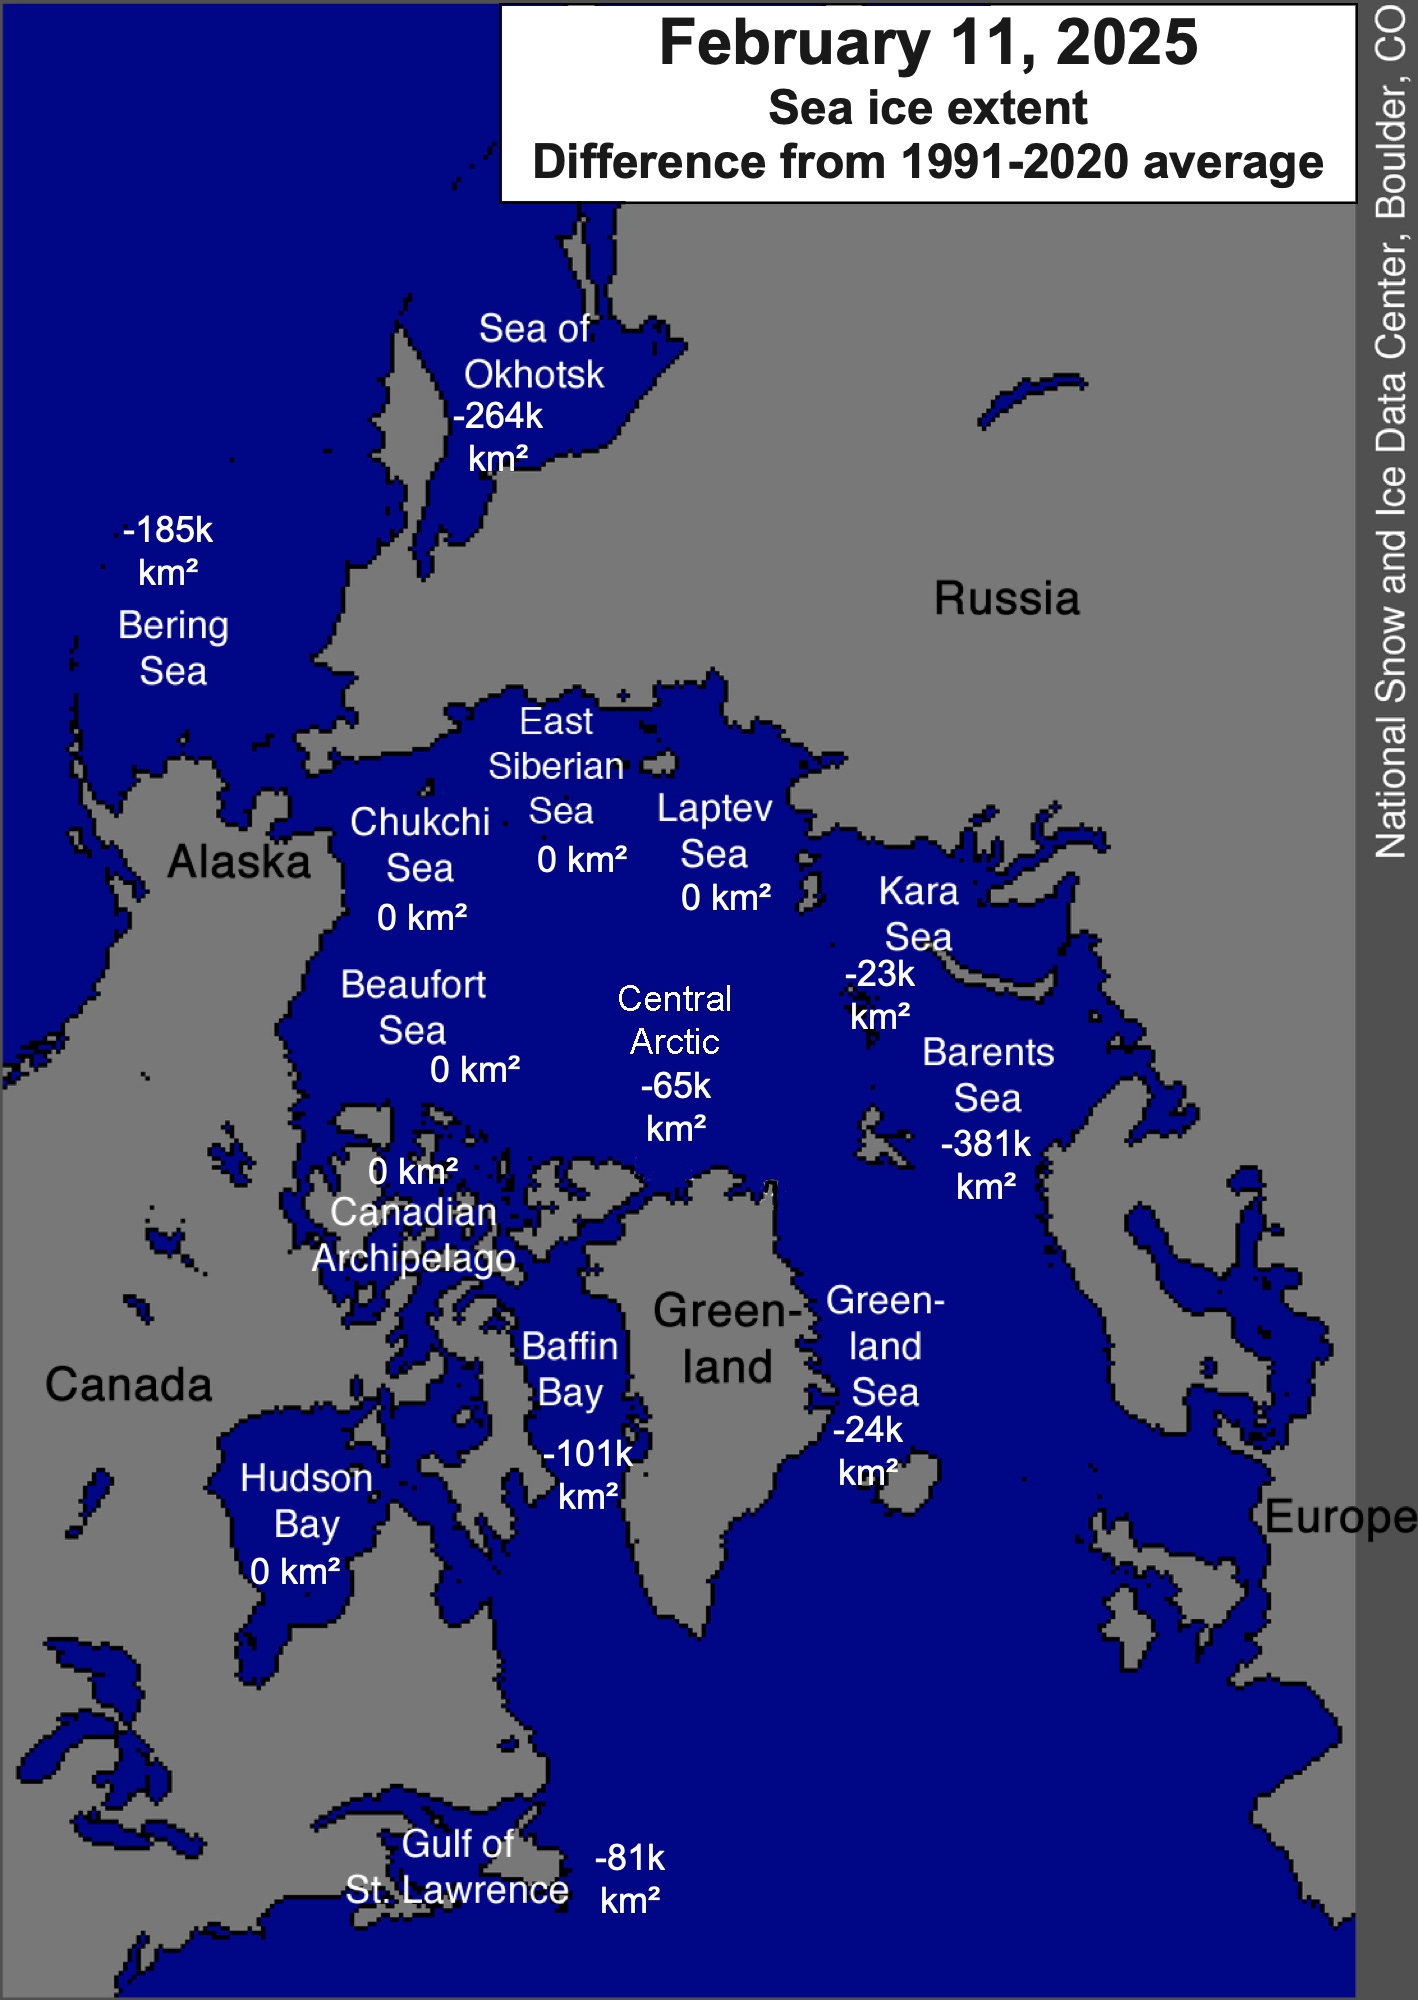
Figure 3 shows regional sea ice extent departures for February 11. Perhaps not surprisingly given the total extent is at record low, all the marginal seas have ice extent below the 1991-2020 average, with the departures in the Barents Sea on the Atlantic side and the Sea of Okhotsk on the Pacific side accounting for almost two-thirds of the “missing ice”. For the Barents Sea, the ice extent on February 11 was the lowest in the 47-year satellite record.
A subtle feature in Fig. 2 is the slight dip in total sea ice extent in early February. It’s unusual (but not unprecedented) for Arctic-wide ice extent to decrease at this time of year. The loop in Fig. 4 helps illustrate how this happened. This gif loops two weeks (Jan 29 to Feb 11) of ice edge and ice drift vector analysis from OSI SAF at Met Norway (H/T to S. Aaboe with Met Norway for pointing me to these graphics). Of particular note is the northward movement of ice to the north of Svalbard and northeast Greenland coast the first days of February. This resulted from strong south winds to the east of a very strong cyclone that moved northward through Baffin Bay to just north of the Greenland coast. The general movement of ice to the north in the northern Bering Sea and through the Bering Strait is just visible in the upper left corner.

While we watch the new Reich in the process of destroying the country, it simultaneously rolls back the woefully inadequate efforts made to date on climate change and overshoot. Thank you for these updates on the thawing state of the Arctic and Alaska. The planet is changing profoundly before our eyes, warming faster than modeling predicted, and most don't have a clue, a grand failure of intelligence and greed. The Arctic is turning into a GHG emitter, as are other carbon sink systems on the planet. The game is up, and the results are to be fearful.
C3S reports that 1.2+ trillion tons of global ice is melting annually, so 3.3 billion tons per day. Greenland surface temps in the mid 30'sF and North Atlantic in mid-50's to 60's. One moisture loaded low pressures system after another is pummeling the US, spawning multiple tornadoes IN FEBRUARY. HAPPY VALENTINE'S DAY! Remember, one pound of ice absorbs 144 BTUs as it melts. So, the melting ice is sending us an existential SOS, but we're not listening and a Madman Reigns supreme with his Ketamine dependent henchman leading the wave of government destruction poised to send us back into the upper paleotlithic, if not an even earlier phase of primate evolution. We are 3,000 times more populous than were our Hunter-Gatherer ancestors just a few thousand years ago. Many thanks for your work!