


Arctic Sea Ice is Growing
Winter Comes this Way

Arctic-wide Sea Ice
Arctic wide sea ice extent in NSIDC passive microwave as of November 18 was the very close to this date in 2021 and 2022 and the 13th lowest since 1978: all the years with lower ice extent on this date have been since 2006. Figure 1 shows the AMSR2 high resolution passive microwave derived sea ice concentration for November 18, 2023.
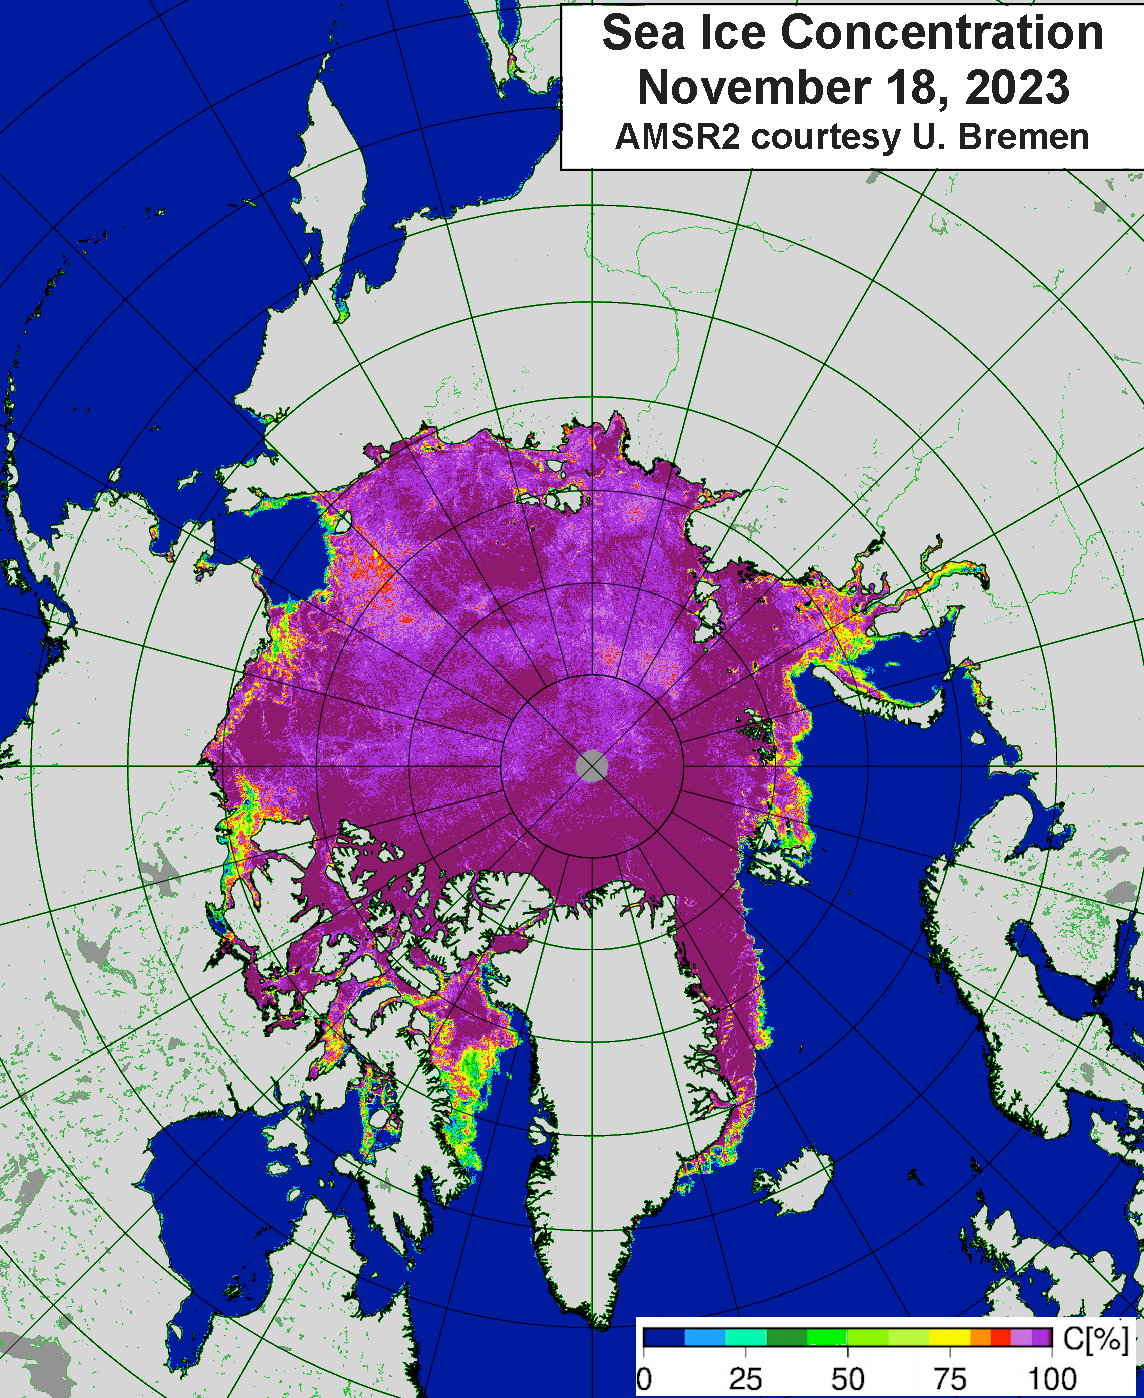
Multi-sensor and human interpreted analyses from e.g. US National Ice Center, NWS Alaska Region Sea Ice Program and Canadian Ice Service show somewhat more ice in some nearshore areas, principally on the Bering Sea coast of Alaska and in Hudson Bay, Canada.
Alaska Sea Ice
For seas that each winter become entirely ice covered, at least in the sense of no open water, a useful metric to track for climate change monitoring is the date when “ice-over” occurs. Near Alaska this means the Beaufort and Chukchi Seas. Given the vagaries of the NSDIC low-resolution Sea Ice Index data, I’ve chosen to define ice-over as the first data in the autumn when sea ice extent exceeds 95 percent of a particular sea (as defined by NSIDC). Equivalently, this is the first date when less than 5 percent of a sea is open water.
In the Beaufort Sea this autumn, the ice-over threshold was reached on November 12, which as you can see in Fig. 2 is typically “late” for the past 15 years, and the running centered average date of ice-over now about four weeks later than it was in 1980. Another interesting feature is the change in the interannual variability of when ice-over occurs. Prior to 2000, ice-over sometimes occurred in September, in other years not until November, with a standard deviation of ice-over date of about 14 days. And we know from the 1970s era Prudhoe Bay bound sealifts (large scale barge resupply flotillas) that ice conditions varied greatly east of Point Barrow during the summer and early autumn. That’s all changed now. Since 2009 the variability has decreased quite a bit: the standard deviation of ice-over date has decreased by a week and ice-over on November 3 plus or minus 10 days covers nearly all years.

Ice-over of the Chukchi Sea has always occurred later than in the Beaufort Sea, and it’s still a ways off. Figure 3 shows the daily sea ice extent this year to November 18, and for comparison I show the (smoothed) median daily extent for the four decades, 1980s to 2010s. The ice extent of November 18, 2023 would have been typical for early September in the 1980s.

Beyond Passive Microwave Sea Ice Estimates
Passive microwave satellite derived sea ice is known to have significant problems with near coast ice, sometimes not detecting ice when it’s there or, much more commonly, indicating ice when none is present. This is the usual state of affairs in the Bering Sea early in the winter, as ice grows out from the land (both Alaska and Chukotka) and only later expands into the open Bering Sea. While not nearly as long a time series as the Sea Ice Index, the National Ice Center/NSIDC Multisensor Analyzed Sea Ice Extent (MASIE) provides much better estimates of ice extent when the ice is mostly close to land. MASIE ice extent estimates are derived from multiple sources, including several sources of remote sensing and in situ observations and includes (gasp) human experts in the mix and are the nominal 4km resolution is higher than any passive microwave product currently available.
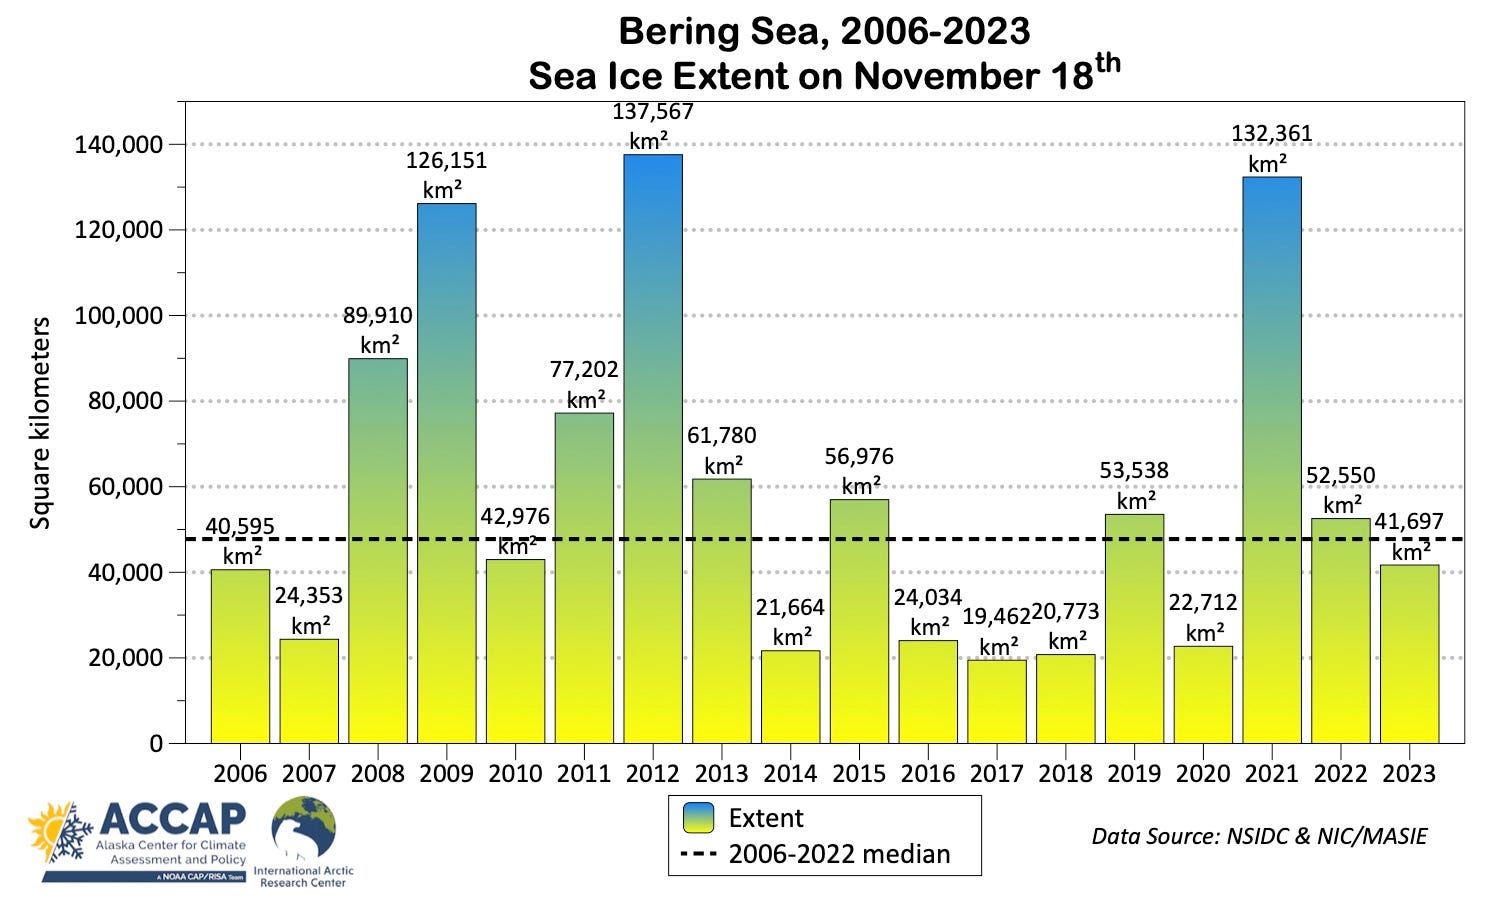
Figure 4 shows the November 18th ice extent since 2006 from the MASIE data. While not anywhere close to long enough for trend analysis, this is long enough to show the year-to-year variability in what we might call the “modern era” of sea ice. At this point Bering Sea ice is pretty close to typical compared to the previous 17 years.