


Arctic Sea Ice and Greenland Updates
Another eventful summer

Changes in the cryosphere, the frozen water part of our environment, are an important driver in the warming of the Arctic and indirectly areas further south. The Arctic-wide sea ice minimum extent is perhaps the most widely reported Arctic physical parameter reported by the general media, and the melting of the Greenland Ice Sheet has major long term implications for global climate and environments. So here’s a short update on where things stand as the end of the 2023 melt season approaches.
Sea Ice
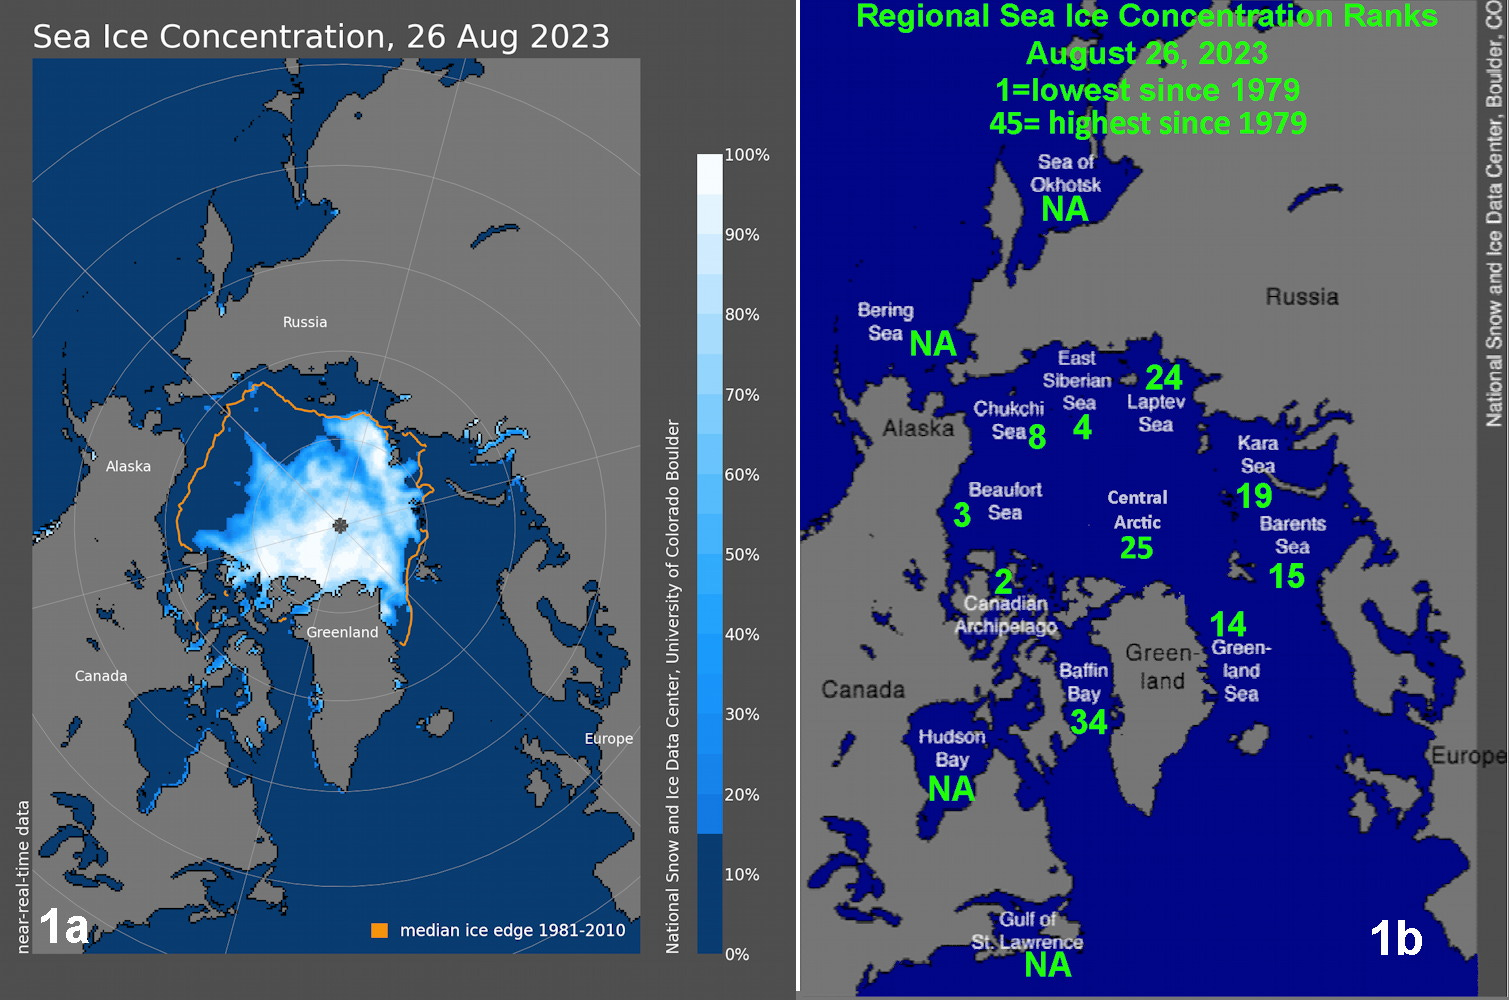
Sea ice continues to melt in the Arctic, though with the rapidly decreasing solar heating the pace of melt is now mostly dependent on winds and sea water interactions. As is often the case, the relative melt varies regionally around the Arctic. Figure 1a shows the August 26, 2023 sea ice concentration from the National Snow and Ice Data Center passive microwave analysis. The orange line shows the 1981-2010 median extent. At a glance it’s clear that the ice extent is quite low on the Pacific side of the Arctic compared to the Atlantic side. Figure 1b quantifies this difference, showing the rank of ice extent for the regional seas. From the East Siberian Sea eastward, north of Alaska to the Canadian Archipelago all the regions are in the lowest eight extents in the past 45 years, while none of the remainder of the basins are even close to that level. The Laptev Sea and Central Arctic basin are (slightly) above median, and Baffin Bay even higher, reflecting a cool summer in the northeast Canadian Arctic.
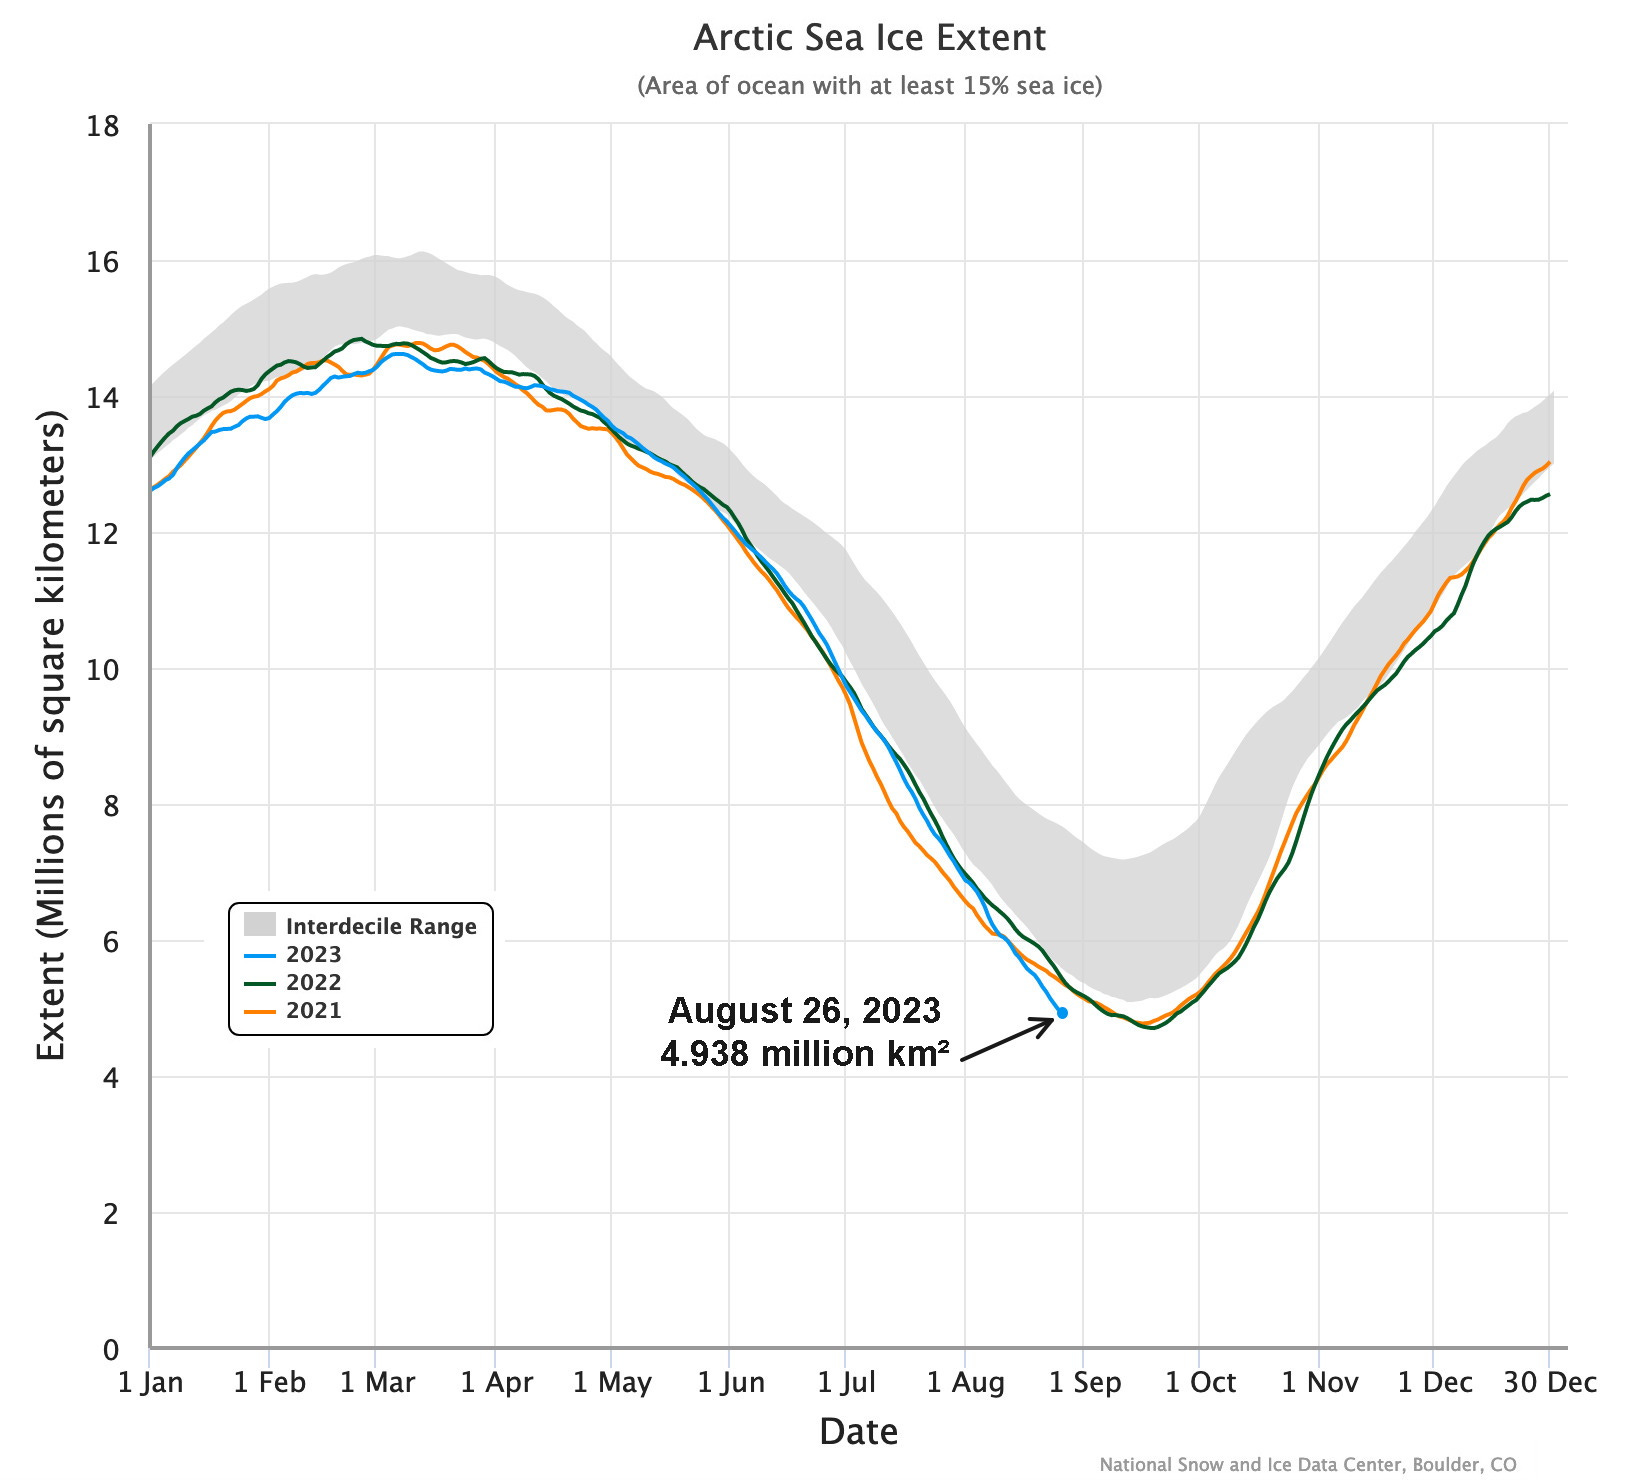
Total sea ice extent in the Arctic as of August 26 was just under 5 million km² in the preliminary NSIDC Sea Ice Index, less than the same date in 2021 or 2022 but above the 2020 level, as shown in Fig 2. This is the seventh lowest extent for the date since 1979. Between 1979 and 2022 the Arctic-wide sea ice extent decreased an average of about 9 percent between August 26 and the minimum extent, mostly likely in the 2nd or 3rd week of September. If that typical decrease holds this year, there is a 50 percent chance that the minimum extent will be between 4.37 and 4.60 million km², so it’s quite likely that this year’s minimum ice extent will be lower than either of the past two years but only a very slight chance to finish in the “top five” lowest.
Greenland Ice Sheet Melt
After the period of well above normal melt area on the Greenland Ice Sheet from late June through mid-July, Fig. 3a shows that the melt area was generally typical from the last week of July through mid-August. However, a short-lived but widespread melt event occurred August 20 to 25 that included the highest percent area of melt on the Ice Sheet so late in the season, with melt occurring on about 45 percent of the ice sheet on August 22. This insures that 2023 total melt area will be the highest since 2012.
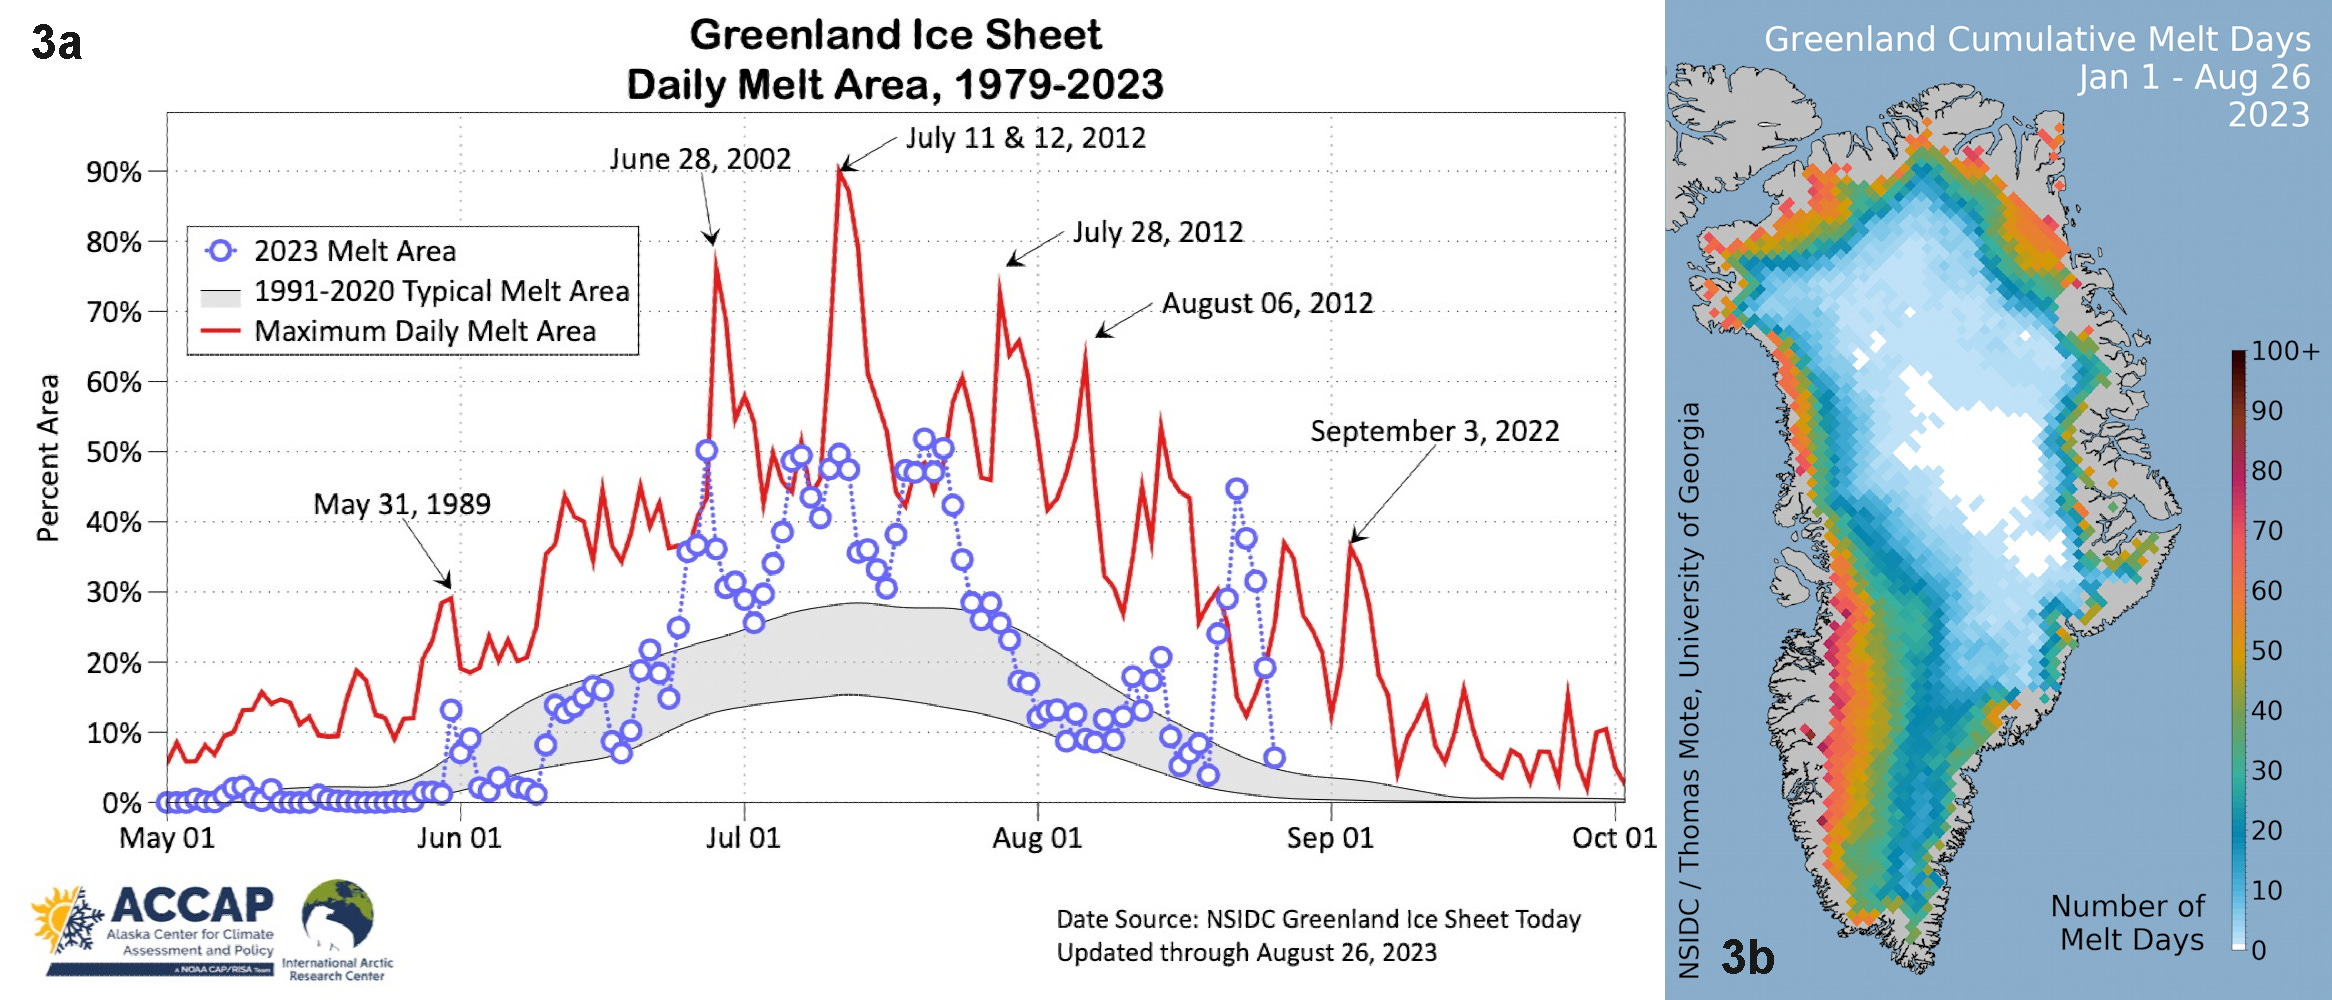
Figure 3b shows the total number of days this year with melt across the ice sheet. There is only small area, mostly the highest portion of ice sheet, that has not experienced a day of melt so far this season.
Total mass change on the Ice Sheet is shown in Fig. 4, showing the ice sheet has loss mass every day except one since late June, with the loss with the Aug 20-25 warmth especially anomalous relative to past years.
